
|
시장보고서
상품코드
1636594
합성 모니터링 시장 : 점유율 분석, 산업 동향 및 통계, 성장 예측(2025-2030년)Synthetic Monitoring - Market Share Analysis, Industry Trends & Statistics, Growth Forecasts (2025 - 2030) |
||||||
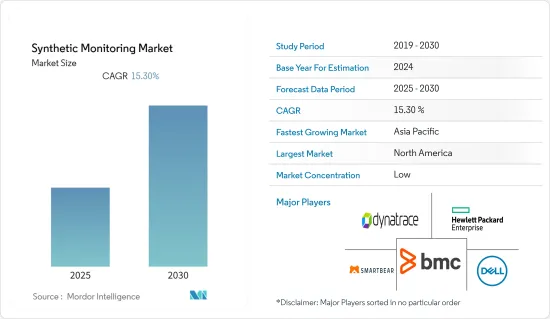
합성 모니터링 시장은 예측 기간 동안 15.30%의 연평균 복합 성장률(CAGR)로 추이할 전망입니다.

주요 하이라이트
- 합성 모니터링에는 웹 브라우저 스크립팅 및 웹 트랜잭션이 포함되어 사이트에서 사용자의 경로를 시뮬레이션하는 행동 스크립트가 만들어집니다. 지속적인 IT 서비스의 성능 모니터링에 도움이 됩니다. 합성 모니터링을 사용하면 영향을 받은 사용자 트랜잭션을 추적하여 문제와 과제를 신속하게 파악하고 해결할 수 있습니다.
- 세계 기업들은 경쟁이 치열해짐에 따라 고객 기반을 유지하기 위해 전반적인 사용자 경험을 개선하는 데 주력하고 있습니다. 이러한 추세는 합성 모니터링 솔루션 수요를 촉진하는 데 중요한 역할을 합니다.
- 능동 모니터링은 많은 IT 팀이 관리하는 복잡한 인프라에서 필수적이며 여러 네트워크, 공급자 및 애플리케이션이 IT 시간과 리소스를 소모합니다. 따라서 합성 모니터링은 사용자가 보고 있는 것을 IT 팀에 지속적으로 표시하므로 이러한 경우 문제를 해결하는 데 도움이 됩니다.
- 또한, 정교한 사용자 경험에 대한 요구가 증가함에 따라 기업은 웹 분석, 소셜 네트워킹, 검색 엔진 최적화와 같은 타사 구성 요소의 합성 모니터링에 주목하고 있습니다.
- 또한, 다양한 목적으로 스마트폰의 애플리케이션 기반 서비스를 이용함으로써 사용자의 행동을 분석하여 사용자 경험을 향상시키기 위한 모바일 애플리케이션 모니터링에 대한 수요가 증가하고 예측 기간을 통해 시장에 이익을 가져올 것으로 예측되고 있습니다.
- 높은 도입 비용, 오감지 및 부정확한 경보, 실시간 모니터링 부족, 배포 후 관리 어려움, 에뮬레이터 기반 모니터링 등으로 인해 합성 모니터링 솔루션을 관리하는 데 문제가 있습니다.
- COVID-19 기간 동안 기업 간의 합성 모니터링 수요가 증가하고 있습니다. 일상 업무와 필수적인 비즈니스 기능에 대응할 수 있기 때문에 원격 근무는 대기업과 중소기업 사이에서 인기가 높아지고 있습니다. 마지막으로 데이터를 보호하고 탁월한 최종 사용자 경험을 보장하기 위해 이러한 발전은 지난 몇 개월 동안 고성능, 안전한 전개 유형에 대한 수요의 꾸준한 상승에 박차를 가하고 있습니다.
합성 모니터링 시장 동향
IT 및 통신은 대폭적인 성장이 예상됩니다.
- 온프레미스 클라우드 및 하이브리드 인프라 관리는 주로 효과적인 모니터링에 의해 결정됩니다. IT 관리자에게는 전통적인 IT 모니터링 솔루션에 의존하는 것이 점점 더 어려워지고 있습니다. 왜냐하면 이러한 도구는 오늘날의 복잡한 IT 랜드스케이프 이외를 가정하여 설계되었기 때문입니다. 이들은 인공적인 모니터링 옵션으로 적극적으로 전환하고 있습니다.
- 현재 애플리케이션 성능 모니터링 솔루션은 IT에 가장 중요한 도구 중 하나입니다. 조직이 클라우드 마이그레이션, 컨테이너 오케스트레이션, 마이크로서비스 등 다양한 혁신 이니셔티브를 다루면서 복잡하고 정교한 기술 랜드스케이프 전반에서 기존 비즈니스 크리티컬 용도의 성능과 최종 사용자 경험을 관리할 필요성이 크게 증가하고 있습니다.
- 많은 IT 팀이 유지하는 복잡한 인프라에서는 많은 네트워크, 제공업체 및 앱이 IT 시간과 리소스를 낭비할 수 있으므로 활성 모니터링이 필수적입니다. 따라서 합성 모니터링은 사용자가 보고 있는 내용을 IT 직원에게 지속적으로 표시하여 이러한 상황에서 문제를 해결할 수 있도록 지원합니다.
- 기존, 온프레미스, 클라우드 기반 IT 시스템 간의 격차를 메우는 첨단 방법은 API 관리를 통한 IT 및 통신 분야 서비스의 현대화입니다. 이를 통해 사용자 환경을 개선하고 조직 전체에서 데이터를 수집, 처리 및 공유하는 방법을 통합합니다. 또한 운영 효율성과 효율성을 촉진합니다.
- 게다가 API 관리를 통해 기존의 온프레미스 IT 시스템과 IT 및 통신 업계의 근대화된 서비스 간의 갭을 메울 수도 있습니다. 기업 간의 효과적인 데이터 수집, 분석, 공유를 통해 사용자 경험이 향상되고 업무 효율도 높아집니다.
북미가 큰 점유율을 차지
- DevOps, 클라우드 컴퓨팅, SaaS(Software-as-a-Service) 기반 애플리케이션, Bring Your Device와 같은 혁신적인 기술의 채택이 증가하고 있기 때문에 북미가 조사 대상 시장에서 가장 큰 점유율을 차지하고 시장을 독점할 것으로 예측되고 있습니다.
- 또한 북미에서는 기존 시장에서도 소비자가 다양한 서비스를 온라인 플랫폼에서 이용하는 경향이 강해지고 있으며, 기업은 애플리케이션 관리 서비스의 향상에 주력하고 있습니다.
- 실시간 분석, 로그 관리, 고급 분석 기능을 갖춘 최신 합성 모니터링 시스템에 대한 수요가 높아지고 있으며, 이 지역의 합성 모니터링 시장의 확대에 기여하고 있습니다.
- 지방정부는 또한 서비스 수준 계약(특정 서비스와 관련된 2개 이상의 당사자 간의 서면 계약)을 강화하고 있습니다. 특정 계약을 통해 이러한 문서는 공급자와 고객에게 지침을 제공합니다.
- 또한 이 지역의 기업은 성능 문제를 예측하고 해결하고 더 나은 고객 경험을 제공할 수 있도록 최신 소프트웨어 팀에 첨단 기술을 솔선하여 제공합니다.
- 또한 응답 시간 단축, 사용자 경험 향상, 저비용 실현, 애플리케이션 성능 최적화를 목표로 하는 기업의 경쟁 격화도 북미 부문에 이익이 될 것으로 예상됩니다. 따라서 애플리케이션 성능 개선에 대한 투자가이 부문의 주요 촉진요인이 될 것으로 예상됩니다.
합성 모니터링 산업 개요
합성 모니터링 시장은 더 결속력을 높여야합니다. 톱 기업은 신제품 출시, 계약, 확대, 합작 투자, 파트너십, 인수, 기타 전술 등 이 시장의 발자취를 확대하기 위해 다양한 방법을 채택하고 있습니다. 대부분의 기업은 IT 인프라를 관리하고 모니터링하기 위해 최소 2개 또는 3개의 기술을 조합하여 사용합니다. SaaS, 오픈소스 소프트웨어 및 폐쇄 소스 솔루션의 세 가지는 도구의 일반적인 배포 메커니즘입니다. CA Technologies, Dynatrace LLC, SmartBear Software 등이 필수적인 참여 기업입니다.
2022년 11월-Dynatrace LLC는 아랍에미리트(UAE)(UAE)에서 호스팅되는 Microsoft Azure에서 Dynatrace(R) 플랫폼을 사용할 수 있도록 발표했으며, 이 지역에서 호스팅된 최초의 SaaS 기반 관측성과 애플리케이션 보안 플랫폼이 되었습니다. Dynatrace(R) 소프트웨어 인텔리전스 플랫폼은 광범위하고 깊은 관측성과 지속적인 런타임 애플리케이션 보안을 최첨단 AIOps와 자동화와 결합하여 엄청난 규모의 데이터에서 대답과 지능적인 자동화를 제공합니다. UAE에서 호스팅되는 Microsoft Azure에서 기본적으로 사용할 수 있기 때문에 공동 사용자는 향상된 성능과 데이터 주권에서 혜택을 누릴 수 있습니다.
기타 혜택 :
- 엑셀 형식 시장 예측(ME) 시트
- 3개월간의 애널리스트 서포트
목차
제1장 서론
- 조사의 전제조건 및 시장 정의
- 조사 범위
제2장 조사 방법
제3장 주요 요약
제4장 시장 인사이트
- 시장 개요
- 업계의 매력도-Porter's Five Forces 분석
- 공급기업의 협상력
- 소비자의 협상력
- 신규 진입업자의 위협
- 경쟁 기업간 경쟁 관계
- 대체품의 위협
- 기술 스냅샷
제5장 시장 역학
- 시장 성장 촉진요인
- 서비스 레벨 합의(SLA) 목표 모니터링 요구 증가
- 애플리케이션 성능 관리에 대한 수요 증가
- DevOPs에 대한 요구 증가
- 시장의 과제
- 높은 실장 비용
- 본격적인 감시 기능이 없는 것이 성장에 영향
제6장 시장 세분화
- 유형별
- API 모니터링
- 웹사이트 감시
- 모바일 애플리케이션 모니터링
- 업계별
- BFSI
- IT 및 통신
- 소매
- 정부기관
- 제조 및 자동차
- 군 및 방위
- 기타 최종 사용자 업계별
- 지역별
- 북미
- 유럽
- 아시아태평양
- 라틴아메리카
- 중동 및 아프리카
제7장 경쟁 구도
- 기업 프로파일
- Dynatrace LLC
- Smart Bear Software Inc.
- HP Enterprise Company
- Dell Technologies Inc.
- BMC Software Inc.
- Oracle Corporation
- IBM Corporation
- Broadcom Inc.
- Rigor Inc.
- SolarWinds Inc.
- AppDynamics Inc.(Cisco Systems Inc.)
- New Relic Inc.
- Apica AB
- Monitis Inc.(GFI Software)
제8장 투자 분석
제9장 시장의 미래
AJY 25.02.12The Synthetic Monitoring Market is expected to register a CAGR of 15.30% during the forecast period.
Key Highlights
- Synthetic monitoring involves web browser script recordings or web transactions, wherein behavioral scripts are created to simulate a user's path on a site. It helps monitor ongoing IT service performance. Synthetic monitoring, by tracking affected user transactions, ensures that the problems and issues can be quickly identified and resolved, ideally before users complain or notice.
- Businesses worldwide have focused on enhancing the overall user experience to retain their customer base amidst high competition. This trend has been playing a significant role in driving demand for synthetic monitoring solutions.
- Active monitoring is essential in the complex infrastructure many IT teams manage, where multiple networks, providers, and applications can consume IT time and resources. Therefore, synthetic monitoring helps troubleshoot these cases, as it continuously shows IT teams what users see.
- Additionally, to meet the growing need for sophisticated user experiences, businesses are turning to synthetic monitoring for third-party components like web analytics, social networking, search engine optimization, and others.
- Moreover, the increasing use of smartphone application-based services for various purposes is anticipated to increase demand for mobile application monitoring to analyze user behavior and improve user experience, which is anticipated to benefit the market over the course of the forecast period.
- Due to high implementation costs, false positives and inaccurate alarms, a lack of real-time monitoring, difficulties with post-implementation administration, and emulator-based monitoring, managing synthetic monitoring solutions can be problematic.
- The demand for synthetic monitoring among businesses has increased during COVID-19. Due to its ability to keep up with daily operations and essential business functions, remote working is growing in popularity among large and small organizations. Lastly, to secure data and ensure a superior end-user experience, these advances have fueled a steady rise in demand for high-performance and secure deployment types over the past few months.
Synthetic Monitoring Market Trends
IT and Telecommunications is Expected to Show Significant Growth
- On-premise cloud or hybrid infrastructure management is determined mainly by effective monitoring. It's become more and more challenging for IT managers to rely on traditional IT monitoring solutions because those tools were designed for something other than today's complicated IT landscape. These are moving aggressively toward artificial monitoring options.
- Presently, application performance monitoring solutions are one of the most critical tools for IT. As organizations undertake various transformational initiatives, like cloud migration, container orchestration, and microservices, the need to manage the performance of existing business-critical applications and end-user experience across complex and sophisticated technology landscapes has increased considerably.
- Active monitoring is crucial in the complex infrastructure that many IT teams maintain, where numerous networks, providers, and apps can all use up IT time and resources. Therefore, synthetic monitoring aids in troubleshooting in these situations by continuously showing IT staff what users view.
- An advanced method for bridging the gap between conventional, on-premise, and cloud-based IT systems is modernizing IT and telecom sector services through API management. It improves user experience while consolidating how data is collected, processed, and shared throughout organizations. It also promotes operational efficiency and effectiveness.
- Additionally, it is feasible to close the gap between conventional, on-premises IT systems and modernized services in the IT and telecom industries through API administration. Effective data collection, analysis, and sharing across companies enhance user experience while boosting operational effectiveness.
North America Accounted for a Significant Share
- Due to the increasing adoption of innovative technologies like DevOps, cloud computing, software-as-a-service (SaaS)-based applications, and bring your device, North America is predicted to have the most significant share of and dominate the market under study.
- Moreover, in North America, consumers increasingly prefer online platforms for varied services, even in conventional markets; companies are focusing on improving their application management services.
- The demand for modern synthetic monitoring systems with real-time analysis, log management, and advanced analytics is growing, helping the synthetic monitoring market in the area expand.
- The regional governments are also enhancing service level agreements, written agreements between two or more parties relating to a particular service. Throughout a specific contract, these documents offer the provider and client instructions.
- Enterprises in the region are also taking the lead in offering advanced technology to modern software teams to predict and address performance issues and enable them to deliver better customer experiences.
- Moreover, the increasing competitive intensity in the country, with companies striving to provide lower response time, better user experience, achieve low costs, and optimize application performance, is expected to benefit the North American segment. Thus, investments in improving the application performance are expected to be the primary driver for the segment.
Synthetic Monitoring Industry Overview
The synthetic monitoring market needs to be more cohesive. Top companies employ various techniques to expand their footprints in this market, including new product releases, agreements, expansions, joint ventures, partnerships, acquisitions, and other tactics. Most companies across the board use a minimum of two or three combined technologies to manage and monitor their IT infrastructure. SaaS, open-source software, and closed-source solutions are three common distribution mechanisms for the tools. CA Technologies, Dynatrace LLC, SmartBear Software, etc., are essential participants.
In November 2022, Dynatrace LLC announced the availability of the Dynatrace(R) platform on Microsoft Azure hosted in the United Arab Emirates (UAE), making it the first SaaS-based observability and application security platform hosted in the region. The Dynatrace(R) Software Intelligence Platform combines broad and deep observability and continuous runtime application security with the most advanced AIOps and automation to provide answers and intelligent automation from data at an enormous scale. As a result of its native availability on Microsoft Azure hosted in the UAE, joint customers will benefit from enhanced performance and data sovereignty.
Additional Benefits:
- The market estimate (ME) sheet in Excel format
- 3 months of analyst support
TABLE OF CONTENTS
1 INTRODUCTION
- 1.1 Study Assumptions and Market Definition
- 1.2 Scope of the Study
2 RESEARCH METHODOLOGY
3 EXECUTIVE SUMMARY
4 MARKET INSIGHTS
- 4.1 Market Overview
- 4.2 Industry Attractiveness - Porter's Five Forces Analysis
- 4.2.1 Bargaining Power of Suppliers
- 4.2.2 Bargaining Power of Consumers
- 4.2.3 Threat of New Entrants
- 4.2.4 Intensity of Competitive Rivalry
- 4.2.5 Threat of Substitutes
- 4.3 Technology Snapshot
5 MARKET DYNAMICS
- 5.1 Market Drivers
- 5.1.1 Increasing Need for Monitoring Service Level Agreement (SLA) Targets
- 5.1.2 Rising Demand for Application Performance Management
- 5.1.3 Increasing Need for DevOPs
- 5.2 Market Challenges
- 5.2.1 Higher Implementation Costs
- 5.2.2 No Real Monitoring Feature can Affect Growth
6 MARKET SEGMENTATION
- 6.1 By Type
- 6.1.1 API Monitoring
- 6.1.2 Website Monitoring
- 6.1.3 Mobile Application Monitoring
- 6.2 By End-User Vertical
- 6.2.1 BFSI
- 6.2.2 IT and Telecommunication
- 6.2.3 Retail
- 6.2.4 Government
- 6.2.5 Manufacturing and Automotive
- 6.2.6 Military and Defense
- 6.2.7 Other End-user Verticals
- 6.3 By Geography
- 6.3.1 North America
- 6.3.2 Europe
- 6.3.3 Asia Pacific
- 6.3.4 Latin America
- 6.3.5 Middle East and Africa
7 COMPETITIVE LANDSCAPE
- 7.1 Company Profiles
- 7.1.1 Dynatrace LLC
- 7.1.2 Smart Bear Software Inc.
- 7.1.3 HP Enterprise Company
- 7.1.4 Dell Technologies Inc.
- 7.1.5 BMC Software Inc.
- 7.1.6 Oracle Corporation
- 7.1.7 IBM Corporation
- 7.1.8 Broadcom Inc.
- 7.1.9 Rigor Inc.
- 7.1.10 SolarWinds Inc.
- 7.1.11 AppDynamics Inc. (Cisco Systems Inc.)
- 7.1.12 New Relic Inc.
- 7.1.13 Apica AB
- 7.1.14 Monitis Inc. (GFI Software)

