|
시장보고서
상품코드
1637807
애플리케이션 성능 관리 시장 : 점유율 분석, 산업 동향과 통계, 성장 예측(2025-2030년)Application Performance Management - Market Share Analysis, Industry Trends & Statistics, Growth Forecasts (2025 - 2030) |
||||||
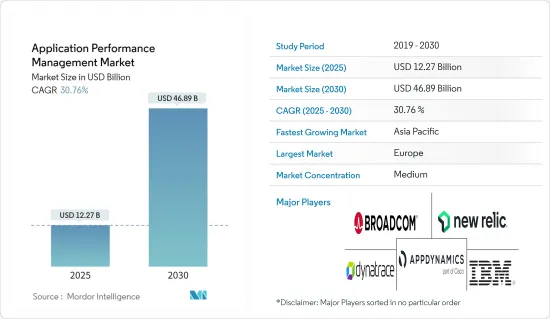
애플리케이션 성능 관리 시장 규모는 2025년 122억 7,000만 달러, 2030년 468억 9,000만 달러로 추정되며, 예측 기간(2025-2030년)의 CAGR은 30.76%에 달할 것으로 예측됩니다.

애플리케이션 성능 모니터링(APM)은 효율성과 생산성을 높이기 위해 다양한 수준에서 소프트웨어 시스템을 분산시킵니다. 또한 빅데이터를 분석하여 문제를 신속하게 해결할 수 있습니다.
주요 하이라이트
- 주요 전략 중 하나는 중요한 데이터 분석이며 비즈니스 세계화, 모바일 및 클라우드 컴퓨팅의 보급, 비즈니스 프로세스의 해결, 분석 및 개선을 목표로 하는 기업 간의 경쟁 수준 증가, 애플리케이션 성능 모니터링 기술 개발, 클라우드 및 모바일 컴퓨팅에 대한 소비자 수요 증가와 함께 시장 성장을 가속화하고 있습니다.
- APM은 애플리케이션 발견 및 종속성 매핑(ADDM)을 지원하고 사용자에게 경고를 보내면서 모든 서버와 애플리케이션을 식별하며 위협에 대한 대응 절차를 자동화합니다. 보고를 용이하게 하고 개인화된 대시보드를 제공합니다. 또한 용도 관리 소프트웨어 제품은 확장성이 높고 배포 비용이 낮습니다.
- 게다가 로그 관리 확대, 연구개발 진전, 고급 APM 분석의 개발은 추정기간을 통해 애플리케이션 성능 모니터링 시장의 확대를 뒷받침합니다.
- 그러나 시장 성장을 제한하는 주요 요인으로는 최종 사용자 인지도 필요성, 자금 조달 비용 상승, 애플리케이션 성능 모니터링(APM)에 대한 소비자 인식 부족 등이 있습니다. 위의 예측 기간 동안 애플리케이션 성능 모니터링 시장은 비즈니스 수요 증가와 변화로 인한 문제에 직면할 것입니다.
애플리케이션 성능 관리 시장 동향
대기업 채용이 시장 성장 촉진
- 이러한 시스템을 독립적으로 대규모로 호스팅할 수 있는 조직은 직접적인 소프트웨어 솔루션으로 이어집니다. 이 수요는 보안과 데이터 관리의 개선에 의해 초래됩니다. 소프트웨어 솔루션으로 직접 제공되는 APM 시스템은 고객의 요구에 맞게 커스텀 튜닝이 가능하며 제어 대상 용도과 원활하게 통합될 수 있습니다. 매개변수에 완벽하게 액세스할 수 있어 애널리틱스를 강화하고 관리할 수 있을 뿐만 아니라 더 나은 기능을 제공할 수 있습니다.
- 또한 하이브리드 클라우드의 기능이 늘어남에 따라 더 많은 대기업이 APM 시스템을 통합하게 되어 소프트웨어 솔루션의 온프레미스 배포와 퍼블릭 클라우드로의 확장으로 이어지고 있습니다. APM 시스템의 소프트웨어는 성능, 비즈니스 및 사용자 경험을 동시에 분석할 수 있는 통합 모델로 점차 마이그레이션하고 있습니다.
- 다양한 부문 간의 상호 연결성과 밀접한 연결이 이러한 추세에 변화를 가져옵니다. 예를 들어 애플리케이션 성능은 사용자 경험에 영향을 미치며 비즈니스 분석은 피크 시간과 종료 지점을 식별하는 데 도움이 됩니다. 애플리케이션 성능 관리 시스템의 전반적인 접근 방식은 그 기능을 획기적으로 확장하여 조사 대상 산업을 크게 뒷받침하고 있습니다.
- 수많은 프로그램이 애플리케이션 성능 관리를 제공하며, 이로 인해 몇 가지 장점이 있습니다. 예를 들어 조직의 웹 서버를 모니터링하는 솔루션이 이 범주에 있습니다. 또한 앱 검색 및 종속성 매핑(ADDM)을 지원하고, 모든 서버와 앱을 찾아 분류하고, 사용자에게 경고하고, 위협 관련 활동을 자동화합니다. 또한 보고를 용이하게 하고 개인화된 대시보드를 제공합니다. 또한 용도 관리 소프트웨어 제품은 확장성이 높고 배포 비용이 낮습니다.
- APM 도구를 효과적으로 사용하면 고객이 기술 수준에서 비즈니스와 상호 작용할 때 고객 경험에 대한 중요한 통찰력을 얻을 수 있으며 기업이 기술적 성과와 목표를 더 잘 일치시킬 수 있는 귀중한 기회를 얻을 수 있습니다. 고객 경험 향상에 대한 수요 증가가 시장 확대의 원동력이 될 것으로 예상됩니다.
유럽이 큰 시장 점유율을 차지
- 중유럽의 APM 서비스 제공업체는 적극적으로 M&A에 참여하여 이 분야의 확대를 지원합니다. 네덜란드에 본사를 둔 Azure 전문가인 MSP인 Sentia는 첨단 미션 크리티컬 클라우드 애플리케이션을 위한 유럽 매니지드 서비스의 업계 리더가 되었기 때문에 네덜란드 덴마크의 MSP Ymir을 인수했습니다. ExtraHop, AppDynamics, Dynatrace 등이 Ymor와 정기적으로 협업하는 기업이지만 후자는 애플리케이션 성능 전문가로 알려져 있습니다.
- 효율성 향상과 비용 절감을 위해 유럽의 많은 정부가 IT 서비스를 클라우드로 전환하고 있습니다. 정부 기관은 분리된 시대 지연 레거시 시스템을 중앙 집중식 공유 서비스로 대체함으로써 IT 리소스를 핵심 비즈니스에 집중하고 데이터 보안을 강화하고 인적 자원을 우선시할 수 있습니다.
- Amazon과 같은 기업은 클라우드 구축 증가에 대응하기 위해 데이터 보전 및 애플리케이션 호스팅을 위한 S3 클라우드 스토리지 클래스를 제공합니다. 비용이 낮기 때문에 이 지역의 중소기업에게는 이러한 솔루션이 매력적인 선택이 되었습니다. 용도을 호스팅하기 위한 데이터센터와 웹 서버의 사용 확대는 유럽 시장에서 애플리케이션 성능 관리에 대한 수요를 끌어올리고 있습니다.
- 이 지역의 비즈니스 프로세스를 해결, 평가 및 개선하는 요구는 기업 세계화의 진전, 모바일 컴퓨팅 및 클라우드 컴퓨팅의 보급, 비즈니스 경쟁의 격화로 이어지고 있습니다.
- 유럽의 APM 기업은 자사 제품을 AIOps 도구로 검토하는 데 관심을 보이기 시작했습니다. IT 운영 및 기타 조직에서는 이미 데이터가 풍부하게 존재하고 있으며, 마이크로서비스, 클라우드 및 사물 인터넷(IoT)이 발전함에 따라 이러한 상황이 더욱 복잡해질 것으로 예상됩니다.
애플리케이션 성능 관리 업계 개요
애플리케이션 성능 관리 시장 경쟁은 적당합니다. 주요 기업은 New Relic Inc., Dynatrace LLC, IBM Corp. 등입니다.
2023년 2월, New Relic은 Microsoft Azure Alliance와의 제휴를 통해 시장 범위를 확대할 것이라고 발표했습니다. 이렇게 하면 Microsoft Azure Marketplace에서 Azure Native New Relic 서비스를 사용할 수 있으며 Azure 포털을 통해 New Relic에 액세스할 수 있는 개발자 및 DevOps 전문가에게 이점을 제공합니다.
2022년 11월, Dynatrace는 고급 관측 가능성과 AIOps를 AWS Compute Optimizer로 확장했습니다. 이 서비스는 고객의 리소스 사용 데이터를 사용하여 Amazon Web Services(AWS) 리소스 사용률을 향상시키기 위한 제공을 권장했습니다. 이 지원을 통해 Dynatrace 플랫폼은 고객의 AWS 환경 내의 모든 Amazon Elastic Compute Cloud(Amazon EC2) 인스턴스를 거의 실시간으로 자동으로 캡처하고 분석하고 Dynatrace의 원인 AIOps와 자동화 기능을 사용하여 Amazon EC2 소비를 비용, 서비스 신뢰성 및 성능을 위해 지속적으로 최적화할 수 있습니다.
기타 혜택:
- 엑셀 형식 시장 예측(ME) 시트
- 3개월간의 애널리스트 서포트
목차
제1장 서론
- 조사의 전제조건과 시장 정의
- 조사 범위
제2장 조사 방법
제3장 주요 요약
제4장 시장 인사이트
- 시장 개요
- 업계의 매력도 - Porter's Five Forces 분석
- 공급기업의 협상력
- 소비자의 협상력
- 신규 진입업자의 위협
- 경쟁 기업간 경쟁 관계
- 대체품의 위협
- 시장에 대한 COVID-19의 영향 평가
제5장 시장 역학
- 시장 성장 촉진요인
- 디지털 비즈니스 성공을 위한 최종 사용자 만족도에 대한 요구 증가
- 시장의 과제
- 최종 사용자의 인식 부족과, 다른 프로바이더가 제공하는 유사 요인의 정량화에 있어서의 편차
- COVID-19가 업계에 미치는 영향 평가
제6장 시장 세분화
- 전개별
- 온프레미스
- 클라우드
- 기업 규모별
- 중소기업
- 대기업
- 지역별
- 북미
- 유럽
- 아시아
- 호주 및 뉴질랜드
- 라틴아메리카
- 중동 및 아프리카
제7장 경쟁 구도
- 벤더의 시장 점유율 분석
- 기업 프로파일
- AppDynamics LLC(Cisco Systems Inc.)
- New Relic Inc.
- Dynatrace LLC
- IBM Corp.
- Broadcom Inc.
- Microsoft Corporation
- Mic Focus International PLC
- Datadog Inc.
- SignalFX(part of Splunk Inc.)
- Akamai Technologies Inc.
제8장 투자 분석
제9장 시장의 미래
JHS 25.02.12The Application Performance Management Market size is estimated at USD 12.27 billion in 2025, and is expected to reach USD 46.89 billion by 2030, at a CAGR of 30.76% during the forecast period (2025-2030).
Application performance monitoring (APM) distributes software systems at different levels to increase efficiency and productivity. Also, it helps analyze big data to solve problems quickly.
Key Highlights
- One of the primary strategies is significant data analytics, which is accelerating market growth along with business globalization, the proliferation of mobile and cloud computing, the increasing level of competition among companies to solve, analyze, and improve business processes, technological development in application performance monitoring, and rising consumer demand for cloud and mobile computing.
- APM aids application discovery and dependency mapping (ADDM), which identifies all servers and apps while alerting users and automating threat response procedures. It facilitates reporting and offers a personalized dashboard. Additionally, application management software products have great scaling potential and are less expensive to deploy.
- Additionally, growing log management, growing R&D, and developing advanced APM analytics will help the application performance monitoring market expand throughout the estimated period.
- However, the main factors limiting market growth include a need for end-user awareness, rising funding costs, and a lack of consumer awareness of application performance monitoring (APM). In the forecast period mentioned above, the application performance monitoring market will face challenges from rising and shifting business demand.
Application Performance Management Market Trends
Adoption in Large Enterprises to Drive Market Growth
- Organizations capable of hosting these systems independently and on a large scale are drawn to direct software solutions. The demand for this is driven by improved security and data control. APM systems that are directly supplied as software solutions can also be custom tuned to client needs, integrating seamlessly with the application that has to be controlled. Due to total access to parameters, this not only enables analytics enhancement and administration but also offers better capabilities.
- Additionally, as hybrid clouds' capabilities advance, more large businesses are integrating APM systems, which leads to the on-premises deployment of software solutions and their extension to public clouds. The software for APM systems is gradually moving towards unified models, which can analyze performance, business, and user experience simultaneously.
- The interconnectedness and intimate ties between the various segments have caused this trend to change. For instance, application performance impacts user experience, and business analysis can help identify peak hours or exit points. The application performance management systems' holistic approach has dramatically expanded their functionality, consequently significantly boosting the industry under study.
- Numerous programs provide application performance management, which has several benefits. For instance, solutions for monitoring an organization's web server can be found in this category. Additionally, it aids in app discovery and dependency mapping (ADDM), finds and classifies all servers and apps, alerts users, and automates threat-related activities. It facilitates reporting and offers a personalized dashboard. Additionally, application management software products have great scaling potential and are less expensive to deploy.
- When used effectively, APM tools offer significant insight into the customer experience when clients interact with a business on a technical level, providing a rare chance for companies to match their technical performance with their goals better. The growing demand to enhance the customer experience is anticipated to fuel market expansion.
Europe to Hold Significant Market Share
- The Central Europe region's APM service providers aggressively participate in mergers and acquisitions to support the sector's expansion. To become the industry leader in European managed services for sophisticated and mission-critical cloud applications, Sentia, a Netherlands-based Azure Expert MSP, has acquired Dutch-Danish MSP Ymir. While ExtraHop, AppDynamics, and Dynatrace are among the companies that regularly cooperate with Ymor, the latter is known as an expert in application performance.
- To increase efficiency and cut costs, many governments in the European region are migrating their IT services to the cloud. Government organizations can concentrate their IT resources on core business, increase data security, and prioritize human resources by replacing disconnected and outdated legacy systems with centralized shared services.
- Companies like Amazon provide S3 cloud storage classes for data preservation and application hosting to address increased cloud adoption. Lower costs make these solutions an attractive option for the region's SMEs. The expanding use of data centers and web servers to host applications has boosted the European market's demand for application performance management.
- The need to solve, assess, and improve business processes in this region is driven by growing company globalization, the spread of mobile and cloud computing, and rising levels of business competition.
- European APM companies have begun to exhibit interest in having their products considered as AIOps tools. Data is already abundant in IT operations and other organizations, and as microservices, the cloud, and the Internet of Things (IoT) develop, this situation is expected to get more complex.
Application Performance Management Industry Overview
The application performance management market is moderately competitive. Major players include New Relic Inc., Dynatrace LLC, and IBM Corp.
In February 2023, New Relic announced it would expand its market reach with the Microsoft Azure Alliance, where the availability of the Azure Native New Relic Service in the Microsoft Azure Marketplace will benefit developers and DevOps professionals who can access New Relic through the Azure portal.
In November 2022, Dynatrace extended advanced observability and AIOps to AWS Compute Optimizer. This service used customers' resource utilization data to recommend providing Amazon Web Services (AWS) resources for improved utilization. This support enabled the Dynatrace platform to automatically capture and analyze all Amazon Elastic Compute Cloud (Amazon EC2) instances in customers' AWS environments in near-real time and use Dynatrace causal AIOps and automation capabilities to continuously optimize Amazon EC2 consumption for cost, service reliability, and performance.
Additional Benefits:
- The market estimate (ME) sheet in Excel format
- 3 months of analyst support
TABLE OF CONTENTS
1 INTRODUCTION
- 1.1 Study Assumptions and Market Definition
- 1.2 Scope of the Study
2 RESEARCH METHODOLOGY
3 EXECUTIVE SUMMARY
4 MARKET INSIGHTS
- 4.1 Market Overview
- 4.2 Industry Attractiveness - Porter's Five Forces Analysis
- 4.2.1 Bargaining Power of Suppliers
- 4.2.2 Bargaining Power of Consumers
- 4.2.3 Threat of New Entrants
- 4.2.4 Intensity of Competitive Rivalry
- 4.2.5 Threat of Substitute Products
- 4.3 Assessment of the Impact of COVID -19 on the Market
5 MARKET DYNAMICS
- 5.1 Market Drivers
- 5.1.1 Increasing need for End-user satisfaction for successful Digital Business Operations
- 5.2 Market Challenges
- 5.2.1 Lack of End user Awareness and Variability in the Quantification of Similar Factors Provided by Different Providers
- 5.3 Assessment of Impact of COVID-19 on the Industry
6 MARKET SEGMENTATION
- 6.1 By Deployment
- 6.1.1 On-premise
- 6.1.2 Cloud
- 6.2 By Enterprise Size
- 6.2.1 Small and Medium Enterprises
- 6.2.2 Large Enterprises
- 6.3 By Geography
- 6.3.1 North America
- 6.3.2 Europe
- 6.3.3 Asia
- 6.3.4 Australia and New Zealand
- 6.3.5 Latin America
- 6.3.6 Middle East and Africa
7 COMPETITIVE LANDSCAPE
- 7.1 Vendor Market Share Analysis
- 7.2 Company Profiles
- 7.2.1 AppDynamics LLC (Cisco Systems Inc.)
- 7.2.2 New Relic Inc.
- 7.2.3 Dynatrace LLC
- 7.2.4 IBM Corp.
- 7.2.5 Broadcom Inc.
- 7.2.6 Microsoft Corporation
- 7.2.7 Mic Focus International PLC
- 7.2.8 Datadog Inc.
- 7.2.9 SignalFX (part of Splunk Inc.)
- 7.2.10 Akamai Technologies Inc.