


|
시장보고서
상품코드
1637824
분산형 태양광 발전 시장 - 점유율 분석, 산업 동향 및 통계, 성장 예측(2025-2030년)Distributed Solar Power Generation - Market Share Analysis, Industry Trends & Statistics, Growth Forecasts (2025 - 2030) |
||||||
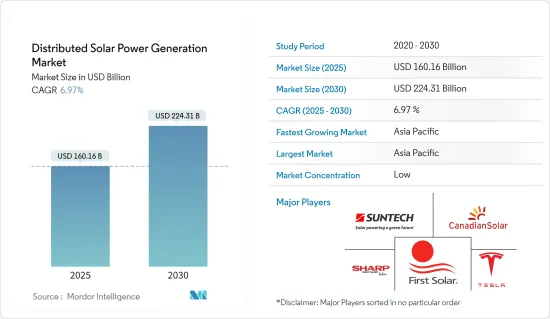
분산형 태양광 발전 시장 규모는 2025년에 1,601억 6,000만 달러로 추정되며, 예측 기간(2025-2030년)의 CAGR은 6.97%로, 2030년에는 2,243억 1,000만 달러에 달할 것으로 예측됩니다.
시장은 2020년 COVID-19에 의해 부정적인 영향을 받았습니다. 현재 시장은 유행 이전 수준에 도달했습니다.
주요 하이라이트
- 중기적으로는 환경문제에 대한 관심 증가와 태양광 패널 설치에 대한 우대조치, 세제상 우대조치에 관한 정부의 시책, 고액의 송전망 확대 비용도 조사 대상 시장의 성장을 가속할 것으로 예상됩니다.
- 반면에 분산형 태양광이 주전원으로 작동하지 않는 것은 시장 성장에 부정적인 영향을 미칠 수 있으며 시장의 주요 억제요인 중 하나입니다.
- 제조가 용이하고 고효율, 우수한 반도체 거동을 보여주는 페로브스카이트형 태양전지와 같은 기술의 진보는 예측 기간 동안 성장 기회를 가져올 것으로 기대되고 있습니다.
- 아시아태평양이 시장을 독점하고 있으며 예측 기간 동안 CAGR도 가장 높을 것입니다. 성장의 주된 원인은 환경 문제에 대한 관심 증가를 배경으로 중국과 인도와 같은 국가 수요가 대부분을 차지하고 있다는 것입니다.
분산형 태양광 발전 시장 동향
태양광 발전 시스템의 가격 하락과 설치 비용이 시장을 견인할 전망
- 지난 10년간 태양광 발전 패널의 평균 비용은 전 세계적으로 90% 가까이 떨어졌습니다. 기타 부품 가격도 2011년 이후 크게 하락해 분산형 및 실용규모 태양광 발전의 평준화 전기요금(LCOE)을 인하하고 있습니다.
- 기술 경제적 요인과 지정학적 요인이 겹쳐지며, 태양광 패널의 가격은 약간 떨어질 것으로 추정됩니다. 그럼에도 불구하고 예측 기간 동안 태양광 발전 패널의 가격은 계속 하락할 것으로 예상됩니다.
- 미국 국립 신재생에너지실(NREL)에 따르면 2010년 이후 미국에서는 주택용, 상업용 옥상, 공공시설 규모의 태양광발전시스템 비용이 각각 64%, 69%, 82% 하락하고 있습니다. 유럽과 미국의 태양전지판 가격 하락이 주요 원인입니다. 이 시나리오는 시장에 긍정적인 영향을 미치고이 지역의 태양전지판 수요를 촉진합니다.
- 가격 하락으로 많은 주택 및 상업 소비자가 에너지 비용과 회수 시간을 줄이기 위해 옥상 태양광 발전 시스템을 선택했습니다. 또한 2020년까지 태양광 발전 모듈의 가격은 약 90% 하락했습니다. 그러나 2021년에는 돌변해 지난 10년간 처음으로 가격이 18%나 상승했습니다.
- 미국 신재생에너지실(NREL)에 따르면 2022년 2분기 Mono C-Si 태양전지 모듈의 평균 판매 가격은 0.25달러/와트였으며 2022년 1분기 0.26달러/와트보다 낮았습니다. 모듈 가격의 하락에 의해 분산형 태양광 발전 수요가 높아지고 있습니다.
- 이러한 고도로 모듈화된 기술의 산업화는 규모의 경제, 제조 공정 개선 및 경쟁 공급망과의 경쟁 격화로 인한 놀라운 이익을 제공합니다. 태양광 발전 시스템의 비용이 전반적으로 저하되고 있는 것은 독일과 같은 국가에서 효과적인 고정가격임베디드제도가 실시되고 있기 때문입니다.
- 태양광 발전 비용 및 배터리 비용 감소는 최근 분산형 태양에너지 시장의 주요 촉진요인이 되고 있습니다. 이 추세는 예측 기간 동안 계속될 것으로 예상됩니다.
- 리튬 이온 배터리의 가격은 2010년 1,000달러/kWh에서 2021년 132달러/kWh로 86% 이상 하락했습니다.
- 따라서, 배터리와 태양광 모듈의 비용 효과적인 개선은 예측 기간 동안 분산형 태양에너지 시장에 이익을 가져올 것으로 예상됩니다.
아시아태평양이 시장을 독점할 전망
- 아시아태평양은 2022년 분산형 태양광 발전 시장을 독점하고 있으며, 향후 수년간 지배력을 유지할 것으로 예상됩니다. 이 지역은 분산형 에너지 시스템(DES), 특히 오프 그리드 태양광 및 주거용 태양광 발전의 확대에 큰 잠재력을 가지고 있습니다. 송전망 인프라의 비효율성, 전력 공급 부족, 분산 기술의 확장성이 이 지역, 특히 중국과 인도에서의 전개에 길을 열고 있습니다.
- 중국에서는 경제 성장과 도시화로 전력 수요가 증가하고 있습니다. 2015년 이후 이 나라의 전력 수요는 연간 7% 증가하고 있습니다. 2022년 전력 수요는 3.6% 증가하여 8,637TWh에 이릅니다.
- 국제재생가능에너지기구(International Renewable Energy Agency)에 따르면 2022년 중국 태양광 발전의 총 설비 용량은 약 3,924.4GW로 2021년에 비해 28% 증가했습니다. 중국국가능원국(NEA)에 따르면 2023년 1월과 2월에 새로 설치된 태양광 발전 용량은 2,023만kW로 중국의 태양광 발전 설비는 413만kW를 넘어섰습니다.
- 중국은 상당히 이전부터 주택 및 상업시설의 최종 사용자에게 옥상 태양전지판의 설치를 장려하고 분산형 태양광 발전 증가에 주력해 왔습니다.
- 싱가포르의 태양광 발전 용량은 지난 몇 년동안 증가하고 있습니다. 국제재생가능에너지기구에 따르면 싱가포르의 태양광 발전 설비 용량은 2022년 572MW에 달했으며 2021년 대비 15% 성장을 기록했습니다. 게다가 이 나라는 2030년까지 적어도 2GWp의 태양광 발전을 실시하고자 합니다.
- 인도도 분산형 태양광 발전의 개발이 현저한 아시아태평양 국가 중 하나입니다. 인도 태양광 발전의 누적 설비 용량은 약 62.8GW에 달하고, 2022년에는 약 13GW가 추가됩니다.
- 신·재생 가능 에너지부는 옥상 태양광 발전 시스템의 도입을 가속시키기 위해 Rooftop Solar Programme Phase-II를 실시했습니다. 이 계획은 주택 부문에 최대 4GW의 태양광 지붕 용량을 지원합니다. 또한 전년도보다 증가한 실적에 대해 인센티브를 주는 규정도 있습니다.
- 이상으로부터 예측기간 중에는 아시아태평양이 분산형 태양광발전시장을 독점할 것으로 예상됩니다.
분산형 태양광 발전 산업 개요
분산형 태양광 발전 시장은 세분화되어 있습니다. 시장의 주요 기업(순부동)에는 Suntech Power Holdings, First Solar Inc., Tesla Inc., Canadian Solar Inc., Sharp Energy Solutions Corporation 등이 있습니다.
기타 혜택
- 엑셀 형식 시장 예측(ME) 시트
- 3개월간의 애널리스트 서포트
목차
제1장 서론
- 조사 범위
- 시장의 정의
- 조사의 전제
제2장 주요 요약
제3장 조사 방법
제4장 시장 개요
- 소개
- 2028년까지 시장 규모와 수요 예측(단위: 10억 달러)
- 최근 동향과 개발
- 시장 역학
- 성장 촉진요인
- 억제요인
- 공급망 분석
- Porter's Five Forces 분석
- 공급기업의 협상력
- 소비자의 협상력
- 신규 참가업체의 위협
- 대체품의 위협
- 경쟁 기업간 경쟁 관계
제5장 시장 세분화
- 지역
- 북미
- 유럽
- 아시아태평양
- 남미
- 중동 및 아프리카
제6장 경쟁 구도
- M&A, 합작사업, 제휴, 협정
- 주요 기업의 전략
- 기업 프로파일
- Suntech Power Holdings Co. Ltd
- First Solar Inc.
- Activ solar Schweiz Gmbh
- Yingli Energy Developent Co., Ltd.
- Trina Solar Limited
- Sharp Solar Energy Solutions Group
- Canadian Solar Inc.
- Tesla Inc.
- JinkoSolar Holding Co. Ltd.
제7장 시장 기회와 앞으로의 동향
JHS 25.02.06The Distributed Solar Power Generation Market size is estimated at USD 160.16 billion in 2025, and is expected to reach USD 224.31 billion by 2030, at a CAGR of 6.97% during the forecast period (2025-2030).

The market was negatively impacted by COVID-19 in 2020. Presently the market has now reached pre-pandemic levels.
Key Highlights
- Over the medium term, rising environmental concerns and government policies for incentives and tax benefits for solar panel installation, high cost of grid expansion are also expected to drive the growth of the market studied.
- On the other hand in ability of distributed solarto serve as aprime power source may negatively impact the market's growth and is one of the major restraints for the market.
- Nevertheless, Technological advancements such as perovskite-based PV cells which offers high ease of manufacture, high efficiency, and excellent semiconductor behaviour, are expected to provide growth opportunities in the forecast period.
- The Asia-Pacific region dominates the market and is also likely to witness the highest CAGR during the forecast period. The growth is mainly driven by the majority of the demand coming from the countries such as the China and India, over rising environmental concerns.
Distributed Solar Power Generation Market Trends
Declining Price of Solar PV Systems and Installations Cost Expected to Drive the Market
- Since the last decade, the average cost of a solar PV panel has dropped by nearly 90% worldwide. Prices of other components have also fallen significantly since 2011, reducing the levelized cost of electricity (LCOE) for distributed and utility-scale solar PV generation.
- Due to a combination of techno-economic and geopolitical factors, it is estimated that the cost of solar PV panels prices will reduce slightly. Still, solar PV panel prices will continue to decline during the forecast period.
- According to the United States National Renewable Energy Laboratory (NREL), since 2010, there has been a 64%, 69%, and 82% reduction in the cost of residential, commercial-rooftop, and utility-scale PV systems in the United States, respectively. The decline in the prices of solar panels in Europe and the United States is primarily due to the drop in solar panel prices. This scenario will positively impact the market and drive the demand for solar panels in these regions.
- Due to the price decline, many residential and commercial consumers opted for rooftop solar PV systems to reduce energy costs and recovery time. Further, till 2020, the prices of solar PV modules declined by approximately 90%. However, this changed in 2021, when for the first time in the last decade, the prices went significantly up by 18%.
- According to National Renewable Energy Laboratory (NREL), the average selling price of the Mono C-Si solar PV module was 0.25 USD/watt in Q2 2022, lower than 0.26 USD/watt in Q1 2022. The declining module price has increased the demand for distributed solar power generation.
- The industrialization of these highly modular technologies has yielded impressive benefits from economies of scale and greater competition to improved manufacturing processes and competitive supply chains. The overall decline in solar PV system costs can also be attributed to the effective feed-in tariff programs in countries like Germany.
- The decline in the cost of solar PV and the declining cost of batteries have been significant drivers of the distributed solar energy market in recent years. This trend is expected to continue during the forecast period.
- Prices of lithium-ion batteries have declined by over 86%, from 1,000 USD/kWh in 2010 to 132 USD/kWh in 2021.
- Thus, the improved cost-effectiveness of batteries and solar PV modules will benefit the distributed solar energy market during the forecast period.
Asia Pacific Expected to Dominate the Market
- Asia-Pacific dominated the distributed solar power generation market in 2022 and is expected to continue its dominance in the coming years. The region holds vast potential for expanding distributed energy systems (DES), notably off-grid and residential solar. Inefficiencies in the power grid infrastructure, power supply shortages, and the scalability of decentralized technology pave the way for the deployment in the region, particularly in China and India.
- The electricity demand in China has been increasing due to economic growth and urbanization. Since 2015, the country's power demand has risen by 7% per year. The power demand rose by 3.6% in 2022, reaching 8,637 TWh.
- According to International Renewable Energy Agency, China had a total installed solar PV capacity of about 3924.4 GW in 2022, witnessing an increase of 28% compared to 2021. According to China's National Energy Administration (NEA), China's 20.37 GW new solar PV capacity to have been installed in January 2023 and February 2023, taking the country's total solar fleet to exceed 413 GW, out of which the majority came from distributed solar power generation projects, and the remaining share came from large-scale solar plants accounting for the remaining share.
- China has been focusing on increasing distributed solar power generation by encouraging residential and commercial end-users to install rooftop solar panels for quite some time.
- The solar power capacity in Singapore has risen over the past several years. According to the International Renewable Energy Agency, Singapore's total installed solar PV capacity reached 572 MW in 2022, recording a 15% growth compared to 2021. Furthermore, the country aims to generate at least 2 GWp of solar energy by 2030.
- India is another country in Asia-Pacific where distributed solar power generation has a noticeable development. India's cumulative installed solar power capacity reached about 62.8 GW in 2022, adding around 13 GW in 2022.
- The Ministry of New and Renewable Energy is implementing the Rooftop Solar Programme Phase-II for the country's accelerated deployment of solar rooftop systems. The scheme provides financial assistance of up to 4 GW of solar rooftop capacity to the residential sector. There is a provision to incentivize the companies for incremental achievement over the previous year.
- Therefore, owing to the above points, Asia-Pacific is expected to dominate the distributed solar power generation market during the forecast period.
Distributed Solar Power Generation Industry Overview
The distributed solar power generation market is fragmented. Some of the major players in the market (in no particular order) include Suntech Power Holdings Co. Ltd, First Solar Inc., Tesla Inc., and Canadian Solar Inc., Sharp Energy Solutions Corporation, among others.
Additional Benefits:
- The market estimate (ME) sheet in Excel format
- 3 months of analyst support
TABLE OF CONTENTS
1 INTRODUCTION
- 1.1 Scope of the Study
- 1.2 Market Definition
- 1.3 Study Assumptions
2 EXECUTIVE SUMMARY
3 RESEARCH METHODOLOGY
4 MARKET OVERVIEW
- 4.1 Introduction
- 4.2 Market Size and Demand Forecast in USD billion, till 2028
- 4.3 Recent Trends and Developments
- 4.4 Market Dynamics
- 4.4.1 Drivers
- 4.4.2 Restraints
- 4.5 Supply Chain Analysis
- 4.6 Porter's Five Forces Analysis
- 4.6.1 Bargaining Power of Suppliers
- 4.6.2 Bargaining Power of Consumers
- 4.6.3 Threat of New Entrants
- 4.6.4 Threat of Substitutes Products and Services
- 4.6.5 Intensity of Competitive Rivalry
5 MARKET SEGMENTATION
- 5.1 Geography
- 5.1.1 North America
- 5.1.2 Europe
- 5.1.3 Asia-Pacific
- 5.1.4 South America
- 5.1.5 Middle-East and Africa
6 COMPETITIVE LANDSCAPE
- 6.1 Mergers and Acquisitions, Joint Ventures, Collaborations, and Agreements
- 6.2 Strategies Adopted by Leading Players
- 6.3 Company Profiles
- 6.3.1 Suntech Power Holdings Co. Ltd
- 6.3.2 First Solar Inc.
- 6.3.3 Activ solar Schweiz Gmbh
- 6.3.4 Yingli Energy Developent Co., Ltd.
- 6.3.5 Trina Solar Limited
- 6.3.6 Sharp Solar Energy Solutions Group
- 6.3.7 Canadian Solar Inc.
- 6.3.8 Tesla Inc.
- 6.3.9 JinkoSolar Holding Co. Ltd.
