
|
시장보고서
상품코드
1639520
소포제 - 시장 점유율 분석, 산업 동향 및 통계, 성장 예측(2025-2030년)Defoamers - Market Share Analysis, Industry Trends & Statistics, Growth Forecasts (2025 - 2030) |
||||||
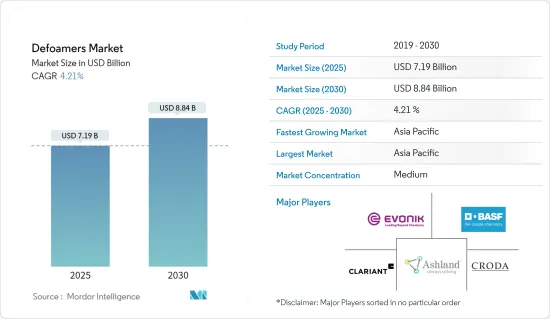
소포제 시장 규모는 2025년에 71억 9,000만 달러로 추정되며, 예측 기간(2025-2030년) 동안 4.21%의 CAGR로 2030년에는 88억 4,000만 달러에 달할 것으로 예상됩니다.
COVID-19 사태는 소포제 부문에 큰 타격을 입혔습니다. 전 세계 봉쇄와 각국 정부의 엄격한 규제로 인해 대부분의 생산 기지가 폐쇄되어 큰 타격을 입었습니다. 그럼에도 불구하고, 사업은 2021년부터 회복되고 있으며, 향후 몇 년 동안 크게 상승할 것으로 예상됩니다.
주요 하이라이트
- 단기적으로는 세계 화학 산업의 괄목할만한 성장이 조사 대상 시장의 성장을 촉진하는 주요 요인 중 하나입니다.
- 반면, 제품에 수반되는 부작용은 예측 기간 동안 소포제 시장의 성장을 저해할 것으로 예상됩니다.
- 친환경 소포제에 대한 수요 증가는 이 시장에 유리한 성장 기회를 가져다 줄 가능성이 높습니다.
- 아시아태평양은 중국과 인도의 수요가 대부분을 차지하며 세계 시장을 독점할 것으로 예상됩니다.
소포제 시장 동향
상하수도 처리 부문이 시장 성장을 주도
- 소포제는 산업 및 도시 폐수처리 기술에 적용되고 있습니다. 소포제의 사용은 생산능력, 생산량 증가, 운영 비용 절감을 통해 이러한 공정에 이익을 가져다 줍니다.
- 폐수처리 시스템의 거품은 생물학적 활동, 기계적 작용, 화학적 오염, 유입수의 계면활성제 또는 일부 고분자 처리로 인해 발생할 수 있습니다. 따라서 소포제는 폐수처리장에서 거품 형성으로 인한 건강 위험을 줄일 수 있습니다.
- 세계보건기구(WHO)에 따르면 중국에서는 전국적으로 도시 인구가 증가함에 따라 2030년까지 국민의 70%가 도시에 거주하게 될 것으로 예상하고 있습니다. 도시 인구가 증가함에 따라 폐수 및 슬러지 유입에 직면하게 됩니다. 현재 중국 슬러지의 80%가 부적절하게 버려지고 있으며, 도시 지역에서는 폐수처리시설(WWTP)을 개선하여 오염을 줄이기 위해 노력하고 있어 환경문제로서 점점 더 많은 논쟁을 불러일으키고 있습니다.
- 중화인민공화국(PRC) 국가개혁발전위원회(National Development of Reform and Commission)에 따르면, 2025년까지 중국의 슬러지 양은 9,000만 톤에 육박할 것으로 예상됩니다. 전문가들은 2021-2025년 사이에 슬러지 처리 시설의 신설 및 설치에 약 80억 달러가 투자될 것으로 예상하고 있습니다.
- 중국은 또한 향후 5년간 2,000만 입방미터/일 규모의 폐수처리 능력을 추가로 건설할 것이라고 발표했습니다.
- 멕시코의 수처리 산업은 건전한 성장률을 기록할 것으로 예상됩니다. 예를 들어, 국가 물 위원회(CONAGUA)가 작성한 최신 국가 인벤토리에 따르면, 멕시코에는 2786개의 플랜트가 있으며, 설치 용량은 196.7m3 s1, 처리 유량은 144.7m3 s1입니다. 현재 진행 중인 조사에 따르면, 멕시코 정부는 주로 도시 지역의 지자체 폐수처리장 개발에 중점을 두고 있어 시장이 확대될 가능성이 높다고 합니다.
- 스웨덴에서는 대부분의 가정이 지자체 하수처리시설에 연결되어 있음에도 불구하고 약 100만 명이 여전히 개인 하수처리시설을 이용하고 있습니다. 스웨덴은 효과적인 수자원 관리를 위한 폐수 정화 강화, 수자원 선별 폐수 시스템 등 다양한 부문에서 연구개발을 진행하고 있습니다.
- 예를 들어, Veidekke는 2022년 3월 스웨덴 스톡홀름 시크라에서 폐수처리 플랜트 건설 및 설치 계약을 체결했습니다. 이 계약은 Stockholm Vatten och Avfall이 발주했습니다. 이번 계약은 실행계약이며, 프로젝트는 공동도급으로 진행됩니다. 초기 계약 금액은 약 1억 5,300만 달러입니다. 이 프로젝트는 2027년에 완료될 예정입니다. 이에 따라 소포제 시장은 상하수도 처리 부문의 수요 증가가 예상됩니다.
- 위의 요인은 예측 기간 동안 소포제 시장에 큰 영향을 미칠 것으로 예상됩니다.
아시아태평양이 시장을 장악
- 중국 및 인도와 같은 국가의 높은 수요로 인해 아시아태평양이 주요 시장 점유율을 차지하고 있습니다.
- 중국은 자동차 용도의 페인트 및 코팅 산업의 수요 증가로 인해 아시아태평양에서 가장 큰 소포제 소비국 중 하나가 되었습니다. 중국은 최대 자동차 생산국이자 SUV 시장 성장에서 가장 큰 시장 점유율을 차지하고 있습니다. 예를 들어, 국제자동차생산자기구(OICA)에 따르면 2023년 중국의 자동차 생산량은 3,016만 966대로 2022년에 비해 12% 증가할 것으로 예상하고 있습니다. 따라서 자동차 생산량 증가는 페인트 및 코팅 부문에서 소포제 시장에 대한 수요를 증가시킬 것으로 예상됩니다.
- 또한, 이 나라는 이 지역에서 가장 큰 건설 시장이기도 합니다. 건설 부문의 성장은 페인트 및 코팅제에 대한 수요 증가로 이어질 것으로 예상되며, 이는 중국 내 소포제의 성장을 촉진할 가능성이 높습니다. 중국 국가통계국에 따르면 2023년 중국의 건설 생산액은 약 31조 5,900억 위안(4조 4,300억 달러)으로 정점을 찍을 것으로 예상하고 있습니다.
- 중국은 석유 및 가스 소비량은 세계 2위이지만 생산량은 세계 6위에 불과합니다. 석유 소비 대국인 중국의 석유 소비량은 성장률의 변동은 있지만 해마다 증가하고 있습니다. 그러나 석유 공급은 여전히 수요를 충족시킬 수 없어 중국은 주로 수입에 의존하고 있습니다. 예를 들어, Trading Economics에 따르면 중국의 원유 수입(금액)은 2024년 1월 2만 5,600달러에서 2024년 2월에는 2만 5,700달러로 증가할 것으로 예상됩니다.
- 또한, 인도의 주택 부문은 증가 추세에 있으며, 정부의 지원과 이니셔티브는 수요를 더욱 증가시키고 있으며, 2024-25년 주택도시부(MoHUA)는 8,257억 6,000만 인도 루피(Rs.)를 지원받았습니다. 이 중 36.5%는 프라단 만트리 아와스 요자나(도시 지역) 또는 PMAY(U)에 따라 빈곤층에 대한 주택 공급에 할당되어 있습니다.
- 위와 같은 이유로 아시아태평양이 예측 기간 동안 가장 높은 성장률을 보일 것으로 예상됩니다.
소포제 산업 개요
소포제 시장은 적당히 통합되어 있습니다. 이 시장의 주요 기업으로는 BASF SE, Croda International Plc, Ashland, Evonik Industries AG, CLARIANT 등이 있습니다.
기타 혜택
- 엑셀 형식의 시장 예측(ME) 시트
- 3개월간 애널리스트 지원
목차
제1장 소개
- 조사 가정
- 조사 범위
제2장 조사 방법
제3장 주요 요약
제4장 시장 역학
- 성장 촉진요인
- 화학 산업 확대와 적응성
- 페인트 생산 증가
- 기타 촉진요인
- 성장 억제요인
- 제품에 따른 부작용
- 원료 부족과 출하 지연
- 기타 성장 억제요인
- 산업 밸류체인 분석
- Porter's Five Forces 분석
- 공급 기업의 교섭력
- 구매자의 교섭력
- 신규 참여업체의 위협
- 대체품의 위협
- 경쟁 정도
제5장 시장 세분화(금액 기준 시장 규모)
- 유형
- 유성 소포제
- 에멀전계 소포제
- 실리콘계 소포제
- 분말 소포제
- 폴리머계 소포제
- 기타
- 최종 이용 산업
- 페인트 및 코팅
- 석유 및 가스
- 펄프·제지
- 식품 및 음료
- 상하수도 치료
- 기타
- 지역
- 아시아태평양
- 인도
- 일본
- 한국
- 말레이시아
- 태국
- 인도네시아
- 베트남
- 기타 아시아태평양
- 북미
- 미국
- 캐나다
- 멕시코
- 유럽
- 독일
- 영국
- 이탈리아
- 프랑스
- 이탈리아
- 스페인
- 북유럽 국가
- 터키
- 러시아
- 기타 유럽
- 남미
- 브라질
- 아르헨티나
- 콜롬비아
- 기타 남미
- 중동 및 아프리카
- 사우디아라비아
- 카타르
- 아랍에미리트
- 나이지리아
- 이집트
- 남아프리카공화국
- 기타 중동 및 아프리카
- 아시아태평양
제6장 경쟁 구도
- M&A, 합작투자, 제휴, 협정
- 시장 점유율(%)**/순위 분석
- 주요 기업의 전략
- 기업 개요
- Accepta Water Treatment
- Air Products Inc.
- Aqua-Clear, Inc.
- Ashland
- BASF SE
- BRB International
- Buckman
- CLARIANT
- Croda International Plc
- Dow
- Eastman Chemical Company
- ELEMENTIS PLC
- Elkem ASA
- Evonik Industries AG
- Kemira
- SAN NOPCO LIMITED
- Solvay
- Wacker Chemie AG
제7장 시장 기회와 향후 동향
제8장 친환경 소포제에 대한 수요 상승
제9장 다양한 최종 이용 산업의 폴리머 수요 확대
ksm 25.02.10The Defoamers Market size is estimated at USD 7.19 billion in 2025, and is expected to reach USD 8.84 billion by 2030, at a CAGR of 4.21% during the forecast period (2025-2030).

The COVID-19 epidemic harmed the defoamers sector. Global lockdowns and severe rules enforced by governments resulted in a catastrophic setback as most production hubs were shut down. Nonetheless, the business is recovering from 2021 and is expected to rise significantly in the coming years.
Key Highlights
- Over the short term, significant growth in the chemical industry worldwide is one of the key factors driving the studied market growth.
- On the flip side, side effects associated with the products are expected to hinder the defoamers' market growth during the forecast period.
- Nevertheless, the rising demand for eco-friendly defoamers will likely create lucrative growth opportunities for the studied market.
- Asia-Pacific region is expected to dominate the market across the world, with the majority of demand coming from China and India.
Defoamers Market Trends
Water and Wastewater Treatment Segment to Drive the Market Growth
- The defoamers find their applications in industrial and municipal wastewater treatment technologies. The applications of defoamers benefit these processes through increased production capacity, output volume, and reduced operational cost.
- The foam in wastewater treatment systems can result from biological activity, mechanical action, chemical contamination, surfactants in the influent, or some polymer treatments. Thus defoamers reduce the health hazard of foam formation in wastewater treatment plants.
- According to WHO, 70% of the nation's population in China is expected to reside in cities by 2030 due to the increase in the urban population throughout the country. As the urban population increases, they also face an influx of wastewater and sludge. Currently, 80% of sludge in China is improperly dumped, an increasingly controversial environmental issue with urban centers scrambling to decrease pollution by improving their wastewater treatment plants (WWTPs).
- According to the People's Republic of China (PRC's) National Development of Reform and Commission, the country's sludge volume could reach nearly 90 million tons by 2025. Experts estimate that between 2021 and 2025, the country will likely invest about USD 8 billion to construct and install new sludge processing facilities.
- China also announced that it will be constructing 20 million cubic meters/day of additional wastewater treatment capacity over the next five years.
- The water treatment industry in Mexico is expected to register a healthy growth rate. For instance, according to the latest National Inventory made by the National Water Commission (CONAGUA), there are 2786 plants in Mexico with an installed capacity of 196.7 m3 s1 and a treated flow of 144.7 m3 s1. Ongoing research in the country indicates the government to majorly focus on developing municipal wastewater treatment plants, mostly in the urban areas, which will likely augment the market.
- About 1 million people in Sweden still include private sewage treatment plants despite most homes connected to municipal sewage treatment facilities. Sweden conducts research and development in various areas, including enhanced wastewater purification and source-sorting wastewater systems for effective water resource management.
- For instance, Veidekke secured a contract to construct and install a wastewater treatment plant in Sickla, Stockholm, Sweden, in March 2022. The contract was awarded by Stockholm Vatten och Avfall. It is an execution contract under which the project will be carried out as a collaborative contract. The initial contract value is around USD 153 million. This project is anticipated to be completed in 2027. Therefore, this is expected to create an upside demand for the defoamers market from the water and wastewater treatment segment.
- The factors above are expected to significantly impact the defoamers market during the forecast period.
Asia-Pacific to Dominate the Market
- Asia-Pacific accounted for the major market share, owing to the high demand from countries like China and India.
- Due to increased demand for the paints and coatings industry in automobile applications, China is one of the largest consumers of defoamers in the Asia-Pacific region. The country is the largest producer of automobiles and contains the largest market share in the growth of the SUV market. For instance, according to Organisation Internationale des Constructeurs d'Automobiles (OICA), in 2023, automobile production in China amounted to 30,160,966 units, which showed an increase of 12% compared to 2022. Therefore, increasing the production of automobiles is expected to create an upside demand for the defoamers market from the paints and coatings segment.
- Moreover, the country is the largest construction market in the region. The growth in the construction sector is expected to lead to an increase in the demand for paints and coatings and, in turn, is likely to push the growth for defoamers in the country. According to the National Bureau of Statistics of China, in 2023, the construction output value in China peaked at around CNY 31.59 trillion (USD 4.43 trillion).
- China is the world's second-largest consumer of oil and gas but only the sixth-largest producer of the same. As a big oil consumer, China's oil consumption is increasing yearly with fluctuating growth rates. However, the oil supply still cannot meet the demand, and China mainly relies on imports. For instance, according to Trading Economics, imports of Crude Petroleum (value) in China increased to USD 25.7 thousand in February 2024 from USD 25.6 thousand in January 2024.
- Furthermore, the residential sector in India is on an increasing trend, with government support and initiatives further boosting the demand. For the year 2024-25, Ministry of Housing and Urban Affairs (MoHUA) has received INR 825.76. billion. Of this amount, 36.5 percent is allocated for the provision of houses to the needy population under Pradhan Mantri Awas Yojana (Urban) or PMAY (U).
- Owing to the reasons above, Asia-Pacific will likely witness the highest growth rate during the forecast period.
Defoamers Industry Overview
The Defoamers Market is moderately consolidated in nature. The major players in this market (not in any particular order) include BASF SE, Croda International Plc, Ashland, Evonik Industries AG, and CLARIANT, among others.
Additional Benefits:
- The market estimate (ME) sheet in Excel format
- 3 months of analyst support
TABLE OF CONTENTS
1 INTRODUCTION
- 1.1 Study Assumptions
- 1.2 Scope of the Study
2 RESEARCH METHODOLOGY
3 EXECUTIVE SUMMARY
4 MARKET DYNAMICS
- 4.1 Drivers
- 4.1.1 Expansion and adaptability in the chemical industry
- 4.1.2 Increasing Paints and Coatings Production
- 4.1.3 Other Drivers
- 4.2 Restraints
- 4.2.1 Side Effects Associated with the Products
- 4.2.2 Raw Material Shortage and Shipping Delays
- 4.2.3 Other Restraints
- 4.3 Industry Value-chain Analysis
- 4.4 Porter's Five Forces Analysis
- 4.4.1 Bargaining Power of Suppliers
- 4.4.2 Bargaining Power of Buyers
- 4.4.3 Threat of New Entrants
- 4.4.4 Threat of Substitute Products and Services
- 4.4.5 Degree of Competition
5 MARKET SEGMENTATION (Market Size in Value)
- 5.1 Type
- 5.1.1 Oil-based Defoamer
- 5.1.2 Emulsion Defoamer
- 5.1.3 Silicone-based Defoamer
- 5.1.4 Powder Defoamer
- 5.1.5 Polymer-based Defoamers
- 5.1.6 Other Types
- 5.2 End-user Industry
- 5.2.1 Paints and Coatings
- 5.2.2 Oil and Gas
- 5.2.3 Pulp and Paper
- 5.2.4 Food and Beverages
- 5.2.5 Water and Wastewater Treatment
- 5.2.6 Other End-user Industries
- 5.3 Geography
- 5.3.1 Asia-Pacific
- 5.3.1.1 India
- 5.3.1.2 Japan
- 5.3.1.3 South Korea
- 5.3.1.4 Malaysia
- 5.3.1.5 Thailand
- 5.3.1.6 Indonesia
- 5.3.1.7 Vietnam
- 5.3.1.8 Rest of Asia-Pacific
- 5.3.2 North America
- 5.3.2.1 United States
- 5.3.2.2 Canada
- 5.3.2.3 Mexico
- 5.3.3 Europe
- 5.3.3.1 Germany
- 5.3.3.2 United Kingdom
- 5.3.3.3 Italy
- 5.3.3.4 France
- 5.3.3.5 Italy
- 5.3.3.6 Spain
- 5.3.3.7 Nordic Countries
- 5.3.3.8 Turkey
- 5.3.3.9 Russia
- 5.3.3.10 Rest of Europe
- 5.3.4 South America
- 5.3.4.1 Brazil
- 5.3.4.2 Argentina
- 5.3.4.3 Colombia
- 5.3.4.4 Rest of South America
- 5.3.5 Middle-East and Africa
- 5.3.5.1 Saudi Arabia
- 5.3.5.2 Qatar
- 5.3.5.3 United Arab Emirates
- 5.3.5.4 Nigeria
- 5.3.5.5 Egypt
- 5.3.5.6 South Africa
- 5.3.5.7 Rest of Middle-East and Africa
- 5.3.1 Asia-Pacific
6 COMPETITIVE LANDSCAPE
- 6.1 Mergers and Acquisitions, Joint Ventures, Collaborations, and Agreements
- 6.2 Market Share (%)**/Ranking Analysis
- 6.3 Strategies Adopted by Leading Players
- 6.4 Company Profiles
- 6.4.1 Accepta Water Treatment
- 6.4.2 Air Products Inc.
- 6.4.3 Aqua-Clear, Inc.
- 6.4.4 Ashland
- 6.4.5 BASF SE
- 6.4.6 BRB International
- 6.4.7 Buckman
- 6.4.8 CLARIANT
- 6.4.9 Croda International Plc
- 6.4.10 Dow
- 6.4.11 Eastman Chemical Company
- 6.4.12 ELEMENTIS PLC
- 6.4.13 Elkem ASA
- 6.4.14 Evonik Industries AG
- 6.4.15 Kemira
- 6.4.16 SAN NOPCO LIMITED
- 6.4.17 Solvay
- 6.4.18 Wacker Chemie AG
