|
시장보고서
상품코드
1851391
미국의 태양에너지 시장 : 점유율 분석, 산업 동향, 통계, 성장 예측(2025-2030년)United States Solar Energy - Market Share Analysis, Industry Trends & Statistics, Growth Forecasts (2025 - 2030) |
||||||
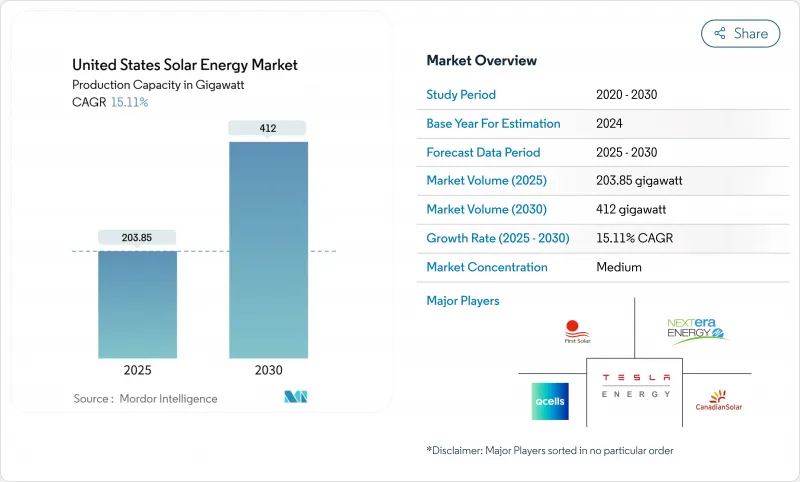
미국 태양에너지 설치 기반 시장 규모는 2025년 203.85기가와트, 2030년에는 412기가와트까지 예측 기간(2025-2030년)의 CAGR은 15.11%를 보일 것으로 예측됩니다.
이 규모에서 2025년 미국의 태양에너지 시장 규모는 태양광 발전이 2024년에 기록된 총 발전량 증가의 53%를 차지했고, 신규 전력 용량공급원으로서 국내에서 가장 급성장하고 있습니다. 성장에는 인플레이션 억제법(IRA)에 근거한 10년간의 안정적인 세제 우대 조치, 모듈 수요의 70%를 공급할 수 있게 된 국내 제조거점의 확대, 저탄소 전력 구매 계약을 요구하는 기업 수요의 3가지 기둥이 있습니다. 고조도 지역에서는 평준화 비용이 40달러/MWh를 밑돌았기 때문에 개발업체는 계속 전력회사 규모의 프로젝트를 선호하고 있지만, 많은 주에서 투자 회수 기간을 7년 미만으로 단축하는 제로 다운 파이낸스를 금융기관이 전개했기 때문에 분산형 발전이 가속되고 있습니다. 상호접속의 대기행렬과 송전의 혼잡이 여전히 큰 장애가 되고 있지만, 계획적인 송전망 투자와 하이브리드 태양광 및 저장 플랜트의 채택으로 2026년 이후, 억제 압력이 완화될 것으로 예측됩니다.
미국 태양에너지 시장 동향과 통찰
인플레이션 억제법의 우대세제가 전력회사 규모의 PPA를 가속
IRA는 30%의 투자 세액 공제를 10년간 연장하여 개발자에게 제2 수익화 경로를 제공하는 생산 세액 공제를 도입했습니다. 국내 컨텐츠나 에너지·커뮤니티에 대한 보너스 공제와 조합함으로써 태양광이 풍부한 지역의 프로젝트는 50달러/MWh 이하의 장기 PPA를 체결할 수 있어 마이크로소프트의 브룩필드와의 10.5GW 계약(기업에 의한 클린 전력 계약으로서 지금까지 최대)과 같은 거래가 촉진됩니다. 2025년에 시작된 도제 제도의 규정은 숙련 노동자의 파이프라인을 구축하여 몇 기가와트의 파이프라인의 위험을 줄이는 데 도움이 되었습니다.
그리드 엣지 저장장치 연계를 통한 프로젝트 금융 가능성(은행 취급 가능성) 향상
태양광 발전 및 축전지 하이브리드 발전소는 2024년 말까지 49GW의 태양광 발전과 360만kW의 축전지 가동에 이릅니다. 축전지는 일중 잉여 출력을 저녁 피크로 이동시킴으로써 유효 용량 계수를 40% 이상까지 끌어올리는데, 이는 CAISO와 ERCOT 시장에서 중요한 이점입니다. 인터커넥트 큐에는 이미 599GW의 하이브리드 커패시턴스가 나열되어 있지만, 이는 혼잡한 노드에서 단일 태양광 발전이 상업적으로 최적이 아니라는 금융 기관의 견해가 강해지고 있음을 보여줍니다.
상호 연결 대기열의 병목 현상이 리드 타임을 늘립니다.
2024년 전국 연결 대기열은 2.6TW로 부풀어 오르고 평균 조사 기간은 36개월을 넘어섰습니다. CAISO는 업그레이드를 기다리는 태양광 발전을 200GW 이상 리스트업하고 있으며, ERCOT도 같은 정체에 휩쓸리고 있습니다. DOE의 i2X 개혁은 클러스터 연구를 간소화할 것이지만, 대부분의 지역 송전기관은 이를 수행하기 위해 적어도 2년이 필요합니다.
부문 분석
2024년 미국의 태양에너지 시장에서는 모듈 가격의 저렴함과 공급망의 성숙에 따라 태양광 발전이 92%의 점유율을 차지해 압도적인 힘을 보였습니다. 이 포지션에 의해 이 부문은 TOPCon이나 헤테로 접합 설계에 근거한 새로운 국내 셀 라인을 확대하는 명확한 길을 얻었습니다. 그러나 집광형 태양열발전(CSP)에는 PV에는 없는 축열과 공정열의 특성이 있으며, 열원을 탈탄소화하는 산업 사용자 증가에 따라 CSP의 2030년까지의 CAGR 예측은 17%를 나타낼 전망입니다. 네바다의 Crescent Dunes revival과 5 센트/kWh를 목표로 하는 Gen3 CSP 프로토타입은 직일사양이 7kWh/m2/일을 넘는 곳에서도 틈새 도입이 가능함을 보여줍니다.
7GW를 넘는 TOPCon과 HJT의 용량 확장 계획으로 국내 모듈 효율은 2024년 평균의 21%에서 세계 프론티어인 25%로 상승할 것입니다. 그럼에도 불구하고 생산자가 출시 위험을 관리하기 때문에 단기적으로 PERC에 이점이 있습니다. CSP는 아마 남서부에 집중할 것 같지만, 500℃의 증기를 필요로 하는 정유소나 시멘트 공장에 발판이 생길지도 모릅니다. 두 기술이 성장함에 따라 CSP에 할당된 미국 태양에너지 시장 규모는 2030년까지 총 발전 용량의 약 5%에 달할 수 있어 발전 프로파일의 다양화를 통해 계통 회복력을 향상시킵니다. 비용 패리티의 목표는 IRA의 지속적인 지원과 고온 용융 소금 타워의 합리화 된 허가에 의존합니다.
본 시장 세분화에서는 태양광 발전의 유형(태양광 발전, 집광형 태양광 발전), 가대의 유형(지상 설치형, 옥상 설치형, 부체 설치형), 최종 용도(유틸리티 스케일, 상업용·산업용, 주택용)별로 시장 규모 및 예측을 제공합니다. 시장 규모와 예측은 설치 용량(GW)으로 제공됩니다.
기타 혜택 :
- 엑셀 형식 시장 예측(ME) 시트
- 3개월간의 애널리스트 서포트
목차
제1장 서론
- 조사의 전제조건과 시장의 정의
- 조사 범위
제2장 조사 방법
제3장 주요 요약
제4장 시장 상황
- 시장 개요
- 시장 성장 촉진요인
- 인플레이션 삭감법(IRA) 세제 우대 조치가 사업 규모 PPA 가속
- 프로젝트의 융통성을 높이는 그리드-에지 스토리지 페어링
- 기업의 넷 제로 의무화가 C&I의 전력 구입 계약 체결
- 인구가 많은 주에서의 액세스를 확대하는 커뮤니티-솔라 프로그램
- 국내 제조 크레딧 삭감 모듈 수입 위험
- 미국 중서부에서 토지 이용 경제성을 개선하는 농업 태양광
- 시장 성장 억제요인
- 36개월 이상 리드 타임을 늘리는 상호 연결 대기열 병목 현상
- 모듈 가격 변동을 일으키는 201/301조 무역조치
- 남서부의 유틸리티 프로젝트를 억제하는 송전 정체 증가
- 숙련 노동자 부족으로 EPC 비용이 전년 대비 18% 이상 상승
- 공급망 분석
- 규제 및 정책 전망(연방+주)
- 기술적 전망(TOPCon, HJT, 페로브스카이트, 바이페이셜)
- Porter's Five Forces
- 신규 참가업체의 위협
- 공급자의 협상력
- 구매자의 협상력
- 대체품의 위협(대체품의 위협(풍력, RNG, 장기 저장))
- 경쟁 기업간 경쟁 관계
- PESTEL 분석
제5장 시장 규모와 성장 예측
- 유형별
- 태양광 발전(PV)
- 집광형 태양광 발전(CSP)
- 가대 유형별
- 지상 설치형
- 옥상
- 부체식 태양
- 최종 용도별
- 유틸리티 스케일
- 상업 및 산업
- 주거
제6장 경쟁 구도
- 시장 집중도
- 전략적 움직임(M&A, 파트너십, PPA)
- 시장 점유율 분석(주요 기업의 시장 순위/점유율)
- 기업 프로파일
- First Solar Inc.
- NextEra Energy Inc.
- SunPower Corporation
- Hanwha Q CELLS USA Corp.
- Canadian Solar Inc.
- JinkoSolar Holding Co. Ltd.
- Tesla Energy
- Sunrun Inc.
- 8minute Solar Energy
- SOLV Energy LLC
- Mortenson Construction
- Rosendin Electric Inc.
- Renewable Energy Systems Americas
- Brookfield Renewable US
- EDF Renewables North America
- Enphase Energy Inc.
- Trina Solar Ltd.
- LONGi Solar
- REC Group(REC Solar Norway AS)
- Array Technologies Inc.
- Nextracker Inc.
제7장 시장 기회와 장래의 전망
SHW 25.11.21The United States Solar Energy Market size in terms of installed base is expected to grow from 203.85 gigawatt in 2025 to 412 gigawatt by 2030, at a CAGR of 15.11% during the forecast period (2025-2030).

At this scale, the United States solar energy market size for 2025 positions solar as the country's fastest-growing source of new electric capacity, with photovoltaic (PV) installations representing 53% of all generation additions logged during 2024 .Growth rests on three pillars: stable 10-year tax incentives under the Inflation Reduction Act (IRA), a swelling domestic manufacturing base that can now supply 70% of module demand, and corporate demand for low-carbon power purchase agreements. Developers continue to favor utility-scale projects because levelized costs have fallen below USD 40/MWh in high-irradiance regions, yet distributed generation is accelerating as lenders roll out zero-down financing that cuts payback periods to fewer than seven years in many states. Interconnection queues and transmission congestion remain the chief speed bumps, but planned grid investments and the adoption of hybrid solar-plus-storage plants are expected to ease curtailment pressures from 2026 forward.
United States Solar Energy Market Trends and Insights
Inflation Reduction Act tax incentives accelerating utility-scale PPAs
The IRA extended the 30% investment tax credit for a decade and introduced production tax credits that offer developers a second monetization route. Paired with bonus credits for domestic content and energy communities, projects in sun-rich regions can sign long-term PPAs below USD 50/MWh, fostering deals such as Microsoft's 10.5 GW agreement with Brookfield-the largest corporate clean-power contract to date. Apprenticeship stipulations that start in 2025 are also building a skilled labor pipeline, which helps de-risk multi-gigawatt pipelines.
Grid-edge storage pairing enhancing project bankability
Hybrid solar-plus-storage plants reached 49 GW of PV and 3.6 GW of batteries in operation by end-2024. Storage raises effective capacity factors to over 40% by shifting excess midday output into evening peaks, a key advantage in CAISO and ERCOT markets. Interconnection queues already list 599 GW of proposed hybrid capacity, signifying that financiers increasingly view standalone solar as commercially sub-optimal in congested nodes.
Interconnection queue bottlenecks lengthening lead times
The national queue swelled to 2.6 TW in 2024, with average study times surpassing 36 months. CAISO lists more than 200 GW of solar awaiting upgrades, while ERCOT experiences similar logjams. DOE's i2X reforms will streamline cluster studies, yet most regional transmission organizations need at least two years to implement them.
Other drivers and restraints analyzed in the detailed report include:
- Corporate net-zero mandates spurring commercial & industrial PPAs
- Community-solar programs expanding access
- Section 201/301 trade actions causing price volatility
For complete list of drivers and restraints, kindly check the Table Of Contents.
Segment Analysis
Solar PV dominated the United States solar energy market in 2024, holding 92% share thanks to low module costs and mature supply chains. This position gave the segment a clear runway to scale new domestic cell lines based on TOPCon and heterojunction designs. However, concentrated solar power (CSP) offers thermal storage and process-heat attributes that PV lacks, leading to a forecast 17% CAGR for CSP through 2030 as more industrial users decarbonize heat streams. Nevada's Crescent Dunes revival and Gen3 CSP prototypes targeting 5 cents/kWh illustrate how niche adoption can still be material where direct-normal irradiance exceeds 7 kWh/m2/day.
Planned TOPCon and HJT capacity expansions exceeding 7 GW should raise domestic module efficiency from a 2024 average of 21% toward the global frontier of 25%. Even so, the short-term edge remains with PERC as producers manage ramp-up risk. CSP will likely stay concentrated in the Southwest but could gain footholds at refineries or cement plants that need 500 °C steam. As both technologies grow, the United States solar energy market size allocated to CSP may reach about 5% of total capacity by 2030, improving grid resilience through diversified generation profiles. Cost-parity targets rely on continued IRA support and streamlined permitting for high-temperature molten salt towers.
The United States Solar Energy Market Report is Segmented by Type (Solar Photovoltaic and Concentrated Solar Power), Mounting Type (Ground-Mounted, Rooftop, and Floating Solar), and End-Use (Utility-Scale, Commercial and Industrial, and Residential). The Market Sizes and Forecasts are Provided in Terms of Installed Capacity (GW).
List of Companies Covered in this Report:
- First Solar Inc.
- NextEra Energy Inc.
- SunPower Corporation
- Hanwha Q CELLS USA Corp.
- Canadian Solar Inc.
- JinkoSolar Holding Co. Ltd.
- Tesla Energy
- Sunrun Inc.
- 8minute Solar Energy
- SOLV Energy LLC
- Mortenson Construction
- Rosendin Electric Inc.
- Renewable Energy Systems Americas
- Brookfield Renewable US
- EDF Renewables North America
- Enphase Energy Inc.
- Trina Solar Ltd.
- LONGi Solar
- REC Group (REC Solar Norway AS)
- Array Technologies Inc.
- Nextracker Inc.
Additional Benefits:
- The market estimate (ME) sheet in Excel format
- 3 months of analyst support
TABLE OF CONTENTS
1 Introduction
- 1.1 Study Assumptions & Market Definition
- 1.2 Scope of the Study
2 Research Methodology
3 Executive Summary
4 Market Landscape
- 4.1 Market Overview
- 4.2 Market Drivers
- 4.2.1 Inflation Reduction Act (IRA) Tax Incentives Accelerating Utility-Scale PPAs
- 4.2.2 Grid?Edge Storage Pairing Enhancing Project Bankability
- 4.2.3 Corporate Net-Zero Mandates Spurring C&I Power-Purchase Agreements
- 4.2.4 Community-Solar Programs Expanding Access in High-Population States
- 4.2.5 Domestic Manufacturing Credits Cutting Module Import Risk
- 4.2.6 Agrivoltaics Improving Land-Use Economics in the Midwest
- 4.3 Market Restraints
- 4.3.1 Interconnection Queue Bottlenecks Increasing Lead-Times Beyond 36 Months
- 4.3.2 Section 201/301 Trade Actions Causing Module-Price Volatility
- 4.3.3 Rising Transmission Congestion Curtailing Southwest Utility Projects
- 4.3.4 Skilled-Labor Shortage Inflating EPC Costs by greater than 18 % YoY
- 4.4 Supply Chain Analysis
- 4.5 Regulatory & Policy Outlook (Federal + State)
- 4.6 Technological Outlook (TOPCon, HJT, Perovskites, Bifacial)
- 4.7 Porter's Five Forces
- 4.7.1 Threat of New Entrants
- 4.7.2 Bargaining Power of Suppliers
- 4.7.3 Bargaining Power of Buyers
- 4.7.4 Threat of Substitutes (Wind, RNG, Long-Duration Storage)
- 4.7.5 Competitive Rivalry
- 4.8 PESTLE Analysis
5 Market Size & Growth Forecasts
- 5.1 By Type
- 5.1.1 Solar Photovoltaic (PV)
- 5.1.2 Concentrated Solar Power (CSP)
- 5.2 By Mounting Type
- 5.2.1 Ground-Mounted
- 5.2.2 Rooftop
- 5.2.3 Floating Solar
- 5.3 By End-Use
- 5.3.1 Utility-Scale
- 5.3.2 Commercial and Industrial
- 5.3.3 Residential
6 Competitive Landscape
- 6.1 Market Concentration
- 6.2 Strategic Moves (M&A, Partnerships, PPAs)
- 6.3 Market Share Analysis (Market Rank/Share for key companies)
- 6.4 Company Profiles (includes Global level Overview, Market level overview, Core Segments, Financials as available, Strategic Information, Products & Services, and Recent Developments)
- 6.4.1 First Solar Inc.
- 6.4.2 NextEra Energy Inc.
- 6.4.3 SunPower Corporation
- 6.4.4 Hanwha Q CELLS USA Corp.
- 6.4.5 Canadian Solar Inc.
- 6.4.6 JinkoSolar Holding Co. Ltd.
- 6.4.7 Tesla Energy
- 6.4.8 Sunrun Inc.
- 6.4.9 8minute Solar Energy
- 6.4.10 SOLV Energy LLC
- 6.4.11 Mortenson Construction
- 6.4.12 Rosendin Electric Inc.
- 6.4.13 Renewable Energy Systems Americas
- 6.4.14 Brookfield Renewable US
- 6.4.15 EDF Renewables North America
- 6.4.16 Enphase Energy Inc.
- 6.4.17 Trina Solar Ltd.
- 6.4.18 LONGi Solar
- 6.4.19 REC Group (REC Solar Norway AS)
- 6.4.20 Array Technologies Inc.
- 6.4.21 Nextracker Inc.
7 Market Opportunities & Future Outlook
- 7.1 White-Space & Unmet-Need Assessment