|
시장보고서
상품코드
1850016
프로피온산 : 시장 점유율 분석, 산업 동향, 통계, 성장 예측(2025-2030년)Propionic Acid - Market Share Analysis, Industry Trends & Statistics, Growth Forecasts (2025 - 2030) |
||||||
프로피온산 시장은 2025년에 16억 9,000만 달러로 평가되었으며, 2030년에 22억 3,000만 달러에 이를 것으로 예측되며, CAGR은 5.72%를 나타낼 전망입니다.

이 화합물의 채택 증가세는 식품 보존, 동물 영양, 특수 화학 분야에서 폭넓은 활용성에 기인하며, 미국 FDA의 GRAS(일반적으로 안전하다고 인정되는 물질) 지위와 같은 규제 지원이 글로벌 사용을 뒷받침합니다. 유럽은 확고한 식품 안전 규정과 성숙한 곡물 보존 체인으로 수요를 견인하는 반면, 아시아태평양 지역은 축산 집약화와 포장 식품 소비 증가에 힘입어 가장 빠른 성장세를 보입니다. 사료 효율성 요구, 항생제 제로 가축 사육 정책, 바이오 기반 생산 공정 전환이 투자 흐름을 주도하고 있으나, 석유화학 공정 역시 규모의 경제 우위를 유지하고 있습니다. 중국, 인도, 동남아시아의 전략적 생산 능력 증설은 최근 무역 마찰로 인한 공급 안정성 우려가 고조되면서 부분적으로 촉진된 지역 자급자족으로의 전환을 시사합니다.
세계의 프로피온산 시장 동향 및 인사이트
곡물 및 사일리지 방부제 수요 증가
기후 변동성으로 인해 저장된 곡물과 사일리지의 수분 관련 부패 위험이 커지면서 곰팡이 방제를 위한 프로피온산 사용이 확대되고 있습니다. 0.6%의 낮은 농도만으로도 아스페르길루스(Aspergillus)와 페니실리움(Penicillium)의 성장을 억제하여 장기간 저장 중 사료 품질을 보호합니다. 완충 제형은 부식 우려를 완화하여, 기존에 산 사용을 주저하던 중규모 농장의 도입을 촉진합니다. 현장 데이터에 따르면 처리된 곡물은 건조물질 손실을 15%까지 줄여 곡물 취급업체의 실질적인 마진 보호로 이어집니다. 국경 간 무역으로 물류망이 길어짐에 따라 저장 안정성이 핵심 요소가 되면서, 프로피온산 시장은 글로벌 식량 안보 전략의 핵심 촉진제로 자리매김하고 있습니다.
항생제 미사용 고기 체인에서 사료용 산 사용 확대
규제 당국이 항생제 성장 촉진제 사용을 단계적으로 폐지함에 따라 생산자들은 사료 전환율 개선 효과를 유지하는 유기산으로 전환하고 있습니다. 육계 사료에 0.2-0.4%의 프로피온산을 첨가하면 위장관 pH를 낮추고 살모넬라 및 대장균 수를 억제하여 항생제 성능과 맞먹는 결과를 보여줍니다. 유럽의 항생제 일상적 사용 금지 조치는 이미 산화제 수요를 촉진했으며, 북미의 항생제 무첨가 육류에 대한 소매 프리미엄은 채택을 더욱 강화하고 있습니다. 이에 사료 공장들은 재구성된 프리믹스에 프로피온산을 통합하여 증분 물량을 창출하고 있으며, 이는 프로피온산 시장의 장기적 회복탄력성을 뒷받침합니다.
불안정한 석유계 원료 가격(프로필렌)
원유 시장의 급격한 변동은 프로필렌 계약에 파급되어 석유화학 프로피온산 공장의 생산 비용을 상승시킵니다. 제한된 지역 내 프로필렌 생산량에 제약을 받는 유럽 제조사들은 가격 급등 시 마진 압박에 직면합니다. 대형 업체들은 장기 계약으로 변동성을 완화하지만, 중소 생산자들은 운전 자본 압박에 시달리며 주기적으로 가동률을 조정해 노출을 관리합니다. 이러한 상황은 기업들의 바이오 기반 공정 재관심을 불러일으키나, 발효 공정 경제성은 기존 프로필렌 공정 대비 여전히 불리합니다. 따라서 원가 변동성은 프로피온산 시장 확장에 약간의 제약을 가합니다.
부문 분석
2024년 프로피온산 시장의 51.86%를 차지한 동물 사료 및 식품 방부제 용도는 부패 방지 및 사료 효율 증진에서의 역할을 부각시켰습니다. 이 핵심 부문 내에서 칼슘 프로피오네이트와 같은 완충 염은 운영 안전성과 취급 용이성으로 인해 여전히 널리 사용됩니다. 반면 셀룰로오스 아세테이트 프로피오네이트는 틈새 시장이지만, 전자 코팅 및 제어 방출 제약 부형제의 수요 증가로 2030년까지 연평균 복합 성장률(CAGR) 6.49%를 기록할 전망입니다. 높은 단가는 물량 변동성을 완화하여 마진 다각화를 제공함으로써 프로피온산 시장 전체의 안정성을 강화합니다.
제초제 및 특수 용매의 파생 용도는 지속되나 환경 규제 강화로 인해 제형 개발사들은 생분해성과 잔류 독성 제한을 강조하고 있습니다. 가소제 제조업체들은 순환 경제 흐름에 부합하며 제품 차별화를 위해 바이오 기반 프로피온산 시험을 진행 중입니다. 비록 생산량은 주류 사료 용도를 따라가지 못하나, 이러한 특수 틈새 시장은 종종 두 자릿수 기여 마진을 제공하여 생산자들의 균형 잡힌 수익 구조를 뒷받침합니다. 이러한 광범위한 최종 사용 분야는 프로피온산 시장을 특정 수요 충격으로부터 보호합니다.
2024년 농업 부문은 가축 생산자와 곡물 취급업체가 손실 방지와 가축 성능 향상을 최우선으로 삼으면서 프로피온산 시장 규모의 56.95%를 차지했습니다. 사료 공장은 액체 프로피온산 또는 그 염을 특히 가금류와 돼지를 위한 매시 및 펠릿 사료에 혼합합니다. 동시에 농장 현장 적용자들은 저장 곡물에 프로피온산을 처리하여 점점 변동성이 커지는 수확 조건에서 곰팡이 생장을 억제합니다. 프로피온산 사용과 핵심 식량 안보 지표 간의 긴밀한 연계성은 정책 입안자들에게 그 전략적 중요성을 확고히 합니다.
의약품 수요는 규모는 작지만 6.02%의 연평균 복합 성장률(CAGR)로 증가하며, 남아시아와 라틴아메리카에서 일반의약품 비스테로이드성 항염증제(NSAID) 생산이 확대됨에 따라 가장 빠르게 성장하는 최종 사용 분야입니다. 식품 및 음료 가공업체는 베이커리 및 유제품 대체품에서 프로피온산의 클린 라벨 포지셔닝을 활용하여 중간 단일자리 수 성장률을 유지합니다. 화장품 제형 개발자들은 항균 및 컨디셔닝 효과를 탐구하며, 부패하기 쉬운 식물성 추출물을 대상으로 하는 리브온(leave-on) 스킨케어 제품에 대한 채택을 확대하고 있습니다. 이러한 점진적인 다각화는 프로피온산 시장이 균형 잡힌 위험-수익 프로필을 유지하도록 보장합니다.
지역 분석
유럽은 2024년 매출의 48.78%를 차지하며 선두를 달렸습니다. 이는 검증된 방부제 사용을 의무화하는 엄격한 사료 및 식품 규정과 강력한 제약 제조 기반에 힘입은 결과입니다. 독일, 프랑스, 네덜란드는 사일리지 처리 및 제빵 제품에 상당한 양을 소비하는 반면, 동유럽의 확장 중인 돼지 사육 부문은 점진적인 성장 가능성을 제공합니다. 에너지 가격 변동성이 유럽 마진을 압박하지만, 바이오경제 솔루션 추진으로 발효식 프로피온산 파일럿 설비에 보조금이 투입되며 혁신 리더십을 강화하고 있습니다.
아시아태평양 지역은 중국 축산 확대, 인도 가공식품 붐, 아세안 제빵 시장 급증에 힘입어 연평균 6.34% 성장률로 가장 빠르게 성장하는 지역입니다. 2024년 중국이 미국산 수입품에 부과한 43.5% 반덤핑 관세는 물동량 흐름을 전환시키고 BASF-SINOPEC의 난징 확장 프로젝트를 포함한 현지 생산 능력 확충을 촉발했습니다. 지역 생산자들은 사료용 곡물 허브 및 신흥 바이오 기반 화학 클러스터와의 근접성을 활용하여 공급 유연성을 확보함으로써 프로피온산 시장 침투를 가속화하고 있습니다.
북미는 성숙 단계의 꾸준한 수요 증가를 보입니다. 미국은 대규모 곡물 저장 수요를 유지하며, 중서부 협동조합들은 옥수수 및 대두 수확을 위한 자동 산성화 시스템을 도입했습니다. 중부 평원의 사료 사육장은 액상 프로피온산을 통합해 마이코톡신 발생을 억제하고 있으며, 캐나다 밀 수출업체들도 대양 횡단 운송을 위해 유사한 방부제를 사용합니다. 순수한 증설 대신 설비 합리화가 이루어지며, 주기적인 프로필렌 가격 변동 속에서 비용 경쟁력을 강화하기 위한 에너지 회수 시스템 업그레이드에 주력하고 있습니다. 이러한 점진적 효율성 증대는 지역 프로피온산 시장의 경쟁력을 보호하고 안정적인 물량 유지를 지원합니다.
기타 혜택 :
- 엑셀 형식 시장 예측(ME) 시트
- 3개월간의 애널리스트 지원
목차
제1장 서론
- 조사의 전제조건과 시장의 정의
- 조사 범위
제2장 조사 방법
제3장 주요 요약
제4장 시장 상황
- 시장 개요
- 시장 성장 촉진요인
- 곡물 및 사일리지 방부제 수요 증가
- 항생제 무첨가 육류 공급망에서의 사료용 산 사용 확대
- 신흥 아시아 지역 포장 베이커리 시장 확장
- 식품 보존 제품에 대한 수요 증가
- 동물 사료에서의 활용도 증가
- 시장 성장 억제요인
- 불안정한 석유계 원료 가격(프로필렌)
- 초가공 식품의 만성적 섭취에 대한 건강 우려
- 제초제의 사용에 관한 환경 우려
- 밸류체인 분석
- Porter's Five Forces
- 공급기업의 협상력
- 구매자의 협상력
- 신규 참가업체의 위협
- 대체 제품 및 서비스의 위협
- 경쟁도
제5장 시장 규모와 성장 예측
- 용도별
- 동물사료 및 방부제
- 칼슘, 암모늄, 나트륨염
- 셀룰로오스 아세테이트 프로피오네이트(CAP)
- 제초제
- 가소제와 용매
- 기타
- 최종 사용자 업계별
- 농업
- 식품 및 음료
- 퍼스널케어
- 의약품
- 기타 최종 사용자 산업
- 생산 경로별
- 석유화학
- 바이오 기반 발효
- 등급별
- 사료 등급
- 식품 등급
- 의약품 등급
- 산업용 등급
- 지역별
- 아시아태평양
- 중국
- 인도
- 일본
- 한국
- 기타 아시아태평양
- 북미
- 미국
- 캐나다
- 멕시코
- 유럽
- 독일
- 영국
- 프랑스
- 이탈리아
- 기타 유럽
- 남미
- 브라질
- 아르헨티나
- 기타 남미
- 중동 및 아프리카
- 사우디아라비아
- 남아프리카
- 기타 중동 및 아프리카
- 아시아태평양
제6장 경쟁 구도
- 시장 집중도
- 전략적 동향
- 시장 점유율(%)/랭킹 분석
- 기업 프로파일
- BASF SE
- Celanese Corporation
- Dow
- Eastman Chemical Company
- KANTO KAGAKU
- Kishida Chemical Co., Ltd
- Luxi Group
- Merck KGaA
- OXEA Gmbh
- Perstorp
- Shanghai Jianbei Organic Chemical Co., Ltd.
- Yancheng Hongtai Bioengineering Co., Ltd.
- Yancheng Huade(Dancheng) Biological Engineering Co.,Ltd.
제7장 시장 기회와 장래의 전망
HBR 25.11.10The propionic acid market is valued at USD 1.69 billion in 2025 and is projected to reach USD 2.23 billion by 2030, advancing at a 5.72% CAGR.
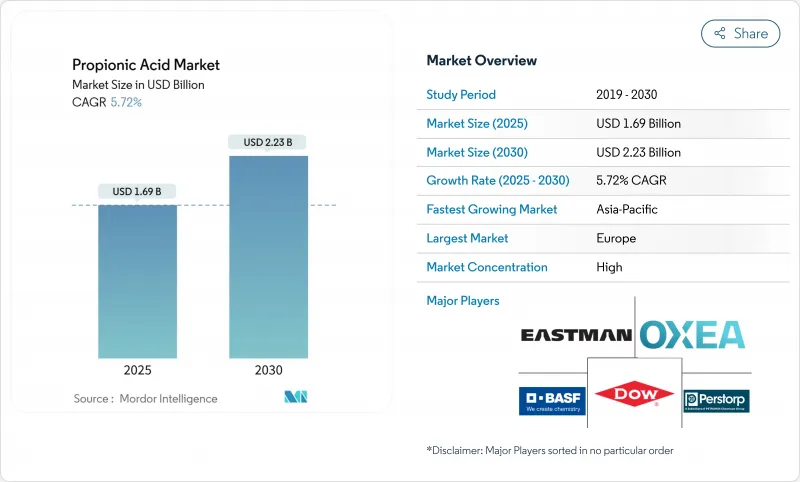
Adoption gains arise from the compound's broad utility in food preservation, animal nutrition, and specialty chemicals, while regulatory support such as the United States FDA's GRAS status underpins global usage. Europe anchors demand with entrenched food-safety rules and mature grain preservation chains, whereas Asia-Pacific posts the fastest expansion on the back of livestock intensification and rising packaged-food consumption. Feed efficiency demands, zero-antibiotic livestock initiatives, and the shift toward bio-based production routes collectively shape investment flows, even as petrochemical pathways maintain scale advantages. Strategic capacity additions in China, India, and Southeast Asia indicate a pivot toward regional self-sufficiency, partly propelled by recent trade frictions that heightened supply-security concerns.
Global Propionic Acid Market Trends and Insights
Rising demand for grain and silage preservatives
Climate variability magnifies moisture-related spoilage risks in stored grain and silage, prompting wider use of propionic acid for mold control. Doses as low as 0.6% curb Aspergillus and Penicillium growth, safeguarding feed quality during long storage intervals. Buffered formulations alleviate corrosion concerns, fostering uptake by medium-sized farms previously hesitant to employ acids. Field data show that treated grain can cut dry-matter losses by 15%, translating to tangible margin protection for grain handlers. As cross-border trade lengthens logistics chains, storage stability becomes pivotal, reinforcing the propionic acid market as a core enabler of global food-security strategies.
Increasing uptake of feed-grade acids in antibiotic-free meat chains
With regulators phasing out antibiotic growth promoters, producers pivot toward organic acids that sustain feed conversion improvements. Inclusion levels of 0.2-0.4% propionic acid in broiler diets lower gastrointestinal pH and suppress Salmonella and E. coli counts, rivalling antibiotic performance outcomes. European mandates against routine antibiotics have already boosted acidifier demand, and North American retail premiums for antibiotic-free meat reinforce adoption. Feed mills thus integrate propionic acid into reformulated premixes, driving incremental volumes that underpin the long-run resilience of the propionic acid market.
Volatile petro-based feedstock prices (propylene)
Sudden swings in crude oil markets reverberate through propylene contracts, inflating production costs for petrochemical propionic acid plants. European makers, constrained by limited regional propylene output, face margin compression during price spikes. While long-term contracts dampen volatility for large players, smaller producers grapple with working-capital strain, periodically trimming operating rates to manage exposure. These episodes renew corporate interest in bio-based routes, yet fermentation economics remain challenged relative to entrenched propylene pathways. Cost turbulence, therefore, imposes a modest drag on propionic acid market expansion.
Other drivers and restraints analyzed in the detailed report include:
- Expansion of packaged bakery in emerging Asia
- Growing requirement for food preservation products
- Health concerns over chronic consumption in ultra-processed foods
For complete list of drivers and restraints, kindly check the Table Of Contents.
Segment Analysis
Animal feed and food preservative uses held 51.86% share of the propionic acid market in 2024, underscoring its role in mitigating spoilage and boosting feed efficiency. Within this anchor segment, buffered salts such as calcium propionate remain prevalent for operational safety and ease of handling. At the other end of the spectrum, cellulose acetate propionate, although niche, posts a 6.49% CAGR through 2030 as electronics coatings and controlled-release pharmaceutical excipients gain traction. Its higher unit price cushions volume volatility, supplying margin diversity that reinforces overall propionic acid market stability.
Derivative uses in herbicides and specialty solvents continue but face environmental scrutiny, leading formulators to emphasize biodegradability and limited residual toxicity. Plasticizer manufacturers trial bio-based propionic acid to differentiate products, aligning with circular-economy narratives. While volumes lag mainstream feed applications, such specialty niches frequently deliver double-digit contribution margins, supporting producers' balanced revenue mix. The breadth of end-use verticals thus insulates the propionic acid market against isolated demand shocks.
Agriculture captured 56.95% of propionic acid market size in 2024 as livestock producers and grain handlers prioritized loss prevention and animal-performance gains. Feed mills incorporate liquid propionic acid or its salts into mash and pelleted diets, particularly for poultry and swine. In parallel, on-farm applicators dose stored grain to suppress mold growth during increasingly variable harvest conditions. The tight linkage between propionic acid usage and core food-security metrics anchors its strategic relevance to policymakers.
Pharmaceutical demand, although smaller, advances at 6.02% CAGR, making it the fastest-growing end-use as generic NSAID production scales in South Asia and Latin America. Food-and-beverage processors sustain mid-single-digit growth, leveraging propionic acid's clean-label positioning in bakery and dairy alternatives. Cosmetics formulators explore its antimicrobial plus conditioning benefits, widening adoption in leave-on skin-care products targeting spoilage-prone botanical extracts. This progressive diversification ensures the propionic acid market bears a balanced risk-return profile.
The Propionic Acid Market Report Segments the Industry by Application (Animal Feed and Preservatives, Calcium, Ammonium, and Sodium Salts, and More), End-User Industry (Agriculture, Food and Beverage, and More), Production Route (Petrochemical and Bio-Based Fermentation), Grade (Feed Grade, Food Grade, and More), and Geography (Asia-Pacific, North America, Europe, South America, and Middle East and Africa).
Geography Analysis
Europe led with 48.78% revenue in 2024, anchored by stringent feed-and-food regulations that mandate proven preservatives and by a strong pharmaceutical manufacturing base. Germany, France, and the Netherlands collectively consume sizeable volumes for silage treatment and bakery goods, while Eastern Europe's expanding swine sector offers incremental upside. Energy-price volatility pressures European margins, yet the region's push for bio-economy solutions channels grant funding to pilot fermentative propionic acid units, reinforcing its innovation leadership.
Asia-Pacific is the fastest-growing territory at 6.34% CAGR, driven by China's livestock expansion, India's processed-food boom, and ASEAN's bakery surge. The 2024 Chinese anti-dumping duty of 43.5% on United States imports redirected tonnage flows and triggered local capacity projects, including BASF-SINOPEC's Nanjing expansion. Regional producers leverage proximity to feed-grain hubs and emerging bio-based chemical clusters, ensuring supply agility that accelerates propionic acid market penetration.
North America shows steady, maturity-phase demand growth. The United States retains large-scale grain-storage needs, with Midwest cooperatives adopting automated acidification systems for corn and soybean harvests. Feedlots in the Central Plains integrate liquid propionic acid to curtail mycotoxin development, while Canadian wheat exporters similarly deploy preservatives for trans-oceanic shipments. Capacity rationalization has replaced pure expansions, focusing on energy recovery upgrades to improve cost positions amid cyclic propylene swings. Such incremental efficiencies safeguard competitiveness and support stable volumes within the regional propionic acid market.
- BASF SE
- Celanese Corporation
- Dow
- Eastman Chemical Company
- KANTO KAGAKU
- Kishida Chemical Co., Ltd
- Luxi Group
- Merck KGaA
- OXEA Gmbh
- Perstorp
- Shanghai Jianbei Organic Chemical Co., Ltd.
- Yancheng Hongtai Bioengineering Co., Ltd.
- Yancheng Huade (Dancheng) Biological Engineering Co.,Ltd.
Additional Benefits:
- The market estimate (ME) sheet in Excel format
- 3 months of analyst support
TABLE OF CONTENTS
1 Introduction
- 1.1 Study Assumptions and Market Definition
- 1.2 Scope of the Study
2 Research Methodology
3 Executive Summary
4 Market Landscape
- 4.1 Market Overview
- 4.2 Market Drivers
- 4.2.1 Rising demand for grain and silage preservatives
- 4.2.2 Increasing uptake of feed-grade acids in antibiotic-free meat chains
- 4.2.3 Expansion of packaged bakery in emerging Asia
- 4.2.4 Growing requirement for food preservation products
- 4.2.5 Rising Utilization in Animal Feed
- 4.3 Market Restraints
- 4.3.1 Volatile petro-based feedstock prices (propylene)
- 4.3.2 Health concerns over chronic consumption in ultra-processed foods
- 4.3.3 Environmental Concerns Regarding Use of Herbicides
- 4.4 Value Chain Analysis
- 4.5 Porter's Five Forces
- 4.5.1 Bargaining Power of Suppliers
- 4.5.2 Bargaining Power of Buyers
- 4.5.3 Threat of New Entrants
- 4.5.4 Threat of Substitute Products and Services
- 4.5.5 Degree of Competition
5 Market Size and Growth Forecasts (Value)
- 5.1 By Application
- 5.1.1 Animal Feed and Preservatives
- 5.1.2 Calcium, Ammonium and Sodium Salts
- 5.1.3 Cellulose Acetate Propionate (CAP)
- 5.1.4 Herbicides
- 5.1.5 Plasticizers and Solvents
- 5.1.6 Others
- 5.2 By End-user Industry
- 5.2.1 Agriculture
- 5.2.2 Food and Beverage
- 5.2.3 Personal Care
- 5.2.4 Pharmaceutical
- 5.2.5 Other End user Industries
- 5.3 By Production Route
- 5.3.1 Petrochemical
- 5.3.2 Bio-based Fermentation
- 5.4 By Grade
- 5.4.1 Feed Grade
- 5.4.2 Food Grade
- 5.4.3 Pharmaceutical Grade
- 5.4.4 Industrial Grade
- 5.5 By Geography
- 5.5.1 Asia-Pacific
- 5.5.1.1 China
- 5.5.1.2 India
- 5.5.1.3 Japan
- 5.5.1.4 South Korea
- 5.5.1.5 Rest of Asia-Pacific
- 5.5.2 North America
- 5.5.2.1 United States
- 5.5.2.2 Canada
- 5.5.2.3 Mexico
- 5.5.3 Europe
- 5.5.3.1 Germany
- 5.5.3.2 United Kingdom
- 5.5.3.3 France
- 5.5.3.4 Italy
- 5.5.3.5 Rest of Europe
- 5.5.4 South America
- 5.5.4.1 Brazil
- 5.5.4.2 Argentina
- 5.5.4.3 Rest of South America
- 5.5.5 Middle East and Africa
- 5.5.5.1 Saudi Arabia
- 5.5.5.2 South Africa
- 5.5.5.3 Rest of Middle East and Africa
- 5.5.1 Asia-Pacific
6 Competitive Landscape
- 6.1 Market Concentration
- 6.2 Strategic Moves
- 6.3 Market Share(%)/Ranking Analysis
- 6.4 Company Profiles (includes Global level Overview, Market level overview, Core Segments, Financials as available, Strategic Information, Market Rank/Share for key companies, Products and Services, and Recent Developments)
- 6.4.1 BASF SE
- 6.4.2 Celanese Corporation
- 6.4.3 Dow
- 6.4.4 Eastman Chemical Company
- 6.4.5 KANTO KAGAKU
- 6.4.6 Kishida Chemical Co., Ltd
- 6.4.7 Luxi Group
- 6.4.8 Merck KGaA
- 6.4.9 OXEA Gmbh
- 6.4.10 Perstorp
- 6.4.11 Shanghai Jianbei Organic Chemical Co., Ltd.
- 6.4.12 Yancheng Hongtai Bioengineering Co., Ltd.
- 6.4.13 Yancheng Huade (Dancheng) Biological Engineering Co.,Ltd.
7 Market Opportunities and Future Outlook
- 7.1 White-space and Unmet-Need Assessment
- 7.2 Novel low-carbon processes (electro-oxidative CO capture to PA)
- 7.3 Precision-fermentation routes for customised PA salts