|
시장보고서
상품코드
1640330
동아프리카 석유 및 가스 업스트림 - 시장 점유율 분석, 산업 동향 및 통계, 성장 예측(2025-2030년)East Africa Oil and Gas Upstream - Market Share Analysis, Industry Trends & Statistics, Growth Forecasts (2025 - 2030) |
||||||
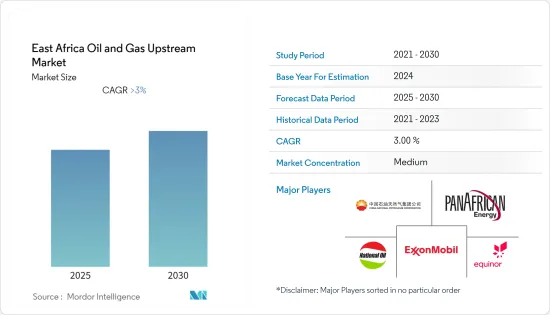
동아프리카의 석유 및 가스 업스트림 시장은 예측 기간 동안 3% 이상의 CAGR을 기록할 것으로 예상됩니다.

시장은 2020년에 COVID-19의 악영향을 받았습니다. 현재 시장은 전염병이 발생하기 전의 수준에 도달했습니다.
주요 하이라이트
- 중기적으로 이 지역의 석유 및 가스 생산과 소비 증가는 예측 기간 동안 동아프리카의 석유 및 가스 업스트림 시장을 끌어올릴 것으로 예상됩니다.
- 한편, 남수단, 소말리아 등 동아프리카 국가들의 불안정성이 석유 및 가스 부문의 성장을 저해할 가능성도 있습니다.
- 그러나 이 지역 전체에서 탐사 프로젝트가 증가하고 있는 것은 시장 진입 기업들에게 좋은 기회가 될 것으로 예상됩니다.
- 케냐는 석유산업에 대한 투자가 증가함에 따라 예측 기간 동안 시장을 독점할 것으로 예상됩니다.
동아프리카의 석유 및 가스 업스트림 시장 동향
온쇼어 부문이 시장을 독점
- 2021년 현재 동아프리카의 전체 석유 및 가스 생산량에서 육상 유전 및 가스전이 차지하는 비중은 큽니다. 예를 들어, 남수단의 석유 생산량은 온쇼어 유전에서 생산되는 것만으로 2010년 일 3만 1,000배럴에서 2021년에는 일 15만 3,000배럴로 증가할 것으로 예상됩니다.
- 석유 제품에 대한 수요 증가와 기존 및 신규 발견을 통한 석유 및 가스 생산 확대를 위한 동아프리카 국가들의 노력은 예측 기간 동안 육상 부문의 업스트림 활동을 촉진할 것으로 예상됩니다.
- 2022년 7월, 콩고민주공화국(DRC) 정부는 27개 석유광구 및 3개 가스광구를 향후 라이선스 라운드에서 제공할 계획을 발표하였습니다. 27개 석유광구 중 3개 광구는 중앙 콩고주 해안 분지, 11개 광구는 탕가니카 호수 주변, 9개 광구는 큐베트 센트럴, 4개 광구는 알버트 호수 주변입니다. 가스광구 3곳은 키부호 주변, 4곳은 알버트호 주변, 3곳은 키부호반에 있습니다.
- 2022년 10월, 인도 국영석유회사 자회사 ONGC Videsh Ltd(OVL)와 Indian Oil Corp.Ltd(IOCL)는 Tullow Oil PLC가 케냐에서 진행 중인 34억 달러 규모의 석유 프로젝트에 대한 참여 지분 약 50%를 공동 인수하기 위해 Tullow Oil PLC와 협상 중이라고 발표했습니다.
- 따라서 예측 기간 동안 온쇼어 부문이 시장을 독점할 것으로 예상됩니다.
괄목할 만한 성장세를 보이고 있는 케냐
- 동아프리카 지역에서는 케냐가 현재 석유 소비량의 약 2%에서 예측 기간 동안 원유 생산량이 크게 증가할 것으로 예상되는 중요한 국가 중 하나가 될 것으로 보입니다.
- 생산량 증가는 ONGC Videsh, IOCL, TotalEnergies와 같은 기업들의 투자 결정에 따른 것으로 예상됩니다.
- 2014년을 기점으로 2011년 1기였던 시추기 수가 11기로 증가하면서 많은 국제 석유회사들의 탐사 및 생산 활동이 크게 증가하였습니다. 그러나 2021년에는 4기의 시추기가 운영되고 있는 것으로 나타났습니다.
- 2022년 2월, TotalEnergies와 Lake Albert Development Project의 파트너들은 우간다와 탄자니아에서 최종 투자 결정과 프로젝트 시작을 발표했습니다.
- 2014년과 2020년의 유가 폭락은 시장에 심각한 영향을 미쳤습니다. 그러나 이후 회복세를 보이고 있으며, 이는 석유 및 가스 부문의 최종 투자 결정 건수 증가를 통해 확인할 수 있습니다.
- 석유 및 가스 업스트림 프로젝트에 대한 투자 증가는 예측 기간 동안 케냐의 석유 및 가스 업스트림 시장의 성장을 촉진할 것으로 보입니다.
동아프리카 석유 및 가스 업스트림 산업 개요
동아프리카의 석유 및 가스 업스트림 시장은 적당히 통합되어 있습니다. 주요 기업으로는 케냐 국영석유공사, Equinor ASA, ExxonMobil, PanAfrican Energy Tanzania Ltd, China National Petroleum Corporation 등이 있습니다.
기타 혜택
- 엑셀 형식의 시장 예측(ME) 시트
- 3개월간 애널리스트 지원
목차
제1장 소개
- 조사 범위
- 시장 정의
- 조사 가정
제2장 조사 방법
제3장 주요 요약
제4장 시장 개요
- 소개
- 2027년까지 석유 생산량 예측(단위 : 1,000배럴/일)
- 2027년까지 천연가스 생산량 예측(단위 : 10억 입방피트/일)
- 최근 동향과 개발
- 정부 정책 및 규정
- 시장 역학
- 성장 촉진요인
- 성장 억제요인
- 공급망 분석
- PESTLE 분석
제5장 시장 세분화
- 입지
- 온쇼어
- 오프쇼어
- 지역
- 탄자니아
- 모잠비크
- 케냐
- 기타 동아프리카
제6장 경쟁 구도
- M&A, 합작투자, 제휴, 협정
- 주요 기업의 전략
- 기업 개요
- National Oil Corporation of Kenya
- Equinor ASA
- Exxon Mobil Corporation
- PanAfrican Energy Tanzania Ltd
- China National Petroleum Corporation
- TotalEnergies SE
제7장 시장 기회와 향후 동향
ksm 25.02.10The East Africa Oil and Gas Upstream Market is expected to register a CAGR of greater than 3% during the forecast period.

The market was negatively impacted by COVID-19 in 2020. Currently, the market has reached pre-pandemic levels.
Key Highlights
- Over the medium term, increasing production and consumption of oil and gas in the region are expected to boost East Africa's oil and gas upstream market during the forecast period.
- On the other hand, instability in East African countries like South Sudan and Somalia may impede growth in the oil and gas sector in the region.
- However, an increasing number of exploration projects across the region are expected to act as an opportunity for the market players.
- Kenya is expected to dominate the market during the forecast period due to the rising investment in the oil industry.
East Africa Oil and Gas Upstream Market Trends
Onshore Sector to Dominate the Market
- As of 2021, onshore oil and gas fields accounted for a significant share of the total oil and gas production in East Africa. For example, South Sudan's oil production, which solely comes from onshore oilfields, increased from 31 thousand barrels per day in 2010 to 153 thousand barrels per day in 2021.
- The increasing demand for petroleum products and the East African countries' efforts to boost oil and gas production through existing and new discoveries are expected to drive the upstream activities in the onshore segment during the forecast period.
- In July 2022, the government of the Democratic Republic of Congo (DRC ) announced its plans to put on offer 27 oil blocks and three gas blocks in its upcoming licensing round. Of the 27 oil blocks, three are in the coastal basin of the Kongo Central province, 11 are near Lake Tanganyika, nine are in the Cuvette Centrale, and four are near Lake Albert. The three gas blocks are located on Lake Kivu.
- In October 2022, a consortium of India's national oil company's subsidiary ONGC Videsh Ltd (OVL) and Indian Oil Corp. Ltd (IOCL) announced that they are in talks with Tullow Oil PLC to jointly acquire around 50% participating interest in the latter's USD 3.4 billion oil project in Kenya.
- Therefore, due to such factors, the onshore sector is expected to dominate the market during the forecast period.
Kenya to Witness Significant Growth
- In the East African region, Kenya is likely to be one of the significant countries witnessing a significant ramp-up of crude oil production during the forecast period, up from approximately 2% of the country's current oil consumption.
- The production growth is expected due to the investment decision made by companies like ONGC Videsh, IOCL, and TotalEnergies.
- The country witnessed a significant rise in exploration and production activities from a number of international oil companies, starting in 2014 when the rig count in the country increased to 11 from a mere 1 in 2011. However, in 2021, the country only had four operational rigs.
- In February 2022, TotalEnergies and the Lake Albert Development Project partners announced the final investment decision and the launch of the project in Uganda and Tanzania, representing a total investment of approximately USD 10 billion.
- The crude oil prices crash of 2014 and 2020 severely impacted the market. However, it has recovered since then, which can be observed through the increasing number of final investment decisions in the country's oil and gas sector.
- The increased investment in upstream oil and gas projects is likely to drive the growth of Kenya's oil and gas upstream market during the forecast period.
East Africa Oil and Gas Upstream Industry Overview
The East African oil and gas upstream market is moderately consolidated. Some of the major companies include (in no particular order) the National Oil Corporation of Kenya, Equinor ASA, ExxonMobil Corporation, PanAfrican Energy Tanzania Ltd, and China National Petroleum Corporation.
Additional Benefits:
- The market estimate (ME) sheet in Excel format
- 3 months of analyst support
TABLE OF CONTENTS
1 INTRODUCTION
- 1.1 Scope of the Study
- 1.2 Market Definition
- 1.3 Study Assumptions
2 RESEARCH METHODOLOGY
3 EXECUTIVE SUMMARY
4 MARKET OVERVIEW
- 4.1 Introduction
- 4.2 Oil Production Forecast in thousand barrels per day, till 2027
- 4.3 Natural Gas Production Forecast in billion cubic feet per day, till 2027
- 4.4 Recent Trends and Developments
- 4.5 Government Policies and Regulations
- 4.6 Market Dynamics
- 4.6.1 Drivers
- 4.6.2 Restraints
- 4.7 Supply Chain Analysis
- 4.8 PESTLE ANALYSIS
5 MARKET SEGMENTATION
- 5.1 Location
- 5.1.1 Onshore
- 5.1.2 Offshore
- 5.2 Geography
- 5.2.1 Tanzania
- 5.2.2 Mozambique
- 5.2.3 Kenya
- 5.2.4 Rest of East Africa
6 COMPETITIVE LANDSCAPE
- 6.1 Mergers and Acquisitions, Joint Ventures, Collaborations, and Agreements
- 6.2 Strategies Adopted by Leading Players
- 6.3 Company Profiles
- 6.3.1 National Oil Corporation of Kenya
- 6.3.2 Equinor ASA
- 6.3.3 Exxon Mobil Corporation
- 6.3.4 PanAfrican Energy Tanzania Ltd
- 6.3.5 China National Petroleum Corporation
- 6.3.6 TotalEnergies SE


