|
시장보고서
상품코드
1640659
아시아태평양의 에너지 저장 시스템 시장 : 시장 점유율 분석, 산업 동향 및 통계, 성장 예측(2025-2030년)Asia-Pacific Energy Storage Systems - Market Share Analysis, Industry Trends & Statistics, Growth Forecasts (2025 - 2030) |
||||||
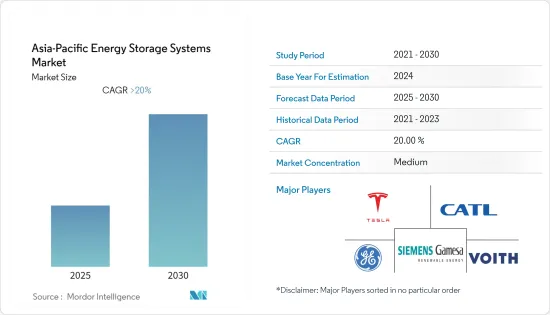
아시아태평양의 에너지 저장 시스템 시장은 예측 기간 동안 20% 이상의 CAGR로 추이할 전망입니다.
시장은 2020년에 COVID-19의 악영향을 받았습니다. 현재 시장은 팬데믹 전 수준에 도달하고 있습니다.
주요 하이라이트
- 중기적으로는 신재생 에너지 부문의 확대와 에너지 저장 기술의 지원 및 개발과 관련된 시책이 시장의 성장을 견인할 것으로 예측됩니다.
- 한편, 높은 자본 투자와 거대한 복잡성, 추가적인 공간 요건은 예측 기간 동안 아시아태평양의 에너지 저장 시스템 시장의 성장을 방해할 것으로 예상됩니다.
- 제품 기술 혁신과 태양광 발전 인버터의 최신 기술의 채택은 예측 기간 동안 아시아태평양의 축전 시스템 시장에 유리한 성장 기회를 가져올 가능성이 높습니다.
- 인도는 현저한 성장을 이루며 예측 기간 동안 현저한 CAGR로 추이할 가능성이 높습니다. 이 성장은 신재생 에너지에 대한 투자 증가와 정부의 지원 시책 때문입니다.
아시아태평양 에너지 저장 시스템 시장 동향
양수발전(PSH)이 시장을 독점
- 에너지 저장의 첫 번째 주요한 현대적 용도는 양수 발전입니다. 이 과정에서 오프 피크시에 사용 가능한 잉여 에너지를 이용하여 물을 펌프로 언덕 위의 저장소로 펌핑하고 피크시 정상적인 유량에 추가할 수 있습니다.
- 양수 발전은 보다 효율적인 에너지 저장 방법(약 75%)의 하나이지만, 순간적으로 이용할 수 없니다는 단점이 있습니다. 양수 발전소는 중장기 저장에 사용되며, 방류 시간은 몇 시간에서 며칠입니다.
- PSH의 전형적인 왕복 효율은 70%-84%입니다. PSH의 평균 수명은 50년 이상이며 배터리 수명이 8-15년인 것에 비해 PSH의 수명은 깁니다.
- 2021년 중국은 양수 발전용량으로 세계 1위를 차지했으며 36.3기가와트를 넘어섰습니다. 일본은 약 21.9기가와트의 용량으로 2위에 이어졌습니다.
- 2022년 1월, Power Construction Corporation of China(Power China)는 2025년까지 총 발전 용량 270GW의 양수 발전소를 200기 이상 건설할 계획을 발표했습니다. 이에 따라 이 나라에 에너지 저장 시스템의 기회가 생길 것으로 기대되고 있습니다.
- 인도는 2019년부터 2020년까지 총 13GW 용량의 수력 발전 프로젝트 79개를 추가할 계획이며, 여기에는 총 8.7GW의 양수 저장 프로젝트 11개가 포함됩니다(2029-2030년). 인도의 양수 저장 용량은 4.8GW(2021년 말 기준)입니다. 수력 발전은 51.4GW로 인도 전체 용량의 12%를 차지합니다. 따라서 새로운 이니셔티브와 프로젝트가 에너지 저장 시스템 시장을 주도할 것으로 예상됩니다.
- 2022년 4월 서호주에서 30MWh의 양수식 수력에너지 저장 프로젝트 건설 공사가 개시되어 2023년 후반 상업운전 개시를 목표로 하고 있습니다. 양수식 수력 에너지 저장(PHES) 시설의 최대 출력은 1.5MW로, 2개의 댐을 사용하여 30MWh의 에너지를 저장한다(지속 시간은 15시간).
- 따라서, 상기 요인들로부터, 양수 발전은 예측 기간 동안 시장을 독점할 가능성이 높습니다.
현저한 성장을 이루는 인도
- 신재생 에너지 발전부문의 확대는 신재생 에너지 발전의 간헐성에 관한 과제를 해결하기 위한 에너지 저장 시스템 수요가 확대될 것으로 예상됩니다. 또한 인도는 2018년 기준으로 구축된 9GW/17GWh의 소폭에서 2040년까지 1,095GW/2,850GWh로 기하급수적으로 증가하는 등 2040년까지 세 번째로 큰 에너지 저장 설치 국가가 될 수 있습니다.
- 남아시아 국가인 인도의 태양광 발전 용량은 2021년에는 전년 대비 26.4% 증가한 49.3 기가와트를 초과했습니다. 연구 기간 동안 수치는 지속적인 성장 추세를 나타냈습니다.
- 2021년 5월, 연방 내각은 축전지를 위한 24억 8,000만 달러의 생산 연동 장려금(PLI) 계획을 승인했습니다. 이 PLI 제도는 인도에서 50GWh ACC와 5GWh의 '니체' ACC의 생산 능력을 구축하기 위한 '선진화학 셀(ACC) 축전지에 관한 국가 프로그램' 제도입니다.
- 2021년 10월, 전력부는 축전용량의 도입을 가속화하기 위해 규제, 재정, 세제, 수요관리, 기술적 측면에 폭넓게 초점을 맞춘 에너지 저장에 관한 종합적인 시책을 내놓는 것을 목표로 한다고 발표했습니다.
- 2021년 12월, Solar Energy Corporation of India(SECI)는 타타 파워에 100MW의 EPC 태양광 발전 프로젝트와 120MWh의 유틸리티 규모 축전지 시스템의 건설을 주문했습니다. 타타 파워는 현재 레이에서 50MWh의 BESS 축전지를 갖춘 50MW에 의한 태양 광 발전 프로젝트를 실시 중입니다.
- 2022년 1월 ReNew Power는 미국에 본사를 둔 Fluence와 JV를 설립하여 인도에서 에너지 저장 솔루션을 제공할 계획을 발표했습니다. 이 JV는 카르나타카 주에 있는 300MW의 최고 전력 프로젝트에 필요한 150MWh의 BESS를 ReNew에 제공할 예정입니다.
- 따라서 위의 요인들로부터 인도는 아시아태평양에서 에너지 저장 시스템 시장의 큰 수요를 나타낼 것으로 기대됩니다.
아시아태평양 에너지 저장 시스템 산업 개요
아시아태평양의 에너지 저장 시스템 시장은 분할되어 있습니다. 이 시장의 주요 기업(순부동)에는 Tesla Inc., Contemporary Amperex Technology, General Electric Company, Siemens Gamesa Renewable Energy SA, Voith GmbH & Co.KGaA 등이 있습니다.
기타 혜택
- 엑셀 형식 시장 예측(ME) 시트
- 3개월간의 애널리스트 서포트
목차
제1장 서론
- 조사 범위
- 시장의 정의
- 조사의 전제
제2장 조사 방법
제3장 주요 요약
제4장 시장 개요
- 서문
- 시장 규모 및 수요 예측(단위 : 10억 달러)(-2027년)
- 최근 동향 및 개발
- 정부의 규제 및 시책
- 시장 역학
- 성장 촉진요인
- 성장 억제요인
- 공급망 분석
- Porter's Five Forces 분석
- 공급기업의 협상력
- 소비자의 협상력
- 신규 진입업자의 위협
- 대체품의 위협
- 경쟁 기업간 경쟁 관계의 강도
제5장 시장 세분화
- 유형별
- 배터리
- 양수 발전(PSH)
- 열에너지 저장(TES)
- 플라이휠 축전(FES)
- 기타
- 용도별
- 주택
- 상업 및 산업
- 지역별
- 중국
- 호주
- 인도
- 한국
- 기타 아시아태평양
제6장 경쟁 구도
- M&A, 합작사업, 제휴 및 협정
- 주요 기업의 전략
- 시장 점유율 분석
- 기업 프로파일
- Tesla Inc
- Contemporary Amperex Technology Co. Ltd
- Voith GmbH & Co. KGaA
- General Electric Company
- Hydrostor Inc.
- Siemens Gamesa Renewable Energy SA
- Fitzer Incorporation
- BYD Co. Ltd
- Bharat Heavy Electricals Limited
- NGK Insulators Ltd
제7장 시장 기회 및 향후 동향
AJY 25.02.14The Asia-Pacific Energy Storage Systems Market is expected to register a CAGR of greater than 20% during the forecast period.

The market was negatively impacted by COVID-19 in 2020. Presently the market has now reached pre-pandemic levels.
Key Highlights
- Over the medium term, increasing the renewable energy sector, and policies related to support and development of energy storage technology are expected to drive the growth of the market studied.
- On the other hand, high capital investments, along with huge complexity and additional space requirements are expected to hamper the growth of Asia-Pacific energy storage systems market during the forecast period.
- Nevertheless, product innovation and adaptation of the latest technologies in solar PV inverters are likely to create lucrative growth opportunities for the Asia-Pacific energy storage systems market in the forecast period.
- India to witness significant growth and also likely to witness the remarkable CAGR during the forecast period. This growth is attributed to the increasing investments in renewable energy, coupled with supportive government policies.
APAC Energy Storage Systems Market Trends
Pumped-Storage Hydroelectricity (PSH) to Dominate the Market
- The first primary modern application of energy storage was pumped-storage hydroelectricity. In this process, excess energy that is available during off-peak hours is used to pump water back up the hill to an upper reservoir, where it can be added to the regular flow during periods of peak demand.
- Pump storage is one of the more efficient methods of energy storage (around 75%) though it has the drawback of not being instantaneously available. Pumped hydro-storage plants are used for medium- or long-term storage, with discharge time ranging from several hours to few days.
- Typical round-trip efficiencies of PSH range between 70% and 84%. It has an average lifespan above 50 years, as compared to batteries, that lasts for 8-15 years, although significant refurbishments are required from time to time.
- In 2021, China ranked first in the world in terms of pumped storage hydropower capacity, with more than 36.3 gigawatts. The Japan followed second with roughly 21.9 gigawatts of capacity.
- In January 2022, the Power Construction Corporation of China (Power China) announced the plans to begin work on more than 200 pumped hydro plants with a combined generating capacity of 270GW by 2025. This is expected to create opportunities for energy storage systems in the country.
- India plans to add 79 hydropower projects with a total capacity of 30 GW, including 11 pumped-storage projects totaling 8.7 GW, during 2019-2020 to 2029-30. The country has a pumped storage capacity of 4.8 GW (end of 2021). Hydropower accounts for 12% of India's total capacity, with 51.4 GW. Thus, new initiatives and projects are expected to drive the energy storage systems market.
- In April 2022, Construction work commenced on a 30MWh pumped hydro storage project in Western Australia for a commercial operation start date in the second half of 2023. The pumped hydro energy storage (PHES) facility has a maximum power output of 1.5MW and uses two farm dams to store 30MWh of energy (15 hours duration).
- Therefore, based on the above-mentioned factors, pumped-storage hydroelectricity is likely to dominate the market over the forecast period.
India to Witness Significant Growth
- The growing renewable sector, the demand for the energy storage system, to address the challenges related to intermittency in renewable power generation, is expected to grow. Also, India may emerge the third-largest energy storage installation country by 2040 i.e. energy storage installations around the world will multiply exponentially, from a modest 9GW/17GWh deployed as of 2018 to 1,095GW/2,850 GWh by 2040.
- The solar photovoltaic energy capacity in the south Asian country of India peaked at over 49.3 gigawatts in 2021, up by 26.4 percent from the previous year. In the period of consideration figures presented a trend of continuous growth.
- In May 2021, the Union cabinet approved the USD 2.48 billion Production Linked Incentive (PLI) scheme for battery storage. The PLI scheme 'National Programme on Advanced Chemistry Cell (ACC) Battery Storage' for building the manufacturing capacity of 50 GWh of ACC and 5 GWh of 'Niche' ACC in India.
- In October 2021, the Power Ministry announced its aim to bring out a comprehensive policy on energy storage that would broadly focus on regulatory, financial, taxation, demand management, and technological aspects to speed up the implementation of storage capacity.
- In December 2021, the Solar Energy Corporation of India (SECI) awarded Tata Power to build a 100MW EPC solar project and a 120MWh utility-scale battery energy storage system. Tata Power is currently executing another solar project of 50MW with BESS of 50MWh battery storage in Leh.
- In January 2022, ReNew Power announced plans to set up a joint venture (JV) with US-based Fluence to provide energy storage solutions in India. The JV intends to offer the solution to ReNew, with 150 MWh BESS required for its 300 MW peak power project in Karnataka.
- Therefore, based on the above mentioned factors, India is expected to witness significant demand for energy storage systems market in Asia-Pacific region.
APAC Energy Storage Systems Industry Overview
The Asia-Pacific energy storage systems market is fragmented. Some of the major players in the market (in no particular order) include Tesla Inc., Contemporary Amperex Technology Co. Ltd, General Electric Company, Siemens Gamesa Renewable Energy SA, and Voith GmbH & Co. KGaA.
Additional Benefits:
- The market estimate (ME) sheet in Excel format
- 3 months of analyst support
TABLE OF CONTENTS
1 INTRODUCTION
- 1.1 Scope of the Study
- 1.2 Market Definition
- 1.3 Study Assumptions
2 RESEARCH METHODOLOGY
3 EXECUTIVE SUMMARY
4 MARKET OVERVIEW
- 4.1 Introduction
- 4.2 Market Size and Demand Forecast in USD billion, till 2027
- 4.3 Recent Trends and Developments
- 4.4 Government Policies and Regulations
- 4.5 Market Dynamics
- 4.5.1 Drivers
- 4.5.2 Restraints
- 4.6 Supply Chain Analysis
- 4.7 Porter's Five Forces Analysis
- 4.7.1 Bargaining Power of Suppliers
- 4.7.2 Bargaining Power of Consumers
- 4.7.3 Threat of New Entrants
- 4.7.4 Threat of Substitutes Products and Services
- 4.7.5 Intensity of Competitive Rivalry
5 MARKET SEGMENTATION
- 5.1 Type
- 5.1.1 Batteries
- 5.1.2 Pumped-storage Hydroelectricity (PSH)
- 5.1.3 Thermal Energy Storage (TES)
- 5.1.4 Flywheel Energy Storage (FES)
- 5.1.5 Other Types
- 5.2 Application
- 5.2.1 Residential
- 5.2.2 Commercial and Industrial
- 5.3 Geography
- 5.3.1 China
- 5.3.2 Australia
- 5.3.3 India
- 5.3.4 South Korea
- 5.3.5 Rest of Asia-Pacific
6 COMPETITIVE LANDSCAPE
- 6.1 Mergers and Acquisitions, Joint Ventures, Collaborations, and Agreements
- 6.2 Strategies Adopted by Leading Players
- 6.3 Market Share Analysis
- 6.4 Company Profiles
- 6.4.1 Tesla Inc
- 6.4.2 Contemporary Amperex Technology Co. Ltd
- 6.4.3 Voith GmbH & Co. KGaA
- 6.4.4 General Electric Company
- 6.4.5 Hydrostor Inc.
- 6.4.6 Siemens Gamesa Renewable Energy SA
- 6.4.7 Fitzer Incorporation
- 6.4.8 BYD Co. Ltd
- 6.4.9 Bharat Heavy Electricals Limited
- 6.4.10 NGK Insulators Ltd