|
시장보고서
상품코드
1910612
산업용 컴퓨터 단층촬영(CT) 시장 : 점유율 분석, 업계 동향 및 통계, 성장 예측(2026-2031년)Industrial Computed Tomography - Market Share Analysis, Industry Trends & Statistics, Growth Forecasts (2026 - 2031) |
||||||
산업용 컴퓨터 단층촬영(CT) 시장은 2025년 5억 4,775만 달러로 평가되었으며, 2026년 5억 9,486만 달러에서 2031년까지 8억 9,859만 달러에 이를 것으로 예측됩니다.
예측기간(2026-2031년)의 CAGR은 8.60%로 전망됩니다.

견조한 확대는 항공우주, 자동차, 전자기기, 적층 제조의 워크플로에서 본 모달리티가 틈새 검사 수단에서 주류 품질 보증 플랫폼으로 이행하고 있음을 반영하고 있습니다. 수요는 전기자동차 공급망을 위한 배터리 안전 규제 강화, 체적 검증을 필요로 하는 적층 제조의 급증, 사이클 타임을 단축하는 AI 기반의 자동 결함 인식, 서브 미크론 해상도 검사를 필요로 하는 소형 전자기기에 의해 견인되고 있습니다. 시스템 벤더는 고속화가 진행되는 검출기 기술, 단일 스캔으로 재료를 분리하는 듀얼 에너지원, 중소 제조업체의 도입을 가능하게 하는 하드웨어 가격의 저하 등의 혜택도 받고 있습니다. 높은 초기 자본 비용과 숙련된 CT 기사의 세계적 부족이 도입을 억제하고 있지만, 임대나 X선 서비스 등의 제공 형태를 갖춘 자금 조달 모델이 고객 기반을 확대하고 있습니다. 현재 아시아태평양이 수익면에서 주도적 입장에 있으며, 중국, 일본, 한국이 전자기기 및 정밀 제조 라인에 CT를 도입하면서 가장 급격한 성장 곡선을 나타내고 있습니다.
세계의 산업용 컴퓨터 단층촬영(CT) 시장의 동향 및 인사이트
`항공우주 및 자동차 분야에서 비파괴 검사 수요 증가
민간 항공기 프로그램에서는 복합소재 날개나 3D 프린팅 브래킷의 검증에 CT가 활용되고, 이 검사 방법은 보조적인 검사에서 최초 제품 검사나 양산 공정에서의 필수 게이트(검사 포인트)로 위치가 변화하고 있습니다. 자동차 제조업체는 CT를 엔진 블록의 주조 검사에서 배터리 팩 검증까지 확장하고 있으며, 열 전파 분석에는 정밀한 내부 형상 매핑이 필요합니다. 이 기술은 탄소섬유 강화 부품에서 서브mm 수준의 공극을 감지할 수 있으므로 AS9100 및 ISO/TS 16949 품질 기준을 충족하면서 경량화 목표 달성을 지원합니다.
적층 제조에서 품질 관리의 보급 확대
GE사의 LEAP 엔진 연료 노즐 양산 검사에서 알 수 있듯이 산업용 CT는 3D 프린팅 금속 부품의 층별 결함 검출을 위한 기준 도구입니다. 실시간 재구성과 자동 결함 분류를 통해 스캔에서 판단까지의 시간을 8시간에서 2시간으로 단축하여 CT를 대량 생산 AM 라인에서 실용화하고 있습니다. ISO/ASTM 52900 규격은 CT 허용 기준을 포함하고 있으며, 이 기법은 임의의 점검이 아닌 컴플라이언스 요건이 되고 있습니다.
고출력 CT 시스템의 높은 취득 및 운용 비용
10마이크로미터 미만의 해상도를 실현하는 장치는 차폐 설비, 안전 시스템, 시설 개보수를 포함하면 150만-300만 달러의 비용이 필요합니다. 연간 관구 교환과 100kW의 전력 소비는 운영 비용을 증가시킵니다. 임대 계약은 지불을 분산하지만 총 소유 비용을 증가시키고 일정 조정의 유연성을 제한합니다.
부문 분석
2025년 시점에서 300kV 이상의 고전압 장치가 산업용 CT 시장의 62.15%를 차지했습니다. 이는 항공우주용 강철 주물이나 두꺼운 알루미늄 부품 등 높은 투과성이 요구되는 부품 수요에 의해 발생한 것입니다. 중저전압 장치의 점유율은 낮으며 전자부품 라인에서 데스크톱 시스템이 주목을 받고 있는 가운데 2031년까지 연평균 복합 성장률(CAGR) 9.78%로 확대될 것으로 전망됩니다. 루마필드사의 10만 달러 미만인 데스크톱 스캐너는 재무적 장벽을 줄임으로써 대응 가능한 시장 기반을 확대하고 있습니다. 구조화 애노드 기술은 방열성을 향상시켜 냉각 부하를 추가하지 않고 160kV 및 225kV 유닛에 의한 폴리머나 알루미늄의 촬영을 가능하게 하고 있습니다.
고전압 장치의 소유자는 고밀도 부품의 선명한 이미지를 얻기 위해 넓은 설치 영역과 차폐 대책을 도입합니다. 한편, 회로 기판이나 플라스틱 조립품에 특화된 연구소에서는 공간 절약성과 운영 비용 절감을 위해 저에너지 장치를 선택합니다. 이러한 이중 구조의 동향은 2031년까지 공급업체의 제품 포트폴리오와 자금 조달 체계를 형성할 전망입니다.
결함 검출은 주조 및 복합재 검사에서의 확고한 역할에 의해 2025년 수요의 47.65%를 차지했습니다. 한편 조립 분석은 자동차 제조업체나 전자기기 제조업체가 양산 기반의 계측으로 이행함에 따라 CAGR 10.05%로 확대될 것으로 전망됩니다. 배터리 팩 제조업체는 열 폭주 사고를 방지하기 위해 팩 밀봉 전에 셀 배치와 용접 위치의 무결성을 매핑합니다. 마이크로 일렉트로닉스 라인에서는 다이스택 디바이스의 자동 GD&T 보고서 작성에서 CT 복셀과 CAD 데이터를 비교하고 있습니다.
연구기관의 고장 분석 부문은 틈새이면서 중요한 사용자층이며, 현장 고장 발생 시의 포렌식 분해에 CT를 적용하고 있습니다. 새로운 약물 전달 장치 및 의료용 임플란트는 비파괴적인 내부 확인을 요구하는 소규모이면서 성장하는 또 다른 분야를 형성합니다.
지역별 분석
아시아태평양은 2025년 수익의 36.85%를 차지하였으며 중국의 전자기기 및 EV 공급망, 일본의 정밀 자동차 제조, 한국의 메모리 제조 공장을 배경으로 2031년까지 연평균 복합 성장률(CAGR) 11.76%로 확대될 것으로 전망됩니다. 중국의 GB38031-2025 배터리 규제로 CT는 현지 EV 리더가 팩 검증 셀에 투자하도록 촉진하고 있습니다. 일본의 OEM은 하이브리드 플랫폼 복합재의 적합성과 마무리를 보장하기 위해 µ-CT를 이용하고 있으며, 한국의 팹은 3D NAND 스택을 검증하기 위해 마이크로 CT를 활용하고 있습니다.
북미는 보잉 및 록히드 마틴과 같은 항공우주 대기업이 복합소재 날개와 3D 프린팅된 Ti-6Al-4V 브래킷의 고해상도 검사를 요구하고 있기 때문에 상당한 점유율을 차지하고 있습니다. 또한 미국은 AI를 활용한 결함 인식의 도입을 선도하고 있으며, 스타트업 기업은 클라우드 기반 분석을 CT 워크플로에 통합하고 있습니다. 멕시코의 EV 배터리 라인과 캐나다의 민간 및 항공우주 클러스터가 이 지역의 수요를 더욱 지원하고 있습니다.
유럽에서는 독일의 자동차 제조업체가 알루미늄 엔진 하우징과 다이캐스트 배터리 케이스를 검증하는 등 꾸준한 성장을 유지하고 있습니다. EU 배터리 규정 2023/1542에서는 내부 단락을 감지하기 위해 CT 스캔을 사용하는 경우가 많고, 따라서 보다 광범위한 안전성 테스트가 요구됩니다. 프랑스 항공우주 산업의 1차 공급업체는 복합소재 팬 블레이드에 듀얼 에너지 CT를 도입하고 영국은 Innovate UK의 자금 지원을 통해 적층 제조 부품용 인라인 CT를 개량하는 정부-민간 공동 연구소가 지원하고 있습니다.
기타 혜택
- 시장 예측(ME) 엑셀 시트
- 3개월 애널리스트 서포트
자주 묻는 질문
목차
제1장 서론
- 조사 전제조건 및 시장 정의
- 조사 범위
제2장 조사 방법
제3장 주요 요약
제4장 시장 상황
- 시장 개요
- 촉진요인
- 항공우주 및 자동차 산업에서 비파괴 검사 수요 증가
- 적층 제조에서 품질 관리 도입 확대
- 검출기 해상도와 화상 재구성 기술의 진보
- 전자기기의 소형화로 마이크로 CT 검사의 필요성 증가
- AI 구동형 자동 결함 인식에 의한 사이클 타임 단축
- 전기자동차(EV) 공급망용 배터리 안전 규제
- 억제요인
- 고출력 CT 시스템의 높은 도입 및 운용 비용
- 방사선 안전 규제에 대한 대응 부담과 시설 개보수
- 숙련된 CT 기사 및 데이터 분석가 부족
- 신흥 테라헤르츠 및 초음파 모달리티와의 경쟁
- 업계 공급망 분석
- 규제 상황
- 기술 전망
- 거시 경제적 요인의 영향
- Porter's Five Forces 분석
- 공급자의 협상력
- 구매자의 협상력
- 신규 참가업체의 위협
- 대체품의 위협
- 경쟁 기업 간 경쟁 관계
제5장 시장 규모 및 성장 예측
- 전압 범위별
- 저 및 중전압(300kV 미만)
- 고전압(300kV 이상)
- 용도별
- 결함 검출 및 검사
- 고장 해석
- 어셈블리 분석
- 기타 용도
- 기술별 및 스캔 기술별
- 팬 빔 CT
- 콘 빔 CT
- 기타
- 최종 사용자 산업별
- 항공우주 및 방위산업
- 자동차
- 전자기기 및 반도체
- 의료기기
- 학술연구기관
- 기타 산업
- 지역별
- 북미
- 미국
- 캐나다
- 멕시코
- 남미
- 브라질
- 아르헨티나
- 기타 남미
- 유럽
- 독일
- 영국
- 프랑스
- 이탈리아
- 스페인
- 러시아
- 기타 유럽
- 아시아태평양
- 중국
- 일본
- 인도
- 한국
- 기타 아시아태평양
- 중동 및 아프리카
- 중동
- 사우디아라비아
- 아랍에미리트(UAE)
- 튀르키예
- 기타 중동
- 아프리카
- 남아프리카
- 나이지리아
- 기타 아프리카
- 중동
- 북미
제6장 경쟁 구도
- 시장 집중도
- 전략적 동향
- 시장 점유율 분석
- 기업 프로파일
- Baker Hughes Company(Waygate Technologies)
- Carl Zeiss AG
- Nikon Corporation-Nikon Metrology NV
- Comet Group-Yxlon International GmbH
- Wenzel Group GmbH and Co. KG
- North Star Imaging Inc.
- Diondo GmbH
- Werth Messtechnik GmbH
- RX Solutions SAS
- VJ Technologies Inc.
- VisiConsult X-ray Systems and Solutions GmbH
- Rigaku Corporation
- Sanying Precision Instruments Co., Ltd.
- Aolong Radiative Instrument Group Co., Ltd.
- Seamark ZM Technology Co., Ltd.
- Royma Tech(Suzhou) Precision Co., Ltd.
- Shimadzu Corporation
- Hitachi High-Tech Corporation
- Thermo Fisher Scientific Inc.
- Lumafield Inc.
제7장 시장 기회 및 미래 전망
CSM 26.01.28The industrial computed tomography market was valued at USD 547.75 million in 2025 and estimated to grow from USD 594.86 million in 2026 to reach USD 898.59 million by 2031, at a CAGR of 8.60% during the forecast period (2026-2031).
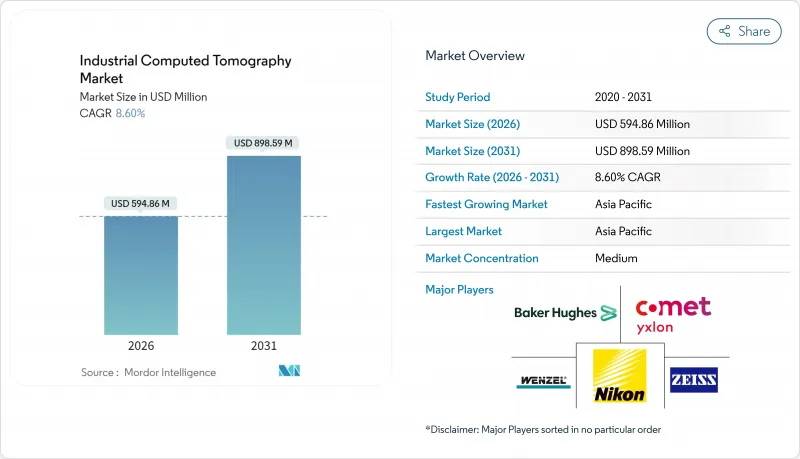
Robust expansion reflects the modality's transition from a niche inspection option to a mainstream quality-assurance platform in aerospace, automotive, electronics, and additive manufacturing workflows. Demand is driven by tighter battery-safety regulations for electric-vehicle supply chains, the surge of additive manufacturing that necessitates volumetric validation, AI-based automated defect recognition that reduces cycle time, and miniaturized electronics that require sub-micron resolution inspection. System vendors are also benefiting from faster detector technology, dual-energy sources that separate materials within a single scan, and declining hardware prices that make the modality accessible to smaller manufacturers. High initial capital costs and a global shortage of trained CT operators temper adoption; however, financing models such as leasing and X-as-a-service are broadening the customer base. The Asia-Pacific region leads in revenue today and exhibits the steepest growth curve, as China, Japan, and South Korea integrate CT into their electronics and precision manufacturing lines.
Global Industrial Computed Tomography Market Trends and Insights
Rising demand for non-destructive testing in aerospace and automotive
Commercial aircraft programs rely on CT to validate composite wings and 3D-printed brackets, converting the modality from supplementary inspection to a mandatory gate in first-article and serial production workflows. Automakers extend CT beyond engine-block casting checks to battery-pack validation, where thermal propagation analysis requires precise internal geometry mapping. The technology's ability to locate sub-millimeter voids in carbon-fiber-reinforced parts supports weight-reduction goals while meeting AS9100 and ISO/TS 16949 quality standards.
Growing adoption of additive manufacturing quality control
Industrial CT is the reference tool for layer-wise defect detection in 3D-printed metal parts, as demonstrated by GE's serial production inspection of LEAP engine fuel nozzles. Real-time reconstruction and automated defect classification cut scan-to-decision time from eight hours to two, making CT viable for higher-volume AM lines. ISO/ASTM 52900 standards incorporate CT acceptance criteria, making the modality a compliance requirement rather than an optional check.
High acquisition and operating cost of high-power CT systems
Installations capable of sub-10 µm resolution cost between USD 1.5 million and USD 3 million, once shielding, safety systems, and site upgrades are factored in. Annual tube replacement and 100 kW power consumption inflate running costs. Leasing spreads payments but raises the total cost of ownership and limits schedule flexibility.
Other drivers and restraints analyzed in the detailed report include:
- Advances in detector resolution and image reconstruction
- Miniaturization of electronics necessitating µ-CT inspection
- Radiation-safety compliance burden and facility upgrades
For complete list of drivers and restraints, kindly check the Table Of Contents.
Segment Analysis
High-voltage installations of>= 300 kV held a 62.15% industrial computed tomography market share in 2025, driven by the demand for aerospace steel castings and thick aluminum parts that require deep penetration. Low- to medium-voltage units account for a smaller slice but post a 9.78% CAGR to 2031 as desktop systems gain appeal in electronic lines. Lumafield's sub-USD 100,000 desktop scanners widen the addressable base by lowering the financial hurdle. Structured anode technology improves heat removal, allowing 160 kV and 225 kV units to image polymers and aluminum without adding a cooling burden.
High-voltage owners accept larger floor space and shielding needs in exchange for image clarity on dense parts, whereas labs focused on circuit boards and plastic assemblies choose lower-energy units for compactness and reduced operating costs. This two-tier dynamic shapes vendor portfolios and financing schemes through 2031.
Flaw detection retained 47.65% of the demand in 2025, thanks to its entrenched roles in casting and composite inspection. Assembly analysis, however, is forecast to climb at a 10.05% CAGR as automakers and electronics firms switch to volume-based metrology. Battery-pack builders map cell placement and weld alignment before sealing the pack to prevent thermal runaway events. Microelectronics lines compare CT voxels to CAD in automated GD&T reports for die-stack devices.
Failure-analysis groups at research institutes remain a niche but critical user set, applying CT to forensic teardown when field failures arise. New drug-delivery devices and medical implants form another small yet growing cluster seeking non-destructive interior confirmation.
The Industrial Computed Tomography Market Report is Segmented by Voltage Range (Low-Medium Voltage and High Voltage), Application (Flaw Detection/Inspection, Failure Analysis, and More), Technology/Scanning Technique (Fan-Beam CT, and More), End-User Industry (Aerospace and Defense, Automotive, and More), and Geography. The Market Forecasts are Provided in Terms of Value (USD).
Geography Analysis
Asia-Pacific generated 36.85% of 2025 revenue and is projected to compound at 11.76% CAGR through 2031 on the back of China's electronics and EV supply chain, Japan's precision car-making, and South Korea's memory fabs. China's GB38031-2025 battery rule prompts CT to invest in pack validation cells serving local EV leaders. Japanese OEMs utilize µ-CT to ensure composite fit and finish in hybrid platforms, while South Korean fabs rely on micro-CT to verify 3D NAND stacks.
North America posts a sizable share anchored by aerospace primes such as Boeing and Lockheed Martin, who demand high-resolution inspection for composite wings and 3D-printed Ti-6Al-4V brackets. The U.S. also leads the adoption of AI-assisted defect recognition, with startups integrating cloud-based analytics into CT workflows. Mexico's EV battery lines and Canada's civil and aerospace clusters further underpin regional demand.
Europe maintains steady growth as Germany's automakers verify aluminum engine housings and die-cast battery enclosures. The EU Battery Regulation 2023/1542 requires more extensive safety testing, often conducted via CT scans to detect internal shorts. France's aerospace tier-ones deploy dual-energy CT for composite fan blades, and the U.K.'s Innovate UK funding supports public-private labs refining in-line CT for additive manufacturing components.
- Baker Hughes Company (Waygate Technologies)
- Carl Zeiss AG
- Nikon Corporation - Nikon Metrology NV
- Comet Group - Yxlon International GmbH
- Wenzel Group GmbH and Co. KG
- North Star Imaging Inc.
- Diondo GmbH
- Werth Messtechnik GmbH
- RX Solutions SAS
- VJ Technologies Inc.
- VisiConsult X-ray Systems and Solutions GmbH
- Rigaku Corporation
- Sanying Precision Instruments Co., Ltd.
- Aolong Radiative Instrument Group Co., Ltd.
- Seamark ZM Technology Co., Ltd.
- Royma Tech (Suzhou) Precision Co., Ltd.
- Shimadzu Corporation
- Hitachi High-Tech Corporation
- Thermo Fisher Scientific Inc.
- Lumafield Inc.
Additional Benefits:
- The market estimate (ME) sheet in Excel format
- 3 months of analyst support
TABLE OF CONTENTS
1 INTRODUCTION
- 1.1 Study Assumptions and Market Definition
- 1.2 Scope of the Study
2 RESEARCH METHODOLOGY
3 EXECUTIVE SUMMARY
4 MARKET LANDSCAPE
- 4.1 Market Overview
- 4.2 Market Drivers
- 4.2.1 Rising demand for non-destructive testing in aerospace and automotive
- 4.2.2 Growing adoption of additive manufacturing quality control
- 4.2.3 Advances in detector resolution and image reconstruction
- 4.2.4 Miniaturisation of electronics necessitating µ-CT inspection
- 4.2.5 AI-driven automated defect recognition reducing cycle time
- 4.2.6 Battery-safety regulations for EV supply chains
- 4.3 Market Restraints
- 4.3.1 High acquisition and operating cost of high-power CT systems
- 4.3.2 Radiation-safety compliance burden and facility upgrades
- 4.3.3 Scarcity of skilled CT operators and data analysts
- 4.3.4 Competition from emerging terahertz and ultrasound modalities
- 4.4 Industry Supply Chain Analysis
- 4.5 Regulatory Landscape
- 4.6 Technological Outlook
- 4.7 Impact of Macroeconomic Factors
- 4.8 Porter's Five Forces Analysis
- 4.8.1 Bargaining Power of Suppliers
- 4.8.2 Bargaining Power of Buyers
- 4.8.3 Threat of New Entrants
- 4.8.4 Threat of Substitutes
- 4.8.5 Intensity of Competitive Rivalry
5 MARKET SIZE AND GROWTH FORECASTS (VALUE)
- 5.1 By Voltage Range
- 5.1.1 Low-Medium Voltage (Less than 300 kV)
- 5.1.2 High Voltage (Greater thann or Equal to 300 kV)
- 5.2 By Application
- 5.2.1 Flaw Detection / Inspection
- 5.2.2 Failure Analysis
- 5.2.3 Assembly Analysis
- 5.2.4 Other Applications
- 5.3 By Technology/Scanning Technique
- 5.3.1 Fan-Beam CT
- 5.3.2 Cone-Beam CT
- 5.3.3 Others
- 5.4 By End-user Industry
- 5.4.1 Aerospace and Defense
- 5.4.2 Automotive
- 5.4.3 Electronics and Semiconductors
- 5.4.4 Medical Devices
- 5.4.5 Academic and Research Institutes
- 5.4.6 Other Industries
- 5.5 By Geography
- 5.5.1 North America
- 5.5.1.1 United States
- 5.5.1.2 Canada
- 5.5.1.3 Mexico
- 5.5.2 South America
- 5.5.2.1 Brazil
- 5.5.2.2 Argentina
- 5.5.2.3 Rest of South America
- 5.5.3 Europe
- 5.5.3.1 Germany
- 5.5.3.2 United Kingdom
- 5.5.3.3 France
- 5.5.3.4 Italy
- 5.5.3.5 Spain
- 5.5.3.6 Russia
- 5.5.3.7 Rest of Europe
- 5.5.4 Asia-Pacific
- 5.5.4.1 China
- 5.5.4.2 Japan
- 5.5.4.3 India
- 5.5.4.4 South Korea
- 5.5.4.5 Rest of Asia-Pacific
- 5.5.5 Middle East and Africa
- 5.5.5.1 Middle East
- 5.5.5.1.1 Saudi Arabia
- 5.5.5.1.2 United Arab Emirates
- 5.5.5.1.3 Turkey
- 5.5.5.1.4 Rest of Middle East
- 5.5.5.2 Africa
- 5.5.5.2.1 South Africa
- 5.5.5.2.2 Nigeria
- 5.5.5.2.3 Rest of Africa
- 5.5.5.1 Middle East
- 5.5.1 North America
6 COMPETITIVE LANDSCAPE
- 6.1 Market Concentration
- 6.2 Strategic Moves
- 6.3 Market Share Analysis
- 6.4 Company Profiles (includes Global level Overview, Market level overview, Core Segments, Financials, Strategic Information, Market Rank/Share, Products and Services, Recent Developments)
- 6.4.1 Baker Hughes Company (Waygate Technologies)
- 6.4.2 Carl Zeiss AG
- 6.4.3 Nikon Corporation - Nikon Metrology NV
- 6.4.4 Comet Group - Yxlon International GmbH
- 6.4.5 Wenzel Group GmbH and Co. KG
- 6.4.6 North Star Imaging Inc.
- 6.4.7 Diondo GmbH
- 6.4.8 Werth Messtechnik GmbH
- 6.4.9 RX Solutions SAS
- 6.4.10 VJ Technologies Inc.
- 6.4.11 VisiConsult X-ray Systems and Solutions GmbH
- 6.4.12 Rigaku Corporation
- 6.4.13 Sanying Precision Instruments Co., Ltd.
- 6.4.14 Aolong Radiative Instrument Group Co., Ltd.
- 6.4.15 Seamark ZM Technology Co., Ltd.
- 6.4.16 Royma Tech (Suzhou) Precision Co., Ltd.
- 6.4.17 Shimadzu Corporation
- 6.4.18 Hitachi High-Tech Corporation
- 6.4.19 Thermo Fisher Scientific Inc.
- 6.4.20 Lumafield Inc.
7 MARKET OPPORTUNITIES AND FUTURE OUTLOOK
- 7.1 White-space and Unmet-need Assessment