
|
시장보고서
상품코드
1683164
조강 콘크리트 시장 : 시장 점유율 분석, 산업 동향 및 통계, 성장 예측(2025-2030년)Rapid Strength Concrete - Market Share Analysis, Industry Trends & Statistics, Growth Forecasts (2025 - 2030) |
||||||
■ 보고서에 따라 최신 정보로 업데이트하여 보내드립니다. 배송일정은 문의해 주시기 바랍니다.
가격
※ 부가세 별도
한글목차
영문목차
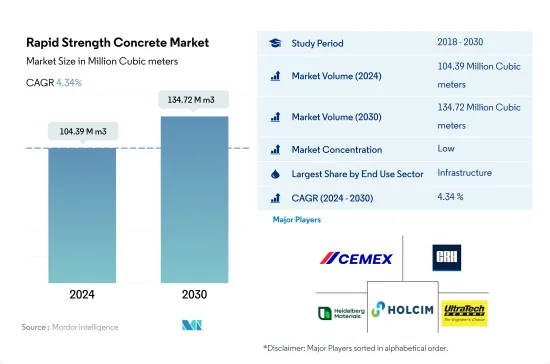
조강 콘크리트 시장의 2024년 규모는 1억 439만 입방미터로 평가되었고, 2030년에는 1억 3,472만 입방미터에 이를 전망이며, 예측 기간 중 2024년부터 2030년까지 CAGR은 4.34%로 성장할 것으로 예측됩니다.
세계의 인프라 지출은 2030년까지 3조1,500억 달러에 달할 것으로 예상되며, 조강 콘크리트 수요를 견인할 가능성이 높습니다.
- 2022년 세계 조강 콘크리트의 소비량은 주로 인프라 건설 부문에서 수요 증가에 견인되어 전년대비 0.05% 소폭 증가했습니다. 특히 2022년 세계 인프라 지출은 전년 대비 2.03% 증가했습니다. 2023년에는 세계의 조강 콘크리트가 크게 급증했으며, 추정 성장률은 9.12%로 평가되었습니다.
- 인프라는 조강 콘크리트의 주요 최종 사용자로 부상하며 2023년에는 실질 6,366만 입방미터를 차지했습니다. 예측에 따르면 이 수치는 2030년까지 9,047만 입방미터까지 상승할 전망입니다. 2030년까지 경이로운 3조 1,500억 달러에 달할 것으로 예상되는 인프라 지출 증가는 조강 콘크리트 시장을 더욱 강화하는 태세를 갖추고 있습니다. 특히 고속도로, 교량, 공항, 빌딩 등 정부 지원 프로젝트가 이 수요를 견인하고 있으며, 엄격한 품질 및 기한 요건을 충족시키기 위해 대량의 일류 콘크리트가 필요합니다.
- 부문 중에서 주택건설은 가장 높은 성장 궤도를 묘사하고 있으며 예측기간 동안 CAGR은 6%로 예측됩니다. 도시화, 정부의 이니셔티브, 외국과 국내 투자 등의 요인이 주택 수요를 촉진하고 있습니다. 예를 들어 독일은 2024년까지 최소 4,000호의 주택을 새로 건설할 예정이며, 말레이시아 정부는 2025년까지 약 50만 호의 저렴한 주택을 건설할 야심찬 계획을 세웠습니다. 그 결과 주택 부문의 조강 콘크리트 수요는 2023년 수치에 비해 2030년까지 372만 입방미터로 급증할 것으로 예상됩니다.
아시아태평양이 세계의 급강도 콘크리트 수요 증가를 이끌 것으로 예상
- 2022년 세계의 조강 콘크리트 수요는 전년 대비 4만 9,000입방미터 이상 증가했습니다. 그러나 동시기 아시아태평양 수요는 320만 입방미터 감소했습니다. 2023년 세계 수요는 전년 대비 830만 입방미터 증가로 추정됩니다. 게다가 수요가 가장 크게 증가하는 것은 중동 및 아프리카로 약 130만 입방미터 증가가 전망됩니다.
- 아시아태평양은 건설 프로젝트가 가장 많기 때문에 세계 최대의 급강도 콘크리트 소비국입니다. 예를 들어, 인프라 부문은 2022년 전 세계 인프라 부문 수요의 42%를 차지했습니다. 중국은 이 지역 최대 소비국입니다. 2022년에는 이 지역 총 수요의 약 77%를 차지했습니다.
- 아시아태평양에 이어 세계적으로 수요가 많은 것은 유럽으로, 이는 러시아, 독일, 이탈리아, 프랑스 등 경제대국에서 사회경제의 지속가능성을 지원하기 위해 이러한 건설자재를 많이 사용하고 있기 때문입니다. 이 지역에서는 인프라 부문이 가장 높은 수요를 창출하고 있습니다. 예를 들어, 2022년에는 이 부문의 수량 점유율이 총 수요의 70%를 차지했습니다.
- 아시아태평양은 예측 기간 동안 수량 기준으로 CAGR 4.67%를 기록하여 세계에서 가장 빠르게 성장하는 급강도 콘크리트 소비자가 될 것으로 예상됩니다. 이는 인도네시아, 인도, 베트남, 한국 등 국가 수요가 가장 급성장할 것으로 추정되기 때문입니다. 예를 들어 인도네시아와 인도 수요는 예측 기간 동안 각각 수량으로 CAGR 6.1%와 5.48%로 증가할 가능성이 높습니다.
세계의 조강 콘크리트 시장 동향
아시아태평양의 대규모 오피스 빌딩 건설 프로젝트의 급증으로 세계 상업 건축 전용 바닥 면적이 증가합니다.
- 2022년 세계 상업 건축용 신규 바닥면적은 전년 대비 0.15%의 소폭 성장이 되었습니다. 유럽은 2030년 이산화탄소 배출 목표에 맞추어 에너지 효율적인 오피스 빌딩을 추진하는 움직임이 원동력이 되고 있습니다. 직원의 사무실 복귀에 따라 유럽 기업은 임대 계약을 재개하고 2022년에는 450만 평방 피트의 신규 오피스 건설에 박차를 가했습니다. 이 기세는 2023년에도 계속되어 세계 성장률은 4.26%로 예측되고 있습니다.
- COVID-19의 유행은 노동력과 자재 부족을 일으켜 상업시설 건설 프로젝트의 취소와 지연을 초래했습니다. 그러나 폐쇄가 완화되고 건설활동이 재개됨에 따라 2021년 세계 상업시설의 신규 바닥면적은 11.11% 급증하고 아시아태평양이 20.98%의 성장률로 선도했습니다.
- 향후 세계 상업시설의 신규 바닥면적의 CAGR은 4.56%가 됩니다. 아시아태평양의 CAGR은 5.16%로 예측되며 다른 지역을 능가할 것으로 예상됩니다. 이 성장의 원동력이 되고 있는 것은 중국, 인도, 한국, 일본에 있어서의 상업시설 건설 프로젝트의 활성화입니다. 특히 베이징, 상하이, 홍콩, 타이베이 등 중국의 주요 도시에서는 A급 사무실 공간 건설이 가속화되고 있습니다. 또한 인도에서는 2023년부터 2025년까지 상위 7개 도시에서 약 2,325만 평방 피트에 이르는 약 60개의 쇼핑몰이 오픈할 예정입니다. 아시아태평양 전역의 이러한 노력을 합산하면 2030년까지 상업시설의 신규 바닥면적은 2022년 대비 15억 6,000만 평방피트 증가할 것으로 예상됩니다.
세계 주택 부문을 뒷받침하는 저렴한 주택 계획에 대한 정부 투자 증가로 남미 주택 건설이 가장 빠르게 성장할 것으로 추정됩니다.
- 2022년 세계 주택건축의 신규 바닥면적은 2021년 대비 약 2억 8,900만 평방피트 감소했습니다. 이는 토지 부족, 노동력 부족, 건축자재 가격의 지속 불가능한 급등으로 인한 주택 위기 때문입니다. 이 위기는 아시아태평양에 심각한 영향을 미쳤으며, 2022년 신규 바닥면적은 2021년 대비 5.39% 감소했습니다. 그러나 2023년에는 2030년까지 30억 명을 수용할 수 있는 저렴한 주택을 새로 건설하기 위한 자금을 조달할 수 있는 정부 투자로 세계 신규 바닥면적은 2022년 대비 3.31% 증가할 것으로 예측되어 보다 밝은 전망이 기대됩니다.
- COVID-19의 유행은 경기 감속을 일으켜, 그 때문에 많은 주택 건설 프로젝트가 중지 또는 연기되어 2020년 세계의 신규 바닥면적은 2019년에 비해 4.79% 감소했습니다. 2021년에 규제가 해제되어 주택 프로젝트에 대한 우울한 수요가 해방되면서 신규 바닥면적은 2020년 대비 11.22% 증가했으며, 유럽이 18.28%로 가장 높은 성장세를 보였으며, 남미가 2021년에 2020년 대비 17.36% 증가했습니다.
- 세계의 주택용 신규 바닥면적은 예측 기간 동안 CAGR 3.81%로 성장을 지속할 전망이며, 남미가 가장 빠른 CAGR 4.05%로 발전할 것으로 예측됩니다. 2023년에 발표된 브라질의 Minha Casa Minha Vida와 같은 계획 및 이니셔티브는 몇 가지 규제 변경과 함께 발표되었으며 정부는 저소득 가구에 저렴한 주택을 제공하기 위해 19억 8,000만 달러의 투자를 계획하고 있으며, 2023년에 발표된 칠레의 FOGA에서 저렴 한 주택을 위해 가족에게 주택 융자를 제공하는 것을 목표로 하고 새로운 주택 단위의 건설을 촉진합니다.
조강 콘크리트 산업 개요
조강 콘크리트 시장은 세분화되어 상위 5개사에서 12.81%를 차지하고 있습니다. 이 시장의 주요 기업은 CEMEX, SAB de CV, CRH, Heidelberg Materials, Holcim, UltraTech Cement Ltd입니다.
기타 혜택
- 엑셀 형식 시장 예측(ME) 시트
- 애널리스트에 의한 3개월간의 지원
목차
제1장 주요 요약 및 주요 조사 결과
제2장 보고서 제안
제3장 서문
- 조사 전제조건 및 시장 정의
- 조사 범위
- 조사 방법
제4장 주요 산업 동향
- 최종 용도 부문의 동향
- 상업
- 산업 및 시설
- 인프라
- 주택용
- 주요 인프라 프로젝트(현재로 발표됨)
- 규제 프레임워크
- 밸류체인 및 유통채널 분석
제5장 시장 세분화(시장 규모, 예측, 성장 전망 분석 포함)(-2030년)
- 최종 용도별
- 상업
- 산업 및 시설
- 인프라
- 주택용
- 지역별
- 아시아태평양
- 국가별
- 호주
- 중국
- 인도
- 인도네시아
- 일본
- 말레이시아
- 한국
- 태국
- 베트남
- 기타 아시아태평양
- 유럽
- 국가별
- 프랑스
- 독일
- 이탈리아
- 러시아
- 스페인
- 영국
- 기타 유럽
- 중동 및 아프리카
- 국가별
- 사우디아라비아
- 아랍에미리트(UAE)
- 기타 중동 및 아프리카
- 북미
- 국가별
- 캐나다
- 멕시코
- 미국
- 남미
- 국가별
- 아르헨티나
- 브라질
- 기타 남미
- 아시아태평양
제6장 경쟁 구도
- 주요 전략 동향
- 시장 점유율 분석
- 기업 상황
- 기업 프로파일
- Breedon Group plc
- CEMEX, SAB de CV
- CRH
- Heidelberg Materials
- Holcim
- SAMPYO GROUP
- Thomas Concrete Group
- UltraTech Cement Ltd.
- Vulcan Materials Company
- Westbuild
제7장 CEO에 대한 주요 전략적 질문
제8장 부록
- 세계 개요
- 개요
- Porter's Five Forces 분석 프레임워크(산업 매력도 분석)
- 세계의 밸류체인 분석
- 시장 역학(DROs)
- 정보원 및 참고문헌
- 도표 일람
- 주요 인사이트
- 데이터 팩
- 용어집
The Rapid Strength Concrete Market size is estimated at 104.39 million Cubic meters in 2024, and is expected to reach 134.72 million Cubic meters by 2030, growing at a CAGR of 4.34% during the forecast period (2024-2030).
Global infrastructure spending is expected to reach USD 3.15 trillion by 2030, and it is likely to drive the demand for rapid-strength concrete
- In 2022, global consumption of rapid-strength concrete saw a modest increase of 0.05% from the previous year, primarily driven by heightened demand from the infrastructure construction sector. Notably, infrastructure spending worldwide rose by 2.03% in 2022 compared to the previous year. 2023 was projected to witness a significant surge in global rapid-strength concrete, with an estimated growth rate of 9.12%.
- Infrastructure emerges as the dominant end-user for rapid-strength concrete, accounting for a substantial 63.66 million cubic meters in 2023. Forecasts indicate this figure is set to climb to 90.47 million cubic meters by 2030. The escalating infrastructure spending, which is anticipated to reach a staggering USD 3.15 trillion by 2030, is poised to further bolster the rapid-strength concrete market. Notably, government-backed projects like highways, bridges, airports, and buildings are driving this demand, necessitating large volumes of top-notch concrete to meet stringent quality and timeline requirements.
- Among the sectors, residential construction is poised for the highest growth trajectory, with a projected CAGR of 6% during the forecast period. Factors such as urbanization, government initiatives, and both foreign and domestic investments are fueling the demand for housing. For instance, Germany is set to add a minimum of 4.0 thousand new housing units by 2024, while the Malaysian government has ambitious plans to construct around 500 thousand affordable housing units by 2025. Consequently, the residential sector's demand for rapid-strength concrete is expected to surge by 3.72 million cubic meters by 2030, compared to the 2023 figures.
Asia-Pacific is expected to lead the growth in demand for rapid-strength concrete globally
- The global rapid-strength concrete demand in 2022 was over 49 thousand cubic meters more compared to the previous year. However, Asia-Pacific's demand was lower by 3.2 million cubic meters in the same period. In 2023, the global demand was estimated to be 8.3 million cubic meters more than the previous year. Moreover, the most significant increase of about 1.3 million cubic meters in demand will likely occur in the Middle East & Africa.
- Asia-Pacific is the largest consumer of rapid-strength concrete in the world because it experiences the highest volume of construction projects. For instance, its infrastructure sector accounted for 42% of the world's overall infrastructure sector's demand in 2022. China is the largest consumer in the region. In 2022, it had a volume share of about 77% of the region's total demand.
- After Asia-Pacific, Europe accounts for the most demand globally due to countries such as Russia, Germany, Italy, and France, which are some of the largest economies and make extensive use of such construction materials to support their socioeconomic sustainability. The infrastructure sector generates the highest demand in the region. For instance, in 2022, the sector had a volume share of 70% of the total demand.
- Asia-Pacific is expected to be the fastest-growing consumer of rapid-strength concrete in the world, with a CAGR of 4.67% in volume during the forecast period. This is because one of the fastest growths in demand for the product is estimated from countries like Indonesia, India, Vietnam, and South Korea. For instance, the demand in Indonesia and India will likely increase at the CAGRs of 6.1% and 5.48% in volume, respectively, during the forecast period.
Global Rapid Strength Concrete Market Trends
Asia-Pacific's surge in large-scale office building projects is set to elevate the global floor area dedicated to commercial construction
- In 2022, the global new floor area for commercial construction witnessed a modest growth of 0.15% from the previous year. Europe stood out with a significant surge of 12.70%, driven by a push for high-energy-efficient office buildings to align with its 2030 carbon emission targets. As employees returned to offices, European companies, resuming lease decisions, spurred the construction of 4.5 million square feet of new office space in 2022. This momentum is poised to persist in 2023, with a projected global growth rate of 4.26%.
- The COVID-19 pandemic caused labor and material shortages, leading to cancellations and delays in commercial construction projects. However, as lockdowns eased and construction activities resumed, the global new floor area for commercial construction surged by 11.11% in 2021, with Asia-Pacific taking the lead with a growth rate of 20.98%.
- Looking ahead, the global new floor area for commercial construction is set to achieve a CAGR of 4.56%. Asia-Pacific is anticipated to outpace other regions, with a projected CAGR of 5.16%. This growth is fueled by a flurry of commercial construction projects in China, India, South Korea, and Japan. Notably, major Chinese cities like Beijing, Shanghai, Hong Kong, and Taipei are gearing up for an uptick in Grade A office space construction. Additionally, India is set to witness the opening of approximately 60 shopping malls, spanning 23.25 million square feet, in its top seven cities between 2023 and 2025. Collectively, these endeavors across Asia-Pacific are expected to add a staggering 1.56 billion square feet to the new floor area for commercial construction by 2030, compared to 2022.
South America's estimated fastest growth in residential constructions due to increasing government investments in schemes for affordable housing to boost the global residential sector
- In 2022, the global new floor area for residential construction declined by around 289 million square feet compared to 2021. This can be attributed to the housing crisis generated due to the shortage of land, labor, and unsustainably high construction materials prices. This crisis severely impacted Asia-Pacific, where the new floor area declined 5.39% in 2022 compared to 2021. However, a more positive outlook is expected in 2023 as the global new floor area is predicted to grow by 3.31% compared to 2022, owing to government investments that can finance the construction of new affordable homes capable of accommodating 3 billion people by 2030.
- The COVID-19 pandemic caused an economic slowdown, due to which many residential construction projects got canceled or delayed, and the global new floor area declined by 4.79% in 2020 compared to 2019. As the restrictions were lifted in 2021 and pent-up demand for housing projects was released, new floor area grew 11.22% compared to 2020, with Europe having the highest growth of 18.28%, followed by South America, which rose 17.36% in 2021 compared to 2020.
- The global new floor area for residential construction is expected to register a CAGR of 3.81% during the forecast period, with South America predicted to develop at the fastest CAGR of 4.05%. Schemes and initiatives like the Minha Casa Minha Vida in Brazil announced in 2023 with a few regulatory changes, for which the government plans an investment of USD 1.98 billion to provide affordable housing units for low-income families, and the FOGAES in Chile also publicized in 2023, with an initial investment of USD 50 million, are aimed at providing mortgage loans to families for affordable housing and will encourage the construction of new residential units.
Rapid Strength Concrete Industry Overview
The Rapid Strength Concrete Market is fragmented, with the top five companies occupying 12.81%. The major players in this market are CEMEX, S.A.B. de C.V., CRH, Heidelberg Materials, Holcim and UltraTech Cement Ltd. (sorted alphabetically).
Additional Benefits:
- The market estimate (ME) sheet in Excel format
- 3 months of analyst support
TABLE OF CONTENTS
1 EXECUTIVE SUMMARY & KEY FINDINGS
2 REPORT OFFERS
3 INTRODUCTION
- 3.1 Study Assumptions & Market Definition
- 3.2 Scope of the Study
- 3.3 Research Methodology
4 KEY INDUSTRY TRENDS
- 4.1 End Use Sector Trends
- 4.1.1 Commercial
- 4.1.2 Industrial and Institutional
- 4.1.3 Infrastructure
- 4.1.4 Residential
- 4.2 Major Infrastructure Projects (current And Announced)
- 4.3 Regulatory Framework
- 4.4 Value Chain & Distribution Channel Analysis
5 MARKET SEGMENTATION (includes market size, forecasts up to 2030 and analysis of growth prospects.)
- 5.1 End Use Sector
- 5.1.1 Commercial
- 5.1.2 Industrial and Institutional
- 5.1.3 Infrastructure
- 5.1.4 Residential
- 5.2 Region
- 5.2.1 Asia-Pacific
- 5.2.1.1 By Country
- 5.2.1.1.1 Australia
- 5.2.1.1.2 China
- 5.2.1.1.3 India
- 5.2.1.1.4 Indonesia
- 5.2.1.1.5 Japan
- 5.2.1.1.6 Malaysia
- 5.2.1.1.7 South Korea
- 5.2.1.1.8 Thailand
- 5.2.1.1.9 Vietnam
- 5.2.1.1.10 Rest of Asia-Pacific
- 5.2.2 Europe
- 5.2.2.1 By Country
- 5.2.2.1.1 France
- 5.2.2.1.2 Germany
- 5.2.2.1.3 Italy
- 5.2.2.1.4 Russia
- 5.2.2.1.5 Spain
- 5.2.2.1.6 United Kingdom
- 5.2.2.1.7 Rest of Europe
- 5.2.3 Middle East and Africa
- 5.2.3.1 By Country
- 5.2.3.1.1 Saudi Arabia
- 5.2.3.1.2 United Arab Emirates
- 5.2.3.1.3 Rest of Middle East and Africa
- 5.2.4 North America
- 5.2.4.1 By Country
- 5.2.4.1.1 Canada
- 5.2.4.1.2 Mexico
- 5.2.4.1.3 United States
- 5.2.5 South America
- 5.2.5.1 By Country
- 5.2.5.1.1 Argentina
- 5.2.5.1.2 Brazil
- 5.2.5.1.3 Rest of South America
- 5.2.1 Asia-Pacific
6 COMPETITIVE LANDSCAPE
- 6.1 Key Strategic Moves
- 6.2 Market Share Analysis
- 6.3 Company Landscape
- 6.4 Company Profiles
- 6.4.1 Breedon Group plc
- 6.4.2 CEMEX, S.A.B. de C.V.
- 6.4.3 CRH
- 6.4.4 Heidelberg Materials
- 6.4.5 Holcim
- 6.4.6 SAMPYO GROUP
- 6.4.7 Thomas Concrete Group
- 6.4.8 UltraTech Cement Ltd.
- 6.4.9 Vulcan Materials Company
- 6.4.10 Westbuild
7 KEY STRATEGIC QUESTIONS FOR CONCRETE, MORTARS AND CONSTRUCTION CHEMICALS CEOS
8 APPENDIX
- 8.1 Global Overview
- 8.1.1 Overview
- 8.1.2 Porter's Five Forces Framework (Industry Attractiveness Analysis)
- 8.1.3 Global Value Chain Analysis
- 8.1.4 Market Dynamics (DROs)
- 8.2 Sources & References
- 8.3 List of Tables & Figures
- 8.4 Primary Insights
- 8.5 Data Pack
- 8.6 Glossary of Terms
