
|
시장보고서
상품코드
1683431
미국의 생물촉진제 시장 : 시장 점유율 분석, 산업 동향, 성장 예측(2025-2030년)United States Biostimulants - Market Share Analysis, Industry Trends & Statistics, Growth Forecasts (2025 - 2030) |
||||||
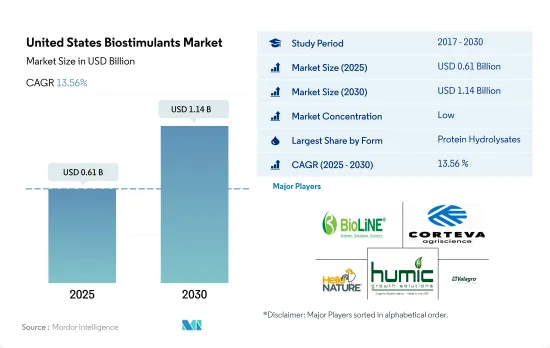
미국의 생물촉진제 시장 규모는 2025년 6억 1,000만 달러로 추정되고, 2030년에는 11억 4,000만 달러에 이를 것으로 예측되며, 예측 기간 중(2025-2030년) CAGR 13.56%를 나타낼 것으로 예측됩니다.

- 미국의 생물촉진제 시장은 푸민산과 플루보산, 아미노산, 단백질 가수분해물, 해초 추출물, 유기 식물 및 동물 유래의 기타 생물촉진제 등 많은 유효성분으로 구성되어 있습니다.
- 미국의 생물촉진제 시장에서는 단백질 가수분해물이 가장 높은 점유율을 차지했으며, 2022년에는 37.3%의 점유율을 획득했습니다. 2022년 시장 규모는 1억 5,550만 달러로 소비량은 1만 4,300톤이었습니다. 단백질 가수분해물을 사용함으로써 농작물과 원예작물의 수율과 품질 형질을 향상시킬 수 있기 때문에 높은 점유율로 이어지고 있습니다.
- 부식산이 단백질 가수분해물에 이어 2022년 시장 점유율은 27.6%였습니다. 부식산은 콩, 밀, 쌀, 옥수수와 같은 작물, 감자, 토마토, 오이, 고추와 같은 야채 작물, 감귤류(Citrus limon) 및 포도(Vitis vinifera)와 같은 과일 작물의 뿌리 시스템을 개선하는 데 도움이 됩니다.
- 농작물의 유기 재배 면적이 최대였고, 생물촉진제 소비량의 대부분, 즉 2022년에는 71.4%를 차지했습니다. 이 작물에 이어지는 것은 원예작물과 환금작물로, 같은 해의 점유율은 각각 27.5%와 1.1%였습니다.
- 다양한 작물에 대한 잠재적인 긍정적 효과가 과학 문헌에서 보고되었음에도 불구하고, 감귤류와 딸기와 같은 상업 재배 작물과 토마토와 고추와 같은 야채에 대한 생명력의 효과에 대한 지식은 특히 플로리다와 캘리포니아와 같은 대부분의 국가입니다.
- 유기농 제품에 대한 수요 증가, 농업 진보, 농업에서의 바이오 자원 이용 증가, 정부 지원 시책 등이 미국의 생물촉진제 시장을 견인하고 있습니다.
미국 생물촉진제 시장 동향
국가의 법규제별, 특히 연작작물에서의 유기재배면적 증가
- 2021년 미국의 유기농업 재배면적은 62만 3,000헥타르였습니다. 미국의 유기농업은 지난 20년간 상당히 증가했지만, 대부분은 특정 법률과 규정의 도입으로 인한 것입니다. 캘리포니아의 유기농 농장과 목장의 수는 2021년에는 3,061이었으며 미국에서 가장 많은 유기 인증 농장이 있었습니다. 펜실베니아에는 1,125개 이상의 유기농 농장이 있었습니다. 2019년에 가동한 인증 유기농장은 1,554만 8,000농장 가까이가 작물을 재배하고, 713만 9,000 농장이 목초지와 방목지를 운영하고 있었습니다. 묘목과 온실에서 온 것을 포함한 작물의 판매액은 거의 58억 달러에 달했습니다.
- 미국 유기농업은 경작작물로 점유되고 있습니다. 2021년에는 유기농지 전체의 약 71.8%를 차지했습니다. 곡류 생산은 이 나라의 농업 부문의 대부분을 차지하고 있습니다. 주요 곡물에는 옥수수, 밀, 쌀, 기장 등이 있습니다. 유기농 제품의 소비는 다양한 건강상의 이점에서 유기농 식품을 선택하는 미국 소비자들 사이에서 인기가 있습니다.
- 유기 원예 작물 전체의 재배 면적은 증가 경향에 있으며, 2017년의 11만 2,900헥타르에서 2021년에는 15만 6,100헥타르가 됐습니다. 2021년 국내 생산의 경우 과일 및 채소의 상위 5개 품목은 사과(31.1%), 딸기(9.5%), 오렌지(6.9%), 로메인 상추(6.7%), 감자(6.2%)였습니다. 무역의 경우 수입이 많은 것은 바나나(53.1%), 아보카도(7.7%), 망고(5.8%), 블루베리(5.0%), 호박(4.3%), 수출이 많은 것은 사과(80.0%), 배(14.4%), 체리(4.0%), 마른 양파(1.5%), 감자(0.2%) 순이었습니다.
과일·야채 부문을 중심으로 하는 유기농산물에 대한 수요 증가, 유기식품에 대한 1인당 지출액 증가
- 미국은 세계 최대 유기 제품 소비국 중 하나입니다. Nutrition Business Journal(NBJ, 2021년)에 따르면 2020년 시점에서 일본의 유기농 식품의 총 매출은 516억 달러를 차지하고 있습니다. 미국은 북미에서 유기농 제품에 대한 1인당 지출이 가장 크고 2021년에는 186.7달러에 해당했습니다.
- 유기농 신선한 과일 및 채소는 유기농 식품 소매 산업의 설립 이래 유기농 식품의 주요 카테고리가되었습니다. 2020년에는 이러한 유기 제품의 소매 매출액이 200억 달러로 평가되었으며 유기농 농산물에 대한 수요가 증가하고 있습니다. 유기농 신선한 과일 및 채소에 대한 수요는 지난 20년간 꾸준히 증가하고 있습니다. 유기농 식품의 매출이 증가하고 있는 것은 특히 고소득층의 소비자 의식이 높아지기 때문입니다. 가장 수요가 높은 유기농 식품 카테고리에는 계란, 유제품, 과일, 야채와 같은 기본 식품이 포함됩니다.
- 유기농 식품의 기호는 인구층과 지역에 따라 다릅니다. 18-29세의 젊은층은 65세 이상의 고령층에 비해 유기농 제품을 요구하는 경향이 강합니다(50% 초과). 소득과 지역도 관련되어 있으며, 소득이 3만 달러 이하인 사람의 42%, 7만 5,000 USD 이상의 사람의 49%가 유기농 제품을 요구하고 있습니다.
- 유기농 제품에 대한 1인당 지출은 미국에서 증가하고 있으며 2017-2021년까지 CAGR 5.2%로 성장을 지속하고, 있습니다. 유기농 제품에 대한 수요가 증가함에 따라 미국의 유기농 생산자가 국내외 고가치 시장을 개척할 기회를 창출하고 있습니다. 유기 제품과 관련된 가격 프리미엄은 저소득층 소비자들에게 유기농 식품 소비의 주요 제한 요인 중 하나입니다.
미국 생물촉진제 산업 개요
미국의 생물촉진제 시장은 부문화되어 상위 5개사에서 6.66%를 차지하고 있습니다. 이 시장의 주요 기업은 BioLine Corporation, Corteva Agriscience, Hello Nature USA Inc., Humic Growth Solutions Inc., Valagro USA입니다.
기타 혜택
- 엑셀 형식 시장 예측(ME) 시트
- 3개월의 애널리스트 서포트
목차
제1장 주요 요약과 주요 조사 결과
제2장 보고서 제안
제3장 소개
- 조사의 전제조건과 시장 정의
- 조사 범위
- 조사 방법
제4장 주요 산업 동향
- 유기 재배 면적
- 1인당 유기농 제품에 대한 지출
- 규제 프레임워크
- 미국
- 밸류체인과 유통채널 분석
제5장 시장 세분화
- 형태
- 아미노산
- 풀브산
- 부식산
- 단백질 가수분해물
- 해초 추출물
- 기타 생물촉진제
- 작물 유형
- 환금작물
- 원예작물
- 밭작물
제6장 경쟁 구도
- 주요 전략적 움직임
- 시장 점유율 분석
- 기업 상황
- 기업 프로파일(세계 수준 개요, 시장 수준 개요, 주요 비즈니스 부문, 재무, 직원 수, 주요 정보, 시장 순위, 시장 점유율, 제품 및 서비스, 최근 동향 분석 포함).
- BioLine Corporation
- Corteva Agriscience
- FBSciences Inc.
- Hello Nature USA Inc.
- Humic Growth Solutions Inc.
- Ocean Organics Corp.
- Plant Response BIoTech Inc.
- Sigma Agriscience LLC
- Symborg Inc.
- Valagro USA
제7장 CEO에 대한 주요 전략적 질문
제8장 부록
- 세계 개요
- 개요
- Porter's Five Forces 분석 프레임워크
- 세계의 밸류체인 분석
- 시장 역학(DROs)
- 정보원과 참고문헌
- 도표 일람
- 주요 인사이트
- 데이터 팩
- 용어집
The United States Biostimulants Market size is estimated at 0.61 billion USD in 2025, and is expected to reach 1.14 billion USD by 2030, growing at a CAGR of 13.56% during the forecast period (2025-2030).
- The biostimulants market in the United States consists of many active ingredients, such as humic and fulvic acids, amino acids, protein hydrolysates, seaweed extracts, and other biostimulants like organic plants and animal derivatives.
- Protein hydrolysates held the highest share in the US biostimulants market, with a share of 37.3% in 2022. The market was valued at USD 155.5 million in 2022, with a consumption volume of 14.3 thousand metric tons. The use of protein hydrolysates can improve yield and quality traits in agricultural and horticultural crops, thus leading to their high share.
- Humic acids followed protein hydrolysates, accounting for a market share of 27.6% in 2022. Humic acids help improve the root system of crops such as soybean, wheat, rice, and maize; vegetable crops such as potato, tomato, cucumber, and pepper; and fruit crops such as citrus (Citrus limon) and grape (Vitis vinifera).
- The field crops held the maximum area under organic cultivation and accounted for a significant share of biostimulant consumption, i.e., 71.4% in 2022. These crops were followed by horticultural and cash crops, with shares of 27.5% and 1.1% in the same year, respectively.
- Despite the potentially positive effects on different crops reported in the scientific literature, there is little knowledge regarding biostimulant effects on commercially grown crops like citrus and strawberry and vegetables like tomato and capsicum, particularly in many states of the country, like Florida and California.
- The growing demand for organic products, the advancement of the agricultural industry, the increasing use of bio-based resources in farming, and supportive government policies drive the US market for biostimulants.
United States Biostimulants Market Trends
Increase in organic area, particularly in row crops, due to country's laws and regulations
- In 2021, the area under organic agricultural farming in the United States was 623 thousand hectares. Organic agriculture in the United States has increased significantly in the previous 20 years, mostly due to the introduction of particular laws and regulations. The number of organic farms and ranches in California was 3,061 in 2021, the largest number of certified organic farms in the United States. There were over 1,125 certified organic farms in Pennsylvania. Nearly 15,548 thousand certified organic farms in operation used cropland in 2019, while 7,139 thousand farms operated pastureland and rangeland. The sales value of crops, including those from nurseries and greenhouses, amounted to nearly USD 5.8 billion.
- Row crops dominated organic farming in the nation. In 2021, they accounted for about 71.8% of all organic cropland. The production of cereal crops predominates the country's agricultural sector. The main cereals include maize, wheat, rice, and millet. The consumption of organic products has become popular among US consumers who increasingly choose to eat organic foods because of their various health benefits.
- There is an increasing trend in the overall organic horticultural crop cultivation area, from 112.9 thousand hectares in 2017 to 156.1 thousand hectares in 2021. Regarding domestic production in 2021, the top five fruits and vegetables were apples (31.1%), strawberries (9.5%), oranges (6.9%), romaine lettuce (6.7%), and potatoes (6.2%). In the case of trade, the most imported produce was bananas (53.1%), avocados (7.7%), mangoes (5.8%), blueberries (5.0%), and squashes (4.3%), while the most exported were apples (80.0%), pears (14.4%), cherries (4.0%), dried onions (1.5%), and potatoes (0.2%).
Growing demand for organic produce especially in the fruits and vegetables sector, rise in per capita spending on organic food
- The United States is one of the largest organic product consumers in the world. As of 2020, the total sales of organic food products in the country accounted for USD 51.6 billion, according to the Nutrition Business Journal (NBJ, 2021). The United States had the largest per capita spending on organic products in the North American region, worth USD 186.7 in 2021.
- Organic fresh fruits and vegetables have been the leading category of organic food since the establishment of the organic food retail industry. In 2020, retail sales for these organic products were valued at USD 20.0 billion, showing a growing demand for organic produce. The demand for organic fresh fruits and vegetables has steadily risen over the past two decades. Organic food sales are rising due to growing consumer awareness, especially among high-income consumers. The most in-demand organic categories include basic foods like eggs, dairy, fruits, and vegetables.
- Organic food preferences vary by demographic and region. Younger people aged between 18 and 29 are more likely to seek organic products (over 50%) compared to older people aged 65 and above. Income and region also play a role, with 42% of those with under USD 30,000 income and 49% of those with over USD 75.0 thousand seeking organic products.
- The per capita spending on organic products is increasing in the country, recording a CAGR of 5.2% between 2017 and 2021. The growing demand for organic products is creating opportunities for US organic producers to tap into high-value markets both domestically and abroad. The price premium associated with organic products is one of the major limiting factors for organic food consumption for low-income consumers.
United States Biostimulants Industry Overview
The United States Biostimulants Market is fragmented, with the top five companies occupying 6.66%. The major players in this market are BioLine Corporation, Corteva Agriscience, Hello Nature USA Inc., Humic Growth Solutions Inc. and Valagro USA (sorted alphabetically).
Additional Benefits:
- The market estimate (ME) sheet in Excel format
- 3 months of analyst support
TABLE OF CONTENTS
1 EXECUTIVE SUMMARY & KEY FINDINGS
2 REPORT OFFERS
3 INTRODUCTION
- 3.1 Study Assumptions & Market Definition
- 3.2 Scope of the Study
- 3.3 Research Methodology
4 KEY INDUSTRY TRENDS
- 4.1 Area Under Organic Cultivation
- 4.2 Per Capita Spending On Organic Products
- 4.3 Regulatory Framework
- 4.3.1 United States
- 4.4 Value Chain & Distribution Channel Analysis
5 MARKET SEGMENTATION (includes market size in Value in USD and Volume, Forecasts up to 2030 and analysis of growth prospects)
- 5.1 Form
- 5.1.1 Amino Acids
- 5.1.2 Fulvic Acid
- 5.1.3 Humic Acid
- 5.1.4 Protein Hydrolysates
- 5.1.5 Seaweed Extracts
- 5.1.6 Other Biostimulants
- 5.2 Crop Type
- 5.2.1 Cash Crops
- 5.2.2 Horticultural Crops
- 5.2.3 Row Crops
6 COMPETITIVE LANDSCAPE
- 6.1 Key Strategic Moves
- 6.2 Market Share Analysis
- 6.3 Company Landscape
- 6.4 Company Profiles (includes Global Level Overview, Market Level Overview, Core Business Segments, Financials, Headcount, Key Information, Market Rank, Market Share, Products and Services, and Analysis of Recent Developments).
- 6.4.1 BioLine Corporation
- 6.4.2 Corteva Agriscience
- 6.4.3 FBSciences Inc.
- 6.4.4 Hello Nature USA Inc.
- 6.4.5 Humic Growth Solutions Inc.
- 6.4.6 Ocean Organics Corp.
- 6.4.7 Plant Response Biotech Inc.
- 6.4.8 Sigma Agriscience LLC
- 6.4.9 Symborg Inc.
- 6.4.10 Valagro USA
7 KEY STRATEGIC QUESTIONS FOR AGRICULTURAL BIOLOGICALS CEOS
8 APPENDIX
- 8.1 Global Overview
- 8.1.1 Overview
- 8.1.2 Porter's Five Forces Framework
- 8.1.3 Global Value Chain Analysis
- 8.1.4 Market Dynamics (DROs)
- 8.2 Sources & References
- 8.3 List of Tables & Figures
- 8.4 Primary Insights
- 8.5 Data Pack
- 8.6 Glossary of Terms
