


|
시장보고서
상품코드
1683818
아라미드 : 시장 점유율 분석, 산업 동향과 통계, 성장 예측(2025-2030년)Aramids - Market Share Analysis, Industry Trends & Statistics, Growth Forecasts (2025 - 2030) |
||||||
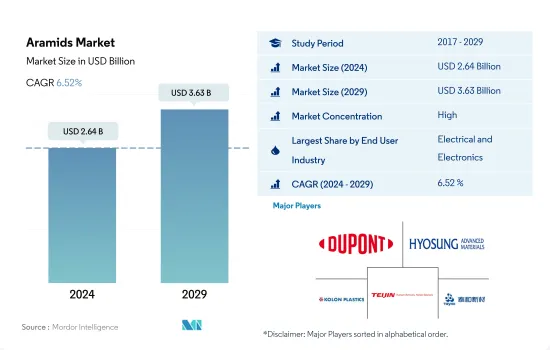
아라미드 시장 규모는 2024년에 26억 4,000만 달러로 평가되었습니다. 2029년에는 36억 3,000만 달러에 이를 것으로 예상되며, 예측 기간(2024-2029년)의 CAGR은 6.52%를 나타낼 것으로 전망됩니다.
시장을 견인하는 전기 및 전자산업에서의 수요 증가
- 아라미드는 아미드 결합을 85% 이상 포함하는 폴리아미드의 서브레진입니다. 경량, 고강도, 고탄성률, 고온 내성, 우수한 내식성으로 알려져 있습니다. 2022년 소비량은 2021년 대비 9.91% 증가로 가장 많았는데, 이는 주로 자동차와 산업기계의 최종사용자 산업 부문으로부터 수요가 대폭 증가했기 때문입니다.
- 전기 및 전자 산업은 아라미드에 가장 큰 최종 사용자 분야입니다. 강인하고 내열성이 높은 전기 절연재, 전자기기의 특정 부품, 주로 바인더로서의 광섬유나 케이블 보강재 등의 용도에 매우 바람직한 재료입니다. 이러한 업계의 높은 수요는 인터넷의 보급, 사용 편의성, 신뢰성으로 인한 것이며, 이들은 최근 극적으로 증가하고 있으며 광섬유 케이블 시장을 세계적으로 활성화하고 있습니다. 아라미드 섬유 수요는 전기 및 전자산업에서 가장 빠른 속도로 성장할 것으로 예상되며 예측기간(2023-2029년)의 CAGR은 금액 기준으로 8.4%를 나타낼 것으로 추정됩니다.
- 자동차 산업은 아라미드 시장에서 두 번째로 큰 분야이며 점유율은 약 26%입니다. 그 주된 이유는 고강도, 저연소성, 내마모성·내유기 용제성이라고 하는 특성에 있습니다. 이러한 특성으로 인해 아라미드는 자동차 호스, 벨트, 타이어 보강, 변속기 상자, 브레이크 시스템, 차량 장갑, 에어백 등의 용도에 매우 유용합니다. 롤링 저항, 에너지 사용량 및 배출량 감소는 자동차 최종 사용자 산업 부문에서 아라미드가 제공하는 큰 장점이며, 예측 기간(2023-2029년)의 CAGR은 금액 기준으로 6.08%를 나타낼 것으로 예상됩니다.
아프리카 가전산업이 시장 확대를 견인
- 아라미드는 자동차 및 전기 및 전자 기기 최종 사용자 산업에서 주로 사용됩니다. 난연성, 경량성, 고강도, 내식성 등의 특성으로 인해 이러한 산업에 매우 바람직한 재료가 되었습니다. 2022년 아라미드의 세계 수요는 수량 기준으로 전년대비 9.19% 증가했습니다.
- 아시아태평양은 아라미드 제품에 가장 크고 수익성이 높은 지역으로 2022년 소비 점유율은 74%를 차지했습니다. 현재 중국과 일본이 가장 큰 소비국이지만, 이는 주로 자동차, 전기 및 전자기기, 산업기계의 최종 이용 산업 부문에 기인하고 있습니다. 인도에서는 정부의 주도로 전기 및 전자제품의 생산이 증가하고 있으며, 이 지역 부문이 예측기간 동안 수량 기준으로 최고의 CAGR 11.25%를 기록하여 시장을 선도할 것으로 예상됩니다.
- 유럽은 두 번째로 큰 지역 시장이며, 아라미드 시장의 주요 최종 사용자 산업은 전기 및 전자 기기 및 자동차입니다. 유럽 시장의 대부분은 독일, 이탈리아, 프랑스 등의 국가들이 차지하고 있으며, 2022년의 소비 점유율은 50%에 달했습니다. 프랑스와 영국이 각각의 항공우주산업에 대한 지출을 늘리고 있는 것이 이 지역 시장 성장을 견인하고 예측기간 중 수량 기준 CAGR은 각각 6.83%와 6.92%가 될 것으로 예상됩니다.
- 중동은 아라미드의 소비지로서 가장 급성장하고 있습니다. 예측기간 중에 금액 기준으로 CAGR 8.69%를 기록할 가능성이 높지만, 이는 전기 및 전자산업과 항공우주산업이 성장하고 있기 때문에 각각 CAGR 11.47%, 8.77%를 나타낼 것으로 예상됩니다.
세계의 아라미드 시장 동향
전자 산업의 기술 진보가 성장을 가속할 가능성
- 전자제품에 있어서의 기술 혁신의 급속한 페이스가 새롭고 고속의 전기 및 전자제품에 대한 일관된 수요를 촉진하고 있습니다. 2022년 전기 및 전자제품의 세계 매출은 5조 8,070억 달러로, 아시아태평양이 74% 시장 점유율을 차지한 다음 유럽이 13%의 점유율을 차지했습니다. 세계의 전기 및 전자기기 시장은 예측 기간 동안 CAGR 6.61%를 나타낼 것으로 예상됩니다.
- 2018년 아시아태평양은 중국, 한국, 일본, 인도 및 ASEAN 국가의 급속한 산업화로 강력한 경제 성장을 보였습니다. 2020년에는 팬데믹의 영향으로 칩 부족이나 공급망의 비효율성으로 인해 세계 전기 및 전자기기 생산이 감속되어 전년대비 0.1%의 증수율에 정체되었습니다. 이 성장의 원동력이 된 것은 팬데믹(세계적 대유행)시에 사람들이 실내 대기를 강요당했기 때문에 원격 워크나 홈 엔터테인먼트용의 가전제품에 대한 수요였습니다.
- 디지털화, 로봇 공학, 가상현실, 증강현실, IoT(사물 인터넷), 5G 연결 등 첨단 기술에 대한 수요는 예측 기간 동안 확대될 것으로 예상됩니다. 세계의 전기 및 전자기기 생산은 2027년 5.9%의 성장률을 나타낼 것으로 예상됩니다. 기술적 진보의 결과, 소비자용 전자 기기 수요는 예측 기간 동안 상승할 것으로 예상됩니다. 예를 들어 세계 소비자 일렉트로닉스 산업의 수익은 2023년 7,191억 달러에 비해 2027년 약 9,046억 달러에 이를 것으로 예측됩니다. 그 결과 예측기간 동안 기술 개발이 전기 및 전자제품 수요를 견인할 것으로 예측됩니다.
아라미드 산업 개요
아라미드 시장은 상당히 통합되어 있으며 상위 5개사에서 84.34%를 차지하고 있습니다. 이 시장 주요 기업은 다음과 같습니다. DuPont, Hyosung Advanced Materials, Kolon Industries, Inc., Teijin Limited and Yantai Tayho Advanced Materials(알파벳순 정렬).
기타 혜택
- 엑셀 형식 시장 예측(ME) 시트
- 3개월의 애널리스트·지원
목차
제1장 주요 요약과 주요 조사 결과
제2장 보고서 제안
제3장 서론
- 조사의 전제조건과 시장 정의
- 조사 범위
- 조사 방법
제4장 주요 산업 동향
- 최종 사용자 동향
- 항공우주
- 자동차
- 건축 및 건설
- 전기 및 전자
- 포장
- 규제 프레임워크
- 아르헨티나
- 호주
- 브라질
- 캐나다
- 중국
- EU
- 인도
- 일본
- 말레이시아
- 멕시코
- 나이지리아
- 러시아
- 사우디아라비아
- 남아프리카
- 한국
- 아랍에미리트(UAE)
- 영국
- 미국
- 밸류체인과 유통채널 분석
제5장 시장 세분화
- 최종 사용자 산업
- 항공우주
- 자동차
- 전기 및 전자
- 산업 및 기계
- 기타 최종 사용자 산업
- 지역
- 아프리카
- 국가별
- 나이지리아
- 남아프리카
- 기타 아프리카
- 아시아태평양
- 국가별
- 호주
- 중국
- 인도
- 일본
- 말레이시아
- 한국
- 기타 아시아태평양
- 유럽
- 국가별
- 프랑스
- 독일
- 이탈리아
- 러시아
- 영국
- 기타 유럽
- 중동
- 국가별
- 사우디아라비아
- 아랍에미리트(UAE)
- 기타 중동
- 북미
- 국가별
- 캐나다
- 멕시코
- 미국
- 남미
- 국가별
- 아르헨티나
- 브라질
- 기타 남미
- 아프리카
제6장 경쟁 구도
- 주요 전략 동향
- 시장 점유율 분석
- 기업 상황
- 기업 프로파일(세계 수준 개요, 시장 수준 개요, 주요 비즈니스 부문, 재무, 직원 수, 주요 정보, 시장 순위, 시장 점유율, 제품 및 서비스, 최근 동향 분석 포함)
- China Petroleum & Chemical Corporation
- DuPont
- Huvis Corp.
- Hyosung Advanced Materials
- JSC "Kamenskvolokno"
- Kolon Industries, Inc.
- Taekwang Industrial Co., Ltd
- Teijin Limited
- X-FIPER New Material Co., Ltd
- Yantai Tayho Advanced Materials Co.,Ltd.
제7장 CEO에 대한 주요 전략적 질문
제8장 부록
- 세계의 개요
- 개요
- Porter's Five Forces 프레임워크(산업 매력도 분석)
- 세계의 밸류체인 분석
- 시장 역학(DROs)
- 정보원과 참고문헌
- 도표 일람
- 주요 인사이트
- 데이터 팩
- 용어집
The Aramids Market size is estimated at 2.64 billion USD in 2024, and is expected to reach 3.63 billion USD by 2029, growing at a CAGR of 6.52% during the forecast period (2024-2029).
Growing demand from the electrical and electronics industry leading the market
- Aramids are sub-resins of polyamide that contain over 85% of an amide bond. They are known for their lightweight, high-strength, high-modulus, high-temperature resistance, and excellent corrosion resistance properties. Their consumption was recorded to be the highest in 2022, with a 9.91% increase in volume over 2021, primarily due to significantly higher demand from the automotive and industrial machinery end-user industry segments.
- The electrical and electronics industry is the largest end-user segment for aramids. It is a highly desirable material for applications such as tough and highly thermal-resistant electrical insulation, certain components in electronics, and primarily in optical fiber and cable reinforcement as a binder. Such high demand from the industry is attributed to the internet's popularity, usability, and dependability, which have increased dramatically over recent years, catalyzing the market for optical fiber cables globally. The demand for aramids is expected to grow at the fastest rate in the electrical and electronics industry, with an anticipated CAGR of 8.4% by value during the forecast period (2023-2029).
- The automotive industry is the second-largest segment of the aramids market, with a share of around 26%. This is owing majorly to properties such as high strength, low flammability, and superior resistance to abrasion and organic solvents. These properties make aramids highly beneficial for applications such as automobile hoses, belts, tire reinforcement, transmission boxes, braking systems, vehicle armor, and airbags. Reductions in rolling resistance, energy usage, and emissions are the significant advantages imparted by aramids in the automotive end-user industry segment, which is projected to register a CAGR of 6.08% by value during the forecast period (2023-2029).
African consumer electronics industry to drive market expansion
- Aramid is majorly used in the automotive and electrical and electronics end-user industries. Its flame resistance, lightweight, high strength, and corrosion resistance properties make it a highly desirable material for these industries. In 2022, the global demand for aramid grew by 9.19% by volume over the previous year.
- Asia-Pacific is the largest and most profitable region for aramid products, accounting for a consumption share of 74% in 2022. China and Japan are currently the largest consumer nations, owing primarily to their automotive, electrical and electronics, and industrial machinery end-use industry segments. Increasing production of electrical and electronic goods under government initiatives in India is also expected to result in the regional segment leading the market with the highest CAGR of 11.25% by volume during the forecast period.
- Europe is the second-largest regional market, and its primary end-user industries in the aramids market are electrical and electronics and automotive. A significant share of the European market is held by countries such as Germany, Italy, and France, resulting in the region accounting for a consumption share of 50% by volume in 2022. The rising expenditure on their respective aerospace industries by France and the United Kingdom is expected to drive market growth in the region, with CAGRs of 6.83% and 6.92%, respectively, by volume during the forecast period.
- Middle East is the fastest-growing consumer for aramids. It is likely to record a CAGR of 8.69% in terms of value during the forecast period, attributed to growing electrical and electronics industry and aerospace industry, which is expected to grow at a CAGR of 11.47% and 8.77% respectively.
Global Aramids Market Trends
Technological advancements in electronics industry may foster the growth
- The rapid pace of technological innovation in electronic products is driving the consistent demand for new and fast electrical and electronic products. In 2022, the global revenue of electrical and electronics stood at USD 5,807 billion, with Asia-Pacific holding a 74% market share, followed by Europe with a 13% share. The global electrical and electronics market is expected to record a CAGR of 6.61% during the forecast period.
- In 2018, the Asia-Pacific region witnessed strong economic growth owing to rapid industrialization in China, South Korea, Japan, India, and ASEAN countries. In 2020, due to the pandemic, there was a slowdown in global electrical and electronics production due to the shortage of chips and inefficiencies in the supply chain, which led to a stagnant growth rate of 0.1% in revenue compared to the previous year. This growth was driven by the demand for consumer electronics for remote working and home entertainment as people were forced to remain indoors during the pandemic.
- The demand for advanced technologies, such as digitalization, robotics, virtual reality, augmented reality, IoT (Internet of Things), and 5G connectivity, is expected to grow during the forecast period. Global electrical and electronics production is expected to register a growth rate of 5.9% in 2027. As a result of technological advancements, the demand for consumer electronics is expected to rise during the forecast period. For instance, the global consumer electronics industry is projected to witness a revenue reach of around USD 904.6 billion in 2027, compared to USD 719.1 billion in 2023. As a result, technological development is projected to lead the demand for electrical and electronic products during the forecast period.
Aramids Industry Overview
The Aramids Market is fairly consolidated, with the top five companies occupying 84.34%. The major players in this market are DuPont, Hyosung Advanced Materials, Kolon Industries, Inc., Teijin Limited and Yantai Tayho Advanced Materials Co.,Ltd. (sorted alphabetically).
Additional Benefits:
- The market estimate (ME) sheet in Excel format
- 3 months of analyst support
TABLE OF CONTENTS
1 EXECUTIVE SUMMARY & KEY FINDINGS
2 REPORT OFFERS
3 INTRODUCTION
- 3.1 Study Assumptions & Market Definition
- 3.2 Scope of the Study
- 3.3 Research Methodology
4 KEY INDUSTRY TRENDS
- 4.1 End User Trends
- 4.1.1 Aerospace
- 4.1.2 Automotive
- 4.1.3 Building and Construction
- 4.1.4 Electrical and Electronics
- 4.1.5 Packaging
- 4.2 Regulatory Framework
- 4.2.1 Argentina
- 4.2.2 Australia
- 4.2.3 Brazil
- 4.2.4 Canada
- 4.2.5 China
- 4.2.6 EU
- 4.2.7 India
- 4.2.8 Japan
- 4.2.9 Malaysia
- 4.2.10 Mexico
- 4.2.11 Nigeria
- 4.2.12 Russia
- 4.2.13 Saudi Arabia
- 4.2.14 South Africa
- 4.2.15 South Korea
- 4.2.16 United Arab Emirates
- 4.2.17 United Kingdom
- 4.2.18 United States
- 4.3 Value Chain & Distribution Channel Analysis
5 MARKET SEGMENTATION (includes market size in Value in USD and Volume, Forecasts up to 2029 and analysis of growth prospects)
- 5.1 End User Industry
- 5.1.1 Aerospace
- 5.1.2 Automotive
- 5.1.3 Electrical and Electronics
- 5.1.4 Industrial and Machinery
- 5.1.5 Other End-user Industries
- 5.2 Region
- 5.2.1 Africa
- 5.2.1.1 By Country
- 5.2.1.1.1 Nigeria
- 5.2.1.1.2 South Africa
- 5.2.1.1.3 Rest of Africa
- 5.2.2 Asia-Pacific
- 5.2.2.1 By Country
- 5.2.2.1.1 Australia
- 5.2.2.1.2 China
- 5.2.2.1.3 India
- 5.2.2.1.4 Japan
- 5.2.2.1.5 Malaysia
- 5.2.2.1.6 South Korea
- 5.2.2.1.7 Rest of Asia-Pacific
- 5.2.3 Europe
- 5.2.3.1 By Country
- 5.2.3.1.1 France
- 5.2.3.1.2 Germany
- 5.2.3.1.3 Italy
- 5.2.3.1.4 Russia
- 5.2.3.1.5 United Kingdom
- 5.2.3.1.6 Rest of Europe
- 5.2.4 Middle East
- 5.2.4.1 By Country
- 5.2.4.1.1 Saudi Arabia
- 5.2.4.1.2 United Arab Emirates
- 5.2.4.1.3 Rest of Middle East
- 5.2.5 North America
- 5.2.5.1 By Country
- 5.2.5.1.1 Canada
- 5.2.5.1.2 Mexico
- 5.2.5.1.3 United States
- 5.2.6 South America
- 5.2.6.1 By Country
- 5.2.6.1.1 Argentina
- 5.2.6.1.2 Brazil
- 5.2.6.1.3 Rest of South America
- 5.2.1 Africa
6 COMPETITIVE LANDSCAPE
- 6.1 Key Strategic Moves
- 6.2 Market Share Analysis
- 6.3 Company Landscape
- 6.4 Company Profiles (includes Global Level Overview, Market Level Overview, Core Business Segments, Financials, Headcount, Key Information, Market Rank, Market Share, Products and Services, and Analysis of Recent Developments).
- 6.4.1 China Petroleum & Chemical Corporation
- 6.4.2 DuPont
- 6.4.3 Huvis Corp.
- 6.4.4 Hyosung Advanced Materials
- 6.4.5 JSC "Kamenskvolokno"
- 6.4.6 Kolon Industries, Inc.
- 6.4.7 Taekwang Industrial Co., Ltd
- 6.4.8 Teijin Limited
- 6.4.9 X-FIPER New Material Co., Ltd
- 6.4.10 Yantai Tayho Advanced Materials Co.,Ltd.
7 KEY STRATEGIC QUESTIONS FOR ENGINEERING PLASTICS CEOS
8 APPENDIX
- 8.1 Global Overview
- 8.1.1 Overview
- 8.1.2 Porter's Five Forces Framework (Industry Attractiveness Analysis)
- 8.1.3 Global Value Chain Analysis
- 8.1.4 Market Dynamics (DROs)
- 8.2 Sources & References
- 8.3 List of Tables & Figures
- 8.4 Primary Insights
- 8.5 Data Pack
- 8.6 Glossary of Terms
