|
시장보고서
상품코드
1911807
유럽의 LED 조명 시장 : 시장 점유율 분석, 산업 동향 및 통계, 성장 예측(2026-2031년)Europe LED Lighting - Market Share Analysis, Industry Trends & Statistics, Growth Forecasts (2026 - 2031) |
||||||
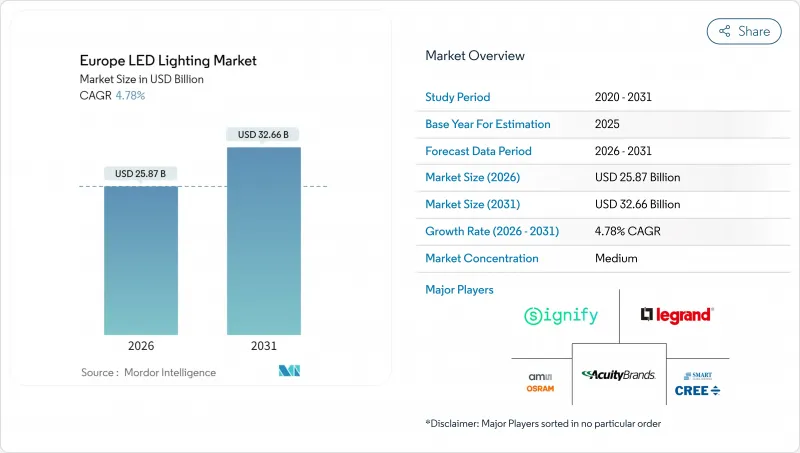
유럽의 LED 조명 시장은 2025년에 246억 9,000만 달러로 평가되었고, 2026년 258억 7,000만 달러에서 2031년까지 326억 6,000만 달러에 이를 것으로 예측됩니다.
예측 기간(2026-2031년) CAGR은 4.78%로 성장이 전망됩니다.

이 성장은 순수한 기술 혁신보다 규제 준수 및 지속가능성 목표가 우선하는 성숙한 대체 주도의 사이클을 반영합니다. EU 전역의 에너지 효율 의무화, 할로겐등 및 형광등의 단계적 폐지, 기업의 넷 제로 달성 로드맵이 개수 수요 고조를 유지하는 한편, 루멘당 비용 저하 및 스마트 시티 입찰이 신규 설치 기회를 확대하고 있습니다. 기존 공급업체는 설치 서비스, 연결 조명 플랫폼 및 순환형 경제 설계를 활용하여 점유율을 보호하지만 전자상거래 채널은 틈새 신규 참가자의 진입 장벽을 낮추고 있습니다. 희토류 형광체에 대한 공급망 리스크, 에코디자인 및 WEEE 의무의 관리 부담은 단기적인 상승 여지를 억제하면서 잠재적인 신규 경쟁사를 막고 규모가 큰 기업의 이익률을 안정시킵니다.
유럽의 LED 조명 시장 동향 및 분석
엄격한 EU 에너지 효율 규제
2024년 7월에 법적 효력을 발효한 '지속가능한 제품을 위한 에코디자인 규제(ESPR)'는 저에너지 소비, 긴 수명, 높은 수리 가능성 등 LED 기술에 고유한 특성을 갖춘 제품을 우대함으로써 조달 형태를 재구축합니다. 2027년 도입 예정인 디지털 제품 여권에서는 제조업체가 환경 실적를 문서화할 것을 의무화해 기존의 조명기구의 컴플라이언스 부담을 증대시켜 라이프사이클 데이터를 이미 공표하고 있는 확립된 LED 브랜드에 대한 공급자 선호를 강화합니다. 또한 본 규제에서는 2026년 이후 미판매품의 폐기가 금지되므로 유통업체는 재고 관리 개선 및 비적합 재고의 조기 처분을 촉발받게 됩니다. 공공 부문의 자금은 이탈리아의 국가부흥 및 탄력 계획(에너지 전환 프로젝트에 555억 2,000만 유로=627억 4,000만 달러 배분) 등의 시책을 통해 적합 조명 기기에 집중적으로 투입됩니다.
할로겐 램프 및 형광등의 급속한 단계적 폐지
EU 및 영국 규정에 따라 전통적인 램프는 유통에서 배제되고 시설은 예산주기와 상관없이 LED로 전환해야 합니다. 북유럽 국가에서는 가장 엄격한 폐지 기한이 설정되어 있으며, 재고가 풍부한 공급업체를 우대하는 지역적 발주 급증을 일으키고 있습니다. 통합 LED 조명기구는 인클로저 전체를 대체하는 경우가 많기 때문에 수량이 안정적임에도 불구하고 단가가 상승하여 평균 판매 가격을 올리고 있습니다. 턴키 설치 서비스를 갖춘 제조업체는 규제 준수의 긴급성을 활용하여 유지 보수 계약을 번들로 제공하여 고객의 봉쇄를 강화하고 있습니다.
중소기업에서 가격 민감한 리노베이션 투자 회수 기간
중소기업에서는 에너지 절약 효과가 2년 이내에 자본 지출을 회수할 수 없는 경우 업그레이드를 선보입니다. 이로 인해 규제 기한이 다가오고 있음에도 불구하고 개수량이 늘어나고 있습니다. 덴마크의 루메가 제도와 같은 성능 계약 모델은 초기 비용을 필요로 하지 않지만, 신청자를 주저하게 하는 자격 요건을 마련하고 있으며, 설치 기반의 상당 부분이 구식 조명에 의존한 채로 남아 있습니다.
부문 분석
조명기구 카테고리는 광 엔진, 광학계, 제어 기능을 통합한 완전 설계된 기구 수요로 2025년 유럽의 LED 조명 시장의 62.10% 점유율을 획득했습니다. 부문 수익은 평균 판매 가격 상승 및 프로젝트 기반 설치 서비스를 통해 혜택을 누리고 있습니다. 램프는 절대치로는 소규모이면서 비용 저하와 스마트 전구 기능에 의한 개수 수요의 환기에 의해 2031년까지 연평균 복합 성장률(CAGR) 7.45%를 보일 것으로 예측됩니다. 트럭 조명 및 비상 조명기구는 보험 규정에 따라 적합 장비가 의무화되는 상업 사무실에서 채택됩니다. LEDVANCE의 EVERLOOP 시리즈와 같은 순환 경제 설계는 교체 가능한 모듈이 수명 주기를 연장하고 ESPR 수리 가능성 요구 사항을 충족하는 방법을 보여줍니다.
수량 기준으로 램프 출하량이 더 빨리 증가합니다. 교환 작업에 배선 공사가 불필요하기 때문에 중소기업의 자금 조달 제약에 적합하기 때문입니다. 한편, 조명기구 프로젝트는 빌딩 관리 시스템과의 통합이 일반적이며, 시설 관리자가 점유율 분석을 통해 수익화하는 데이터 스트림을 생성합니다. 이 서비스 계층은 프리미엄 가격 설정을 지원하고 상품화가 진행되는 하드웨어 시장에서 이익률 압축의 위험을 줄입니다.
도매 및 소매 네트워크는 2025년 시점에서 유럽의 LED 조명 시장의 51.70%의 점유율을 유지하고 있으며, 이는 물류 일괄화 및 판매 전 설계 지원을 중시하는 전기 공사 회사에 의한 것입니다. 한편 전자상거래는 CAGR 5.75%로 확대되고 있으며, 투명한 가격 설정 및 신속한 배송을 중시하는 중소기업에 대응하고 있습니다. 제조업체는 현재 하이브리드 모델을 전개하고 있으며, 예를 들어 IKEA는 JETSTROM 스마트 패널의 온라인 주문과 상점에서 설정 지원을 결합합니다. 대규모 프로젝트에서는 현장 감사 및 맞춤형 조명 설계가 필수적이므로 직접 판매는 여전히 중요합니다.
디지털 플랫폼의 가격 투명성은 유통업체의 여백을 압축하면서 공급업체에 실시간 수요 데이터를 제공하여 예측 정확도를 향상시킵니다. 이에 대해 유통업체는 현장에서 시운전 및 보증 관리 등 부가가치 서비스를 다층화함으로써 자신의 존재의의를 지키려 하고 있습니다.
기타 혜택 :
- 엑셀 형식 시장 예측(ME) 시트
- 애널리스트에 의한 3개월간의 지원
자주 묻는 질문
목차
제1장 서론
- 조사의 전제조건 및 시장 정의
- 조사 범위
제2장 조사 방법
제3장 주요 요약
제4장 시장 상황
- 시장 개요
- 시장 성장 촉진요인
- EU의 엄격한 에너지 효율 규제
- 할로겐 램프 및 형광등의 급속한 단계적 폐지
- 기업의 넷 제로 목표가 개수 촉진
- 루멘 당 LED 비용 저하
- 현장 재생에너지+직류 마이크로그리드 도입
- IoT 센서를 통합한 스마트 시티 입찰 안건
- 시장 성장 억제요인
- 중소기업에서 가격 감응도가 높은 개수 투자 회수 기간
- 희토류 형광체 공급망 변동성
- EU 에코디자인의 복잡성 및 WEEE(폐전기전자기기) 지령에 대한 적합
- 접속형 조명 시스템용의 숙련 설치 기술자 부족
- 업계 밸류체인 분석
- 거시경제 요인의 영향
- 규제 상황
- 기술 전망
- Porter's Five Forces 분석
- 신규 참가업체의 위협
- 공급기업의 협상력
- 구매자의 협상력
- 대체품의 위협
- 경쟁 기업 간 경쟁 관계
제5장 시장 규모 및 성장 예측
- 제품 유형별
- 램프
- 조명기구 및 조명 장치
- 유통 채널별
- 직접 판매
- 도매 및 소매
- 전자상거래
- 설치 유형별
- 신규 설치
- 리노베이션 설치
- 용도별
- 상업 사무실
- 소매 점포
- 접객
- 산업
- 고속도로 및 일반도로
- 건축
- 공공 시설
- 병원
- 원예 및 정원
- 주택
- 자동차
- 기타(화학, 석유 및 가스, 농업)
- 최종 사용자별
- 실내
- 옥외
- 자동차
- 국가별
- 독일
- 영국
- 프랑스
- 이탈리아
- 스페인
- 네덜란드
- 스웨덴
- 폴란드
- 러시아
- 기타 유럽
제6장 경쟁 구도
- 시장 집중도
- 전략적 동향
- 시장 점유율 분석
- 기업 프로파일
- Signify NV
- Zumtobel Group AG
- Osram Licht AG(ams-Osram)
- Schreder SA
- Fagerhult Group
- Acuity Brands Lighting Inc.
- Havells Sylvania Europe Ltd.
- Legrand SA
- Eaton Corporation plc(Cooper Lighting)
- TRILUX GmbH and Co. KG
- Thorn Lighting Ltd.
- FW Thorpe Plc
- LEDVANCE GmbH
- Helvar Oy Ab
- iGuzzini illuminazione SpA
- Glamox AS
- Cree Lighting Europe SpA
- ITECH LED Lighting
- Hella GmbH and Co. KGaA
- Nichia Europe GmbH
- Samsung Electronics Europe(LED business)
- LG Innotek Europe GmbH
- Valmont Industries(EU lighting poles)
- Opple Lighting Europe BV
제7장 시장 기회 및 장래 전망
AJY 26.01.30The European LED lighting market was valued at USD 24.69 billion in 2025 and estimated to grow from USD 25.87 billion in 2026 to reach USD 32.66 billion by 2031, at a CAGR of 4.78% during the forecast period (2026-2031).
Growth reflects a mature, replacement-led cycle in which regulatory compliance and sustainability targets take precedence over the novelty of pure technology. EU-wide energy-efficiency mandates, phase-outs of halogen and fluorescent light bulbs, and corporate net-zero roadmaps keep retrofit momentum high, while falling costs per lumen and smart-city tenders expand new-installation opportunities. Incumbent suppliers capitalize on installation services, connected-lighting platforms, and circular-economy designs to defend share, though e-commerce channels lower barriers for niche entrants. Supply-chain risks surrounding rare-earth phosphors and the administrative burden of eco-design and WEEE obligations temper the near-term upside but also deter potential new competitors, keeping margins stable for scale players.
Europe LED Lighting Market Trends and Insights
Stringent EU Energy-Efficiency Regulations
The Ecodesign for Sustainable Products Regulation (ESPR), which took legal effect in July 2024, reshapes procurement by rewarding products with low energy use, long service life, and high repairability -attributes inherent to LED technology. Digital Product Passports, set for 2027, require manufacturers to document their environmental footprints, thereby increasing the compliance burden for legacy luminaires and strengthening supplier preference for established LED brands that already publish lifecycle data. The regulation also bans the destruction of unsold goods after 2026, compelling distributors to refine their inventory management and accelerate the clearance of non-compliant stock. Public-sector funding funnels into compliant lighting via instruments such as Italy's National Recovery and Resilience Plan, which allocated EUR 55.52 billion (USD 62.74 billion) for energy transition projects.
Rapid Phase-Out of Halogen and Fluorescent Lamps
EU and UK restrictions eliminate legacy lamps from circulation, obliging facilities to adopt LEDs regardless of budget cycles. Nordic countries enforce the shortest sunset dates and have triggered regional spikes in purchase orders that favor suppliers with well-stocked warehouses. Because integrated LED luminaires often replace entire housings, unit revenues rise even as unit counts remain stable, thereby lifting average selling prices. Manufacturers equipped with turnkey installation services capitalize on the urgency of compliance to bundle maintenance contracts, thereby deepening account lock-in.
Price-Sensitive Retrofit Payback Period in SMEs
Small enterprises defer upgrades when energy savings do not repay capital outlays within two years, thereby slowing retrofit volumes, even in the face of looming regulatory deadlines. Performance-contracting models, such as Denmark's Lumega scheme, remove upfront costs but impose qualification hurdles that discourage applicants, leaving a sizable portion of the installed base reliant on outdated lighting.
Other drivers and restraints analyzed in the detailed report include:
- Corporate Net-Zero Commitments Driving Retrofits
- Falling LED Cost per Lumen
- Supply-Chain Volatilities for Rare-Earth Phosphors
For complete list of drivers and restraints, kindly check the Table Of Contents.
Segment Analysis
The luminaires category secured 62.10 of % European LED lighting market share in 2025 through demand for fully engineered fixtures that merge light engines, optics, and controls. Segment revenues benefit from higher average selling prices and project-based installation services. Lamps, although smaller in absolute terms, are forecast to grow at a 7.45% CAGR to 2031 as costs decline and smart bulb features unlock retrofit spending. Track lighting and emergency luminaires are adopted in commercial offices where insurance regulations mandate compliant fittings. Circular-economy designs, such as LEDVANCE's EVERLOOP series, highlight how replaceable modules extend life cycles and satisfy ESPR repairability requirements.
In volume terms, lamp shipments rise faster because replacement work requires no rewiring, fitting SME cash-flow constraints. However, luminaire projects often integrate with building management systems, yielding data streams that facility managers monetize through occupancy analytics. This services layer supports premium pricing, reducing the risk of margin compression in an otherwise commoditized hardware landscape.
The wholesale and retail network maintained a 51.70% market share of the European LED lighting market in 2025, driven by electrical contractors who prefer bundled logistics and pre-sale design assistance. Yet e-commerce is expanding at a 5.75% CAGR, serving SMEs that value transparent pricing and rapid delivery. Manufacturers now deploy hybrid models; for instance, IKEA pairs online ordering of its JETSTROM smart panels with in-store support for configuration. Direct sales remain essential for large projects requiring site audits and bespoke photometric design.
Price transparency on digital platforms compresses distributor spreads while also providing suppliers with real-time demand data, thereby improving forecasting accuracy. Distributors respond by layering value-added services, such as on-site commissioning and warranty management, to protect their relevance.
The Europe LED Lighting Market Report is Segmented by Product Type (Lamps, and Luminaires/Fixtures), Distribution Channel (Direct Sales, Wholesale/Retail, and More), Installation Type (New Installation, and Retrofit Installation), Application (Commercial Offices, Retail Stores, and More), End User (Indoor, Outdoor, and More), and Country (United Kingdom, and More). The Market Forecasts are Provided in Terms of Value (USD).
List of Companies Covered in this Report:
- Signify N.V.
- Zumtobel Group AG
- Osram Licht AG (ams-Osram)
- Schreder SA
- Fagerhult Group
- Acuity Brands Lighting Inc.
- Havells Sylvania Europe Ltd.
- Legrand S.A.
- Eaton Corporation plc (Cooper Lighting)
- TRILUX GmbH and Co. KG
- Thorn Lighting Ltd.
- FW Thorpe Plc
- LEDVANCE GmbH
- Helvar Oy Ab
- iGuzzini illuminazione S.p.A.
- Glamox AS
- Cree Lighting Europe S.p.A.
- ITECH LED Lighting
- Hella GmbH and Co. KGaA
- Nichia Europe GmbH
- Samsung Electronics Europe (LED business)
- LG Innotek Europe GmbH
- Valmont Industries (EU lighting poles)
- Opple Lighting Europe B.V.
Additional Benefits:
- The market estimate (ME) sheet in Excel format
- 3 months of analyst support
TABLE OF CONTENTS
1 INTRODUCTION
- 1.1 Study Assumptions and Market Definition
- 1.2 Scope of the Study
2 RESEARCH METHODOLOGY
3 EXECUTIVE SUMMARY
4 MARKET LANDSCAPE
- 4.1 Market Overview
- 4.2 Market Drivers
- 4.2.1 Stringent EU energy-efficiency regulations
- 4.2.2 Rapid phase-out of halogen and fluorescent lamps
- 4.2.3 Corporate net-zero commitments driving retrofits
- 4.2.4 Falling LED cost per lumen
- 4.2.5 On-site renewable + DC micro-grids adoption
- 4.2.6 Smart-city tenders bundling IoT sensors
- 4.3 Market Restraints
- 4.3.1 Price-sensitive retrofit payback period in SMEs
- 4.3.2 Supply-chain volatilities for rare-earth phosphors
- 4.3.3 Complexity of EU eco-design / WEEE compliance
- 4.3.4 Lack of skilled installers for connected lighting systems
- 4.4 Industry Value Chain Analysis
- 4.5 Impact of Macroeconomic Factors
- 4.6 Regulatory Landscape
- 4.7 Technological Outlook
- 4.8 Porter's Five Forces Analysis
- 4.8.1 Threat of New Entrants
- 4.8.2 Bargaining Power of Suppliers
- 4.8.3 Bargaining Power of Buyers
- 4.8.4 Threat of Substitutes
- 4.8.5 Competitive Rivalry
5 MARKET SIZE AND GROWTH FORECASTS (VALUE)
- 5.1 By Product Type
- 5.1.1 Lamps
- 5.1.2 Luminaires / Fixtures
- 5.2 By Distribution Channel
- 5.2.1 Direct Sales
- 5.2.2 Wholesale / Retail
- 5.2.3 E-commerce
- 5.3 By Installation Type
- 5.3.1 New Installation
- 5.3.2 Retrofit Installation
- 5.4 By Application
- 5.4.1 Commercial Offices
- 5.4.2 Retail Stores
- 5.4.3 Hospitality
- 5.4.4 Industrial
- 5.4.5 Highway and Roadway
- 5.4.6 Architectural
- 5.4.7 Public Places
- 5.4.8 Hospitals
- 5.4.9 Horticulture Gardens
- 5.4.10 Residential
- 5.4.11 Automotive
- 5.4.12 Others (Chemicals, Oil and Gas, Agriculture)
- 5.5 By End User
- 5.5.1 Indoor
- 5.5.2 Outdoor
- 5.5.3 Automotive
- 5.6 By Country
- 5.6.1 Germany
- 5.6.2 United Kingdom
- 5.6.3 France
- 5.6.4 Italy
- 5.6.5 Spain
- 5.6.6 Netherlands
- 5.6.7 Sweden
- 5.6.8 Poland
- 5.6.9 Russia
- 5.6.10 Rest of Europe
6 COMPETITIVE LANDSCAPE
- 6.1 Market Concentration
- 6.2 Strategic Moves
- 6.3 Market Share Analysis
- 6.4 Company Profiles {(includes Global level Overview, Market level overview, Core Segments, Financials as available, Strategic Information, Market Rank/Share for key companies, Products and Services, and Recent Developments)}
- 6.4.1 Signify N.V.
- 6.4.2 Zumtobel Group AG
- 6.4.3 Osram Licht AG (ams-Osram)
- 6.4.4 Schreder SA
- 6.4.5 Fagerhult Group
- 6.4.6 Acuity Brands Lighting Inc.
- 6.4.7 Havells Sylvania Europe Ltd.
- 6.4.8 Legrand S.A.
- 6.4.9 Eaton Corporation plc (Cooper Lighting)
- 6.4.10 TRILUX GmbH and Co. KG
- 6.4.11 Thorn Lighting Ltd.
- 6.4.12 FW Thorpe Plc
- 6.4.13 LEDVANCE GmbH
- 6.4.14 Helvar Oy Ab
- 6.4.15 iGuzzini illuminazione S.p.A.
- 6.4.16 Glamox AS
- 6.4.17 Cree Lighting Europe S.p.A.
- 6.4.18 ITECH LED Lighting
- 6.4.19 Hella GmbH and Co. KGaA
- 6.4.20 Nichia Europe GmbH
- 6.4.21 Samsung Electronics Europe (LED business)
- 6.4.22 LG Innotek Europe GmbH
- 6.4.23 Valmont Industries (EU lighting poles)
- 6.4.24 Opple Lighting Europe B.V.
7 MARKET OPPORTUNITIES AND FUTURE OUTLOOK
- 7.1 White-space and Unmet-need Assessment