
|
시장보고서
상품코드
1683959
북미의 LED 조명 시장 : 시장 점유율 분석, 산업 동향, 성장 예측(2025-2030년)North America LED Lighting - Market Share Analysis, Industry Trends & Statistics, Growth Forecasts (2025 - 2030) |
||||||
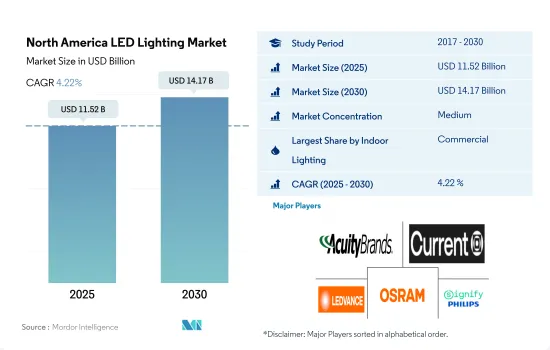
북미의 LED 조명 시장 규모는 2025년에 115억 2,000만 달러로 추정되고, 2030년에는 141억 7,000만 달러에 이를 것으로 예측되며, 예측 기간 중 2025년부터 2030년까지 CAGR 4.22%로 성장할 전망입니다.
산업 생산 수요 증가, 저장 공간 요구 증가, 사무실 공간 가용성 증가가 시장 수요 견인
- 금액 점유율에서는 2023년 상업 부문이 점유율의 대부분을 차지하였고 공업 및 창고(I&W), 주택, 농업 부문이 이어졌습니다. I&W 시장 점유율은 향후 몇년만에 상승하였고 나머지 분야는 명목상 점유율을 획득한 것으로 평가되었습니다. 미국 산업은 국내 소비 침체, 반도체 급박, 공장 폐쇄, COVID-19의 급증으로 인한 공급망 혼란 등 일부 내외부의 역풍에 직면했습니다. 게다가 미국은 2021년 공업 생산을 유지해 2020년 대비 11.55% 증가한 2조 4,971억 달러에 달했습니다.
- 미국의 2023년 5월 광산업 생산은 전년 동월 대비 0.2% 증가하여 2023년 4월의 0.4% 증가에서 상향 조정되었습니다. 광업은 5% 증가, 유틸리티는 3.8% 감소, 제조업은 0.3% 감소했습니다. 게다가 멕시코의 생산고는 2,300억 7,000만 달러에 달하였고, 2020년 대비 제조업 생산고가 21.44% 증가했습니다. 이와 같이 이 지역의 공업 생산이 성장하고 있기 때문에 향후 수년간 실내 조명 수요가 높아질 것으로 예상됩니다.
- 캐나다의 상업용 부동산 부문은 2022년 중반 이후 시장 변동성 상승에 직면해 있습니다. 금융, 테크놀로지, 생명과학 부문이 사무실 수요를 견인하고 임대료는 2021년에 비해 상승했습니다. 고용은 건설업, 창고업 등에서 증가했습니다. 2022년 12월 캐나다에서는 10만 4,000명의 고용이 증가했습니다. 2022년 4분기 국내 사무소의 공실률은 16.5%로 2022년 3분기와 2021년 4분기를 상회했습니다. 이러한 사례로부터 가까운 미래에 사무실 공간에 대한 수요가 증가하고 지역 전체에서 실내 조명 제품의 요구가 높아질 것으로 예상됩니다.
소규모 기업 증가, 기존 조명 교체, EV로의 전환이 시장 수요 견인
- 금액 및 수량 점유율은 2023년 미국 LED 조명 시장이 점유율의 대부분을 차지하였고, 북미의 다른 지역이 이어졌습니다. 미국의 국내 자동차 생산량은 2021년 910만 대에서 2022년 1,006만 대로 증가했습니다. 자동차 생산에는 승용차와 상용차가 포함됩니다. 캐나다에서는 자동차 생산 대수는 2021년 대비 10.2% 증가하여 120만 대가 되었습니다. 국내 자동차 생산량 증가는 시장에서 자동차 LED 수요 증가를 초래합니다.
- 2022년 미국 중소기업은 3,320만 사. 급성장하는 신흥기업 5곳의 본사는 샌프란시스코에 있습니다. 미국 신흥기업의 약 40%는 적어도 한 명의 여성이 지도적 입장에 있습니다. 중소기업의 65% 이상이 2022년에 이익을 계상. 이상과 같은 사례로부터, 향후 수년간은 실내 업무용 LED 수요가 높아질 것으로 예상됩니다.
- 캐나다의 각 도시는 노후화된 시스템의 업데이트 및 업그레이드를 통해 에너지 효율적인 가로등 시스템에 대한 투자를 늘리고 있습니다. 예를 들어, 캐나다 앨버타의 김플렉스 아레나(Kimplex Arena)는 136개의 새로운 고저장 경기장 LED 조명기구와 LED 스트립을 설치하여, Municipal Climate Change Action Centre의 녹색 에너지 이니셔티브의 일환으로 각 팀이 아레나 조명을 업그레이드했습니다.
- 한편, 북미의 많은 나라에서는 EV 수요가 늘어나 LED의 보급이 진행되었습니다. 멕시코는 2022년에 108만 대의 신차 판매를 기록했으며 2021년부터 7% 개선, 미국 EV 판매는 2022년 65% 증가했습니다. 미국 상무부 멕시코는 자동차 산업의 하위 부문인 OE 부품, 애프터마켓, 전기자동차(EV) 부품에 큰 비즈니스 기회가 있다고 예측했습니다.
북미의 LED 조명 시장 동향
EV 산업 확대를 위한 정부의 대처가 LED 시장 촉진
- 2023년 북미 출생률은 인구 1,000명당 11.821명으로 2022년부터 0.07% 증가했습니다. 2018년 북미 주택 수는 1억 5,615만 호로, 2023년에는 2억 5,579만 호에 이르렀습니다. 미국 인구는 2023년에 사상 최고의 5억 명을 넘어섰습니다. 2022년 미국 남부에서 착공된 신축 주택의 수는 다른 모든 지역의 합계보다 많았습니다. 서부는 주택 착공 호수가 가장 많은 두 번째 지역으로 2021년에는 약 40만 800호에 달했습니다. 북동부는 2022년에 주택 착공 건수가 증가한 미국 유일한 지역이었습니다.
- 또한 미국의 2022년 가구 수는 1억 3,120만 가구였습니다. 미국의 가구 수는 2020년(1억 2,845만 가구)보다 많았습니다. 2022년의 전형적인 미국인 가족의 인원은 3.13명이었습니다. 2022년 주택 소지가구의 비율은 65.9%, 2020년에는 6방 이상의 주택은 전체 주택의 19.3%였습니다. LED의 확대는 가족 증가와 이 전형적인 방 수 증가에 대응하는 필요에 의해 촉진되었습니다.
- 2022년 북미의 자동차 생산 대수는 1,454만 대였지만, 2023년에는 1,506만 대로 증가한 것으로 평가되었습니다. 자동차 산업은 북미 최대의 제조업 중 하나입니다. 정부의 이니셔티브가 북미 전체의 EV 시장을 크게 인상하고 있습니다. 2022년 8월 인플레이션 억제법이 제정된 후 주요 EV 및 배터리 제조업체는 북미의 EV 공급망에 대한 지출을 발표했으며, 그 총액은 당시부터 2023년 3월까지 최소 520억 달러에 이르렀습니다. 이러한 소비자와 제조업체에 이익을 주는 조치는 이 지역의 LED 조명 수요를 증가시킬 것으로 보입니다.
민간 주택 증가 및 정부 정책이 LED 시장을 견인
- 북미에서는 미국과 캐나다가 수입과 인구 측면에서 주요 도시가 되고 있습니다. 북미의 현재 인구는 2023년 6월 3억 7,550만 명이었습니다. 미국이 3억 3,100만 명으로 이 지역의 인구의 대부분을 차지한 다음 캐나다는 2020년까지 3,770만 명이 되었습니다. 인구의 82.6%는 도시에 살고 있습니다(2019년에는 3억 470만 명). 이 지역의 인구는 0.6%의 변화율로 증가했습니다. 따라서 인구 증가로 LED의 보급이 진행되고 국내 조명 요구가 높아질 것으로 보입니다.
- 캐나다와 미국에서는 가처분 소득이 높아 개인의 소비력이 높아져 새로운 거주 공간에 더 많은 자금을 채울 수 있습니다. 캐나다 월별 수입은 2023년 3월 3,464달러로 2023년 2월 3,500달러에서 감소했습니다. 평균 월수입이 약간 감소하고 있다고는 해도, 북미의 선진국이기 때문에 타국에 비해 구매력은 높습니다.
- 2023년 5월의 건축 허가 건수는 1,491,000호였습니다. 이것은 1,417,000호에서 증가한 2023년 4월 보다는 5.2% 많습니다. 5월의 개인 주택 착공 호수는 1,631,000호였습니다. 이는 2022년 5월에 1,543,000호를 5.7% 이상, 4월 수정값 1,340,000호를 21.7% 웃돌았습니다.
- 에너지정책법(EPAct) 제179D조에 따라 2022년에는 1평방피트당 1.88달러의 공제가 있었지만, 신규제에 따라 2023년에는 업그레이드된 공간 1평방피트당 5달러에 최대 세금공제액이 뛰어올랐습니다(단, 1평방피트당 2달러로 상승할 예정). 대상 프로젝트는 실내 조명, 에어컨, 건물 외벽 등입니다. 이러한 사례로 인해 지역의 LED 조명 수요가 급증할 것으로 예상됩니다.
북미의 LED 조명 산업 개요
북미의 LED 조명 시장은 적당히 통합되어 상위 5개사에서 57.38%를 차지하고 있습니다. 이 시장 주요 기업은 다음과 같습니다. ACUITY BRANDS, INC., Current Lighting Solutions, LLC., LEDVANCE GmbH(MLS), OSRAM GmbH. 및 Signify(Philips)(알파벳순 정렬).
기타 혜택
- 엑셀 형식 시장 예측(ME) 시트
- 3개월의 애널리스트 서포트
목차
제1장 주요 요약 및 주요 조사 결과
제2장 보고서 제안
제3장 서문
- 조사 전제조건 및 시장 정의
- 조사 범위
- 조사 방법
제4장 주요 산업 동향
- 자동차 생산 대수
- 인구
- 1인당 소득
- 자동차 대출 금리
- 충전소 수
- 자동차 보유 대수
- LED 총 수입량
- 조명 소비 전력
- #가구수
- 도로망
- LED 보급률
- #경기장수
- 원예 면적
- 규제 프레임워크
- 실내 조명
- 미국
- 옥외 조명
- 미국
- 자동차용 조명
- 미국
- 실내 조명
- 밸류체인 및 유통채널 분석
제5장 시장 세분화
- 실내 조명별
- 농업용 조명
- 상업용 조명
- 사무실
- 소매
- 기타
- 산업 및 창고
- 주택 조명
- 옥외 조명별
- 공공시설
- 도로
- 기타
- 자동차용 유틸리티 조명별
- 데이터임 러닝 라이트(DRL)
- 방향 지시기
- 헤드라이트
- 리버스 라이트
- 스톱라이트
- 테일 라이트
- 기타
- 자동차용 조명별
- 이륜차
- 상용차
- 승용차
- 국가별
- 미국
- 기타 북미
제6장 경쟁 구도
- 주요 전략 동향
- 시장 점유율 분석
- 기업 상황
- 기업 프로파일(세계 수준 개요, 시장 수준 개요, 주요 사업 부문, 재무, 직원 수, 주요 정보, 시장 순위, 시장 점유율, 제품 및 서비스, 최근 동향 분석 포함)
- ACUITY BRANDS, INC.
- Current Lighting Solutions, LLC.
- GRUPO ANTOLIN IRAUSA, SA
- KOITO MANUFACTURING CO., LTD.
- LEDVANCE GmbH(MLS Co Ltd)
- Marelli Holdings Co., Ltd.
- OSRAM GmbH.
- Signify(Philips)
- Stanley Electric Co., Ltd.
- Valeo
제7장 CEO에 대한 주요 전략적 질문
제8장 부록
- 세계의 개요
- 개요
- Porter's Five Forces 분석 프레임워크
- 세계 밸류체인 분석
- 시장 역학(DROs)
- 정보원 및 참고문헌
- 도표 일람
- 주요 인사이트
- 데이터 팩
- 용어집
The North America LED Lighting Market size is estimated at 11.52 billion USD in 2025, and is expected to reach 14.17 billion USD by 2030, growing at a CAGR of 4.22% during the forecast period (2025-2030).

Increasing demand for industrial production, rising need for storage space, and increasing availability of office space drives demand in the market
- In terms of value share, in 2023, the commercial sector accounted for the majority of the share, followed by industrial and warehouse (I&W), residential, and agricultural sectors. The market share of I&W is expected to increase in the coming years, while the remaining sectors will gain nominal shares. US industries faced several internal and external headwinds, such as weak domestic consumption, semiconductor crunch, plant closures, and supply chain disruptions caused by the surge of COVID-19. Further, the United States sustained its industrial production in 2021, reaching USD 2,497.1 billion, an increase of 11.55% compared to 2020.
- Industrial production grew by 0.2% Y-o-Y in the United States in May 2023, after an upwardly revised rise of 0.4% in April 2023. Mining went up 5%, utilities dropped 3.8% and manufacturing fell 0.3%. Further, Mexico's production reached USD 230.07 billion, an increase of 21.44% in manufacturing output compared to 2020. Thus, the growing industrial production in this region is expected to create more demand for indoor lighting in the coming years.
- The Canadian commercial real estate sector has been facing increasing market volatility since the middle of 2022. The financial, technology, and life sciences sectors drive demand for office space with leasing rates increasing compared to 2021. Employment gains were registered in construction, warehouse industries, and other sectors. In December 2022, 104k jobs were added in Canada. The availability of national offices in the Q4 2022 accounted for 16.5%, which was higher than in Q3 of 2022 and Q4 of 2021. These instances are expected to create more demand for office spaces in the near future, creating more need for indoor lighting products across the region.
An increase in small businesses, replacement of conventional lighting, and transition to EVs drive the market demand
- In terms of value and volume share, in 2023, the US LED light market accounted for the majority of the share, followed by the Rest of North America. The domestic vehicle production in the US increased from 9.1 million units in 2021 to 10.06 million units in 2022. The vehicle production included cars and commercial vehicles. In Canada, vehicle production increased by 10.2% compared to 2021, accounting for 1.2 million units. The increase in domestic vehicle production creates more demand for automotive LEDs in the market.
- In 2022, there were 33.2 million small businesses in the United States. The five fast-growing start-ups are headquartered in San Francisco. About 40% of US start-ups have at least one woman in a leadership position. Over 65% of small businesses reported profits in 2022. The above instances are expected to create more demand for indoor commercial LEDs in the coming years.
- Canadian cities are investing more in energy-efficient street lighting systems to replace or upgrade aging systems. For example, as part of the green energy initiative by the Municipal Climate Change Action Centre, teams upgraded the arena lighting by installing 136 new high and low arena LED luminaires and LED strips at Kimplex Arena in Alberta, Canada.
- On the other hand, demand for EVs grew in many countries in North America, leading to an increase in LED penetration. Mexico recorded 1.08 million new car sales in 2022, a 7% improvement from 2021, and US EV sales increased by 65% in 2022. The US Commercial Service Mexico estimates strong opportunities in sub-sectors of the automotive industry in OE parts, aftermarket, and electric vehicle (EV) parts.
North America LED Lighting Market Trends
Government initiatives to expand EV industry will boost the LED market
- North America's birth rate in 2023 is 11.821 births per 1,000 people, a 0.07% increase from 2022. In 2018, there were 156.15 million homes in North America, which is set to reach 255.79 million by 2023. The population of the United States has grown from a record more than 500 million people in 2023. In 2022, more new housing started in the South of the United States than in every other region combined. The West was the second region with the highest number of housings starts, which amounted to roughly 400,800 units in 2021. Northeast was the only region in the US that experienced increased housing starts in 2022.
- Further, the United States had 131.2 million households in 2022. There are now more households in the United States than there were in 2020 (128.45 million). In 2022, there were 3.13 people in the typical American family. The proportion of owner-occupied households in 2022 was 65.9%. In 2020, six or more rooms were present in 19.3% of all occupied dwelling units. The expansion of LEDs will be fueled by an increase in families and the need to accommodate this increase in the typical number of rooms.
- The number of automobiles produced in North America in 2022 was 14.54 million; in 2023, that number is predicted to rise to 15.06 million. The automotive industry is one of the largest manufacturing sectors in North America. Government efforts are significantly raising the market for EVs throughout North America. After the Inflation Reduction Act was enacted in August 2022, major EV and battery manufacturers announced expenditures in North American EV supply chains totaling at least USD 52 billion between that time and March 2023. Such measures that benefit consumers and manufacturers will increase the demand for LED lighting in the area.
Increase in private-owned dwellings and government policy to drive the LED market
- In North America, the US and Canada are the main cities in terms of revenue and population. The current population of Northern America is 375.5 million as of June 2023. The United States occupies a major share of the people in this region, accounting for 331 million, followed by Canada at 37.7 million by 2020. 82.6 % of the population lives in urban areas (304.7 million people in 2019). The population in this region is growing with a 0.6% change. Thus, the increase in population is expected to create more LED penetration and increase the need for illumination in the country.
- In Canada and the US, disposable income is high, resulting in rising spending power of individuals and affording more money on new residential spaces. Canada's monthly earnings stood at USD 3,464 in Mar 2023, reduced from USD 3,500 in February 2023. Even though it is showing a slight decline in average monthly earnings, it has a high purchasing value compared to other nations, as it is a developed country in North America.
- The number of privately owned dwelling units authorized by building permits in May 2023 was 1,491,000. This is 5.2% more than the April 2023 rate, which was increased from 1,417,000. The number of privately owned homes started in May was 1,631,000. This is 5.7% above the May 2022 rate of 1,543,000 and is 21.7% higher than the revised April estimate of 1,340,000.
- As per the Energy Policy Act (EPAct) section 179D, the maximum tax deduction jumped to USD 5 per sq. ft. of upgraded space in 2023 under the new regulations, which has USD 1.88 per sq. ft. deductions in 2022 (but is set to rise to USD 2.00 per sq. ft.). Eligible projects include interior lighting, HVAC, and building envelopes. Such instances are expected to surge the demand for LED lighting in the region.
North America LED Lighting Industry Overview
The North America LED Lighting Market is moderately consolidated, with the top five companies occupying 57.38%. The major players in this market are ACUITY BRANDS, INC., Current Lighting Solutions, LLC., LEDVANCE GmbH (MLS Co Ltd), OSRAM GmbH. and Signify (Philips) (sorted alphabetically).
Additional Benefits:
- The market estimate (ME) sheet in Excel format
- 3 months of analyst support
TABLE OF CONTENTS
1 EXECUTIVE SUMMARY & KEY FINDINGS
2 REPORT OFFERS
3 INTRODUCTION
- 3.1 Study Assumptions & Market Definition
- 3.2 Scope of the Study
- 3.3 Research Methodology
4 KEY INDUSTRY TRENDS
- 4.1 Automotive Production
- 4.2 Population
- 4.3 Per Capita Income
- 4.4 Interest Rate For Auto Loans
- 4.5 Number Of Charging Stations
- 4.6 Number Of Automobile On-road
- 4.7 Total Import Of Leds
- 4.8 Lighting Electricity Consumption
- 4.9 # Of Households
- 4.10 Road Networks
- 4.11 Led Penetration
- 4.12 # Of Stadiums
- 4.13 Horticulture Area
- 4.14 Regulatory Framework
- 4.14.1 Indoor Lighting
- 4.14.1.1 United States
- 4.14.2 Outdoor Lighting
- 4.14.2.1 United States
- 4.14.3 Automotive Lighting
- 4.14.3.1 United States
- 4.14.1 Indoor Lighting
- 4.15 Value Chain & Distribution Channel Analysis
5 MARKET SEGMENTATION (includes market size in Value in USD and Volume, Forecasts up to 2030 and analysis of growth prospects)
- 5.1 Indoor Lighting
- 5.1.1 Agricultural Lighting
- 5.1.2 Commercial
- 5.1.2.1 Office
- 5.1.2.2 Retail
- 5.1.2.3 Others
- 5.1.3 Industrial and Warehouse
- 5.1.4 Residential
- 5.2 Outdoor Lighting
- 5.2.1 Public Places
- 5.2.2 Streets and Roadways
- 5.2.3 Others
- 5.3 Automotive Utility Lighting
- 5.3.1 Daytime Running Lights (DRL)
- 5.3.2 Directional Signal Lights
- 5.3.3 Headlights
- 5.3.4 Reverse Light
- 5.3.5 Stop Light
- 5.3.6 Tail Light
- 5.3.7 Others
- 5.4 Automotive Vehicle Lighting
- 5.4.1 2 Wheelers
- 5.4.2 Commercial Vehicles
- 5.4.3 Passenger Cars
- 5.5 Country
- 5.5.1 United States
- 5.5.2 Rest of North America
6 COMPETITIVE LANDSCAPE
- 6.1 Key Strategic Moves
- 6.2 Market Share Analysis
- 6.3 Company Landscape
- 6.4 Company Profiles (includes Global level Overview, Market level overview, Core Business Segments, Financials, Headcount, Key Information, Market Rank, Market Share, Products and Services, and analysis of Recent Developments)
- 6.4.1 ACUITY BRANDS, INC.
- 6.4.2 Current Lighting Solutions, LLC.
- 6.4.3 GRUPO ANTOLIN IRAUSA, S.A.
- 6.4.4 KOITO MANUFACTURING CO., LTD.
- 6.4.5 LEDVANCE GmbH (MLS Co Ltd)
- 6.4.6 Marelli Holdings Co., Ltd.
- 6.4.7 OSRAM GmbH.
- 6.4.8 Signify (Philips)
- 6.4.9 Stanley Electric Co., Ltd.
- 6.4.10 Valeo
7 KEY STRATEGIC QUESTIONS FOR LED CEOS
8 APPENDIX
- 8.1 Global Overview
- 8.1.1 Overview
- 8.1.2 Porter's Five Forces Framework
- 8.1.3 Global Value Chain Analysis
- 8.1.4 Market Dynamics (DROs)
- 8.2 Sources & References
- 8.3 List of Tables & Figures
- 8.4 Primary Insights
- 8.5 Data Pack
- 8.6 Glossary of Terms
