
|
시장보고서
상품코드
1683960
북미의 실내 LED 조명 : 시장 점유율 분석, 산업 동향 및 통계, 성장 예측(2025-2030년)North America Indoor LED Lighting - Market Share Analysis, Industry Trends & Statistics, Growth Forecasts (2025 - 2030) |
||||||
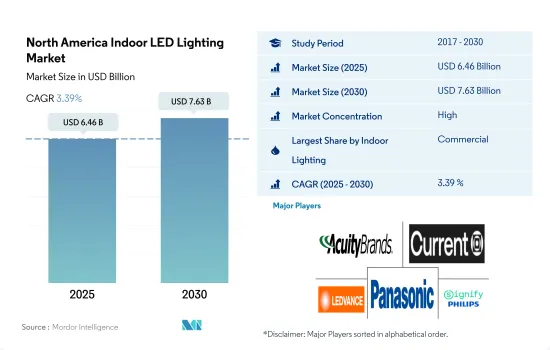
북미의 실내 LED 조명 시장 규모는 2025년에 64억 6,000만 달러에 달할 것으로 추정됩니다. 2030년에는 76억 3,000만 달러에 이를 것으로 예상되며, 예측 기간(2025-2030년)의 CAGR은 3.39%를 나타낼 것으로 전망됩니다.
산업 생산 수요 증가, 저장 공간 요구 증가, 사무실 공간 가용성 증가가 시장 수요를 촉진하고 있습니다.
- 금액 기준으로는 2023년 상업용이 점유율의 대부분을 차지한 다음 주택용, 공업·창고(I&W)용, 농업용이 뒤를 이었습니다. I&W 시장 점유율은 해마다 상승하고 나머지 부서는 약간 감소할 것으로 예상됩니다. 미국 산업은 국내 소비 침체, 반도체 불황, 공장 폐쇄, COVID-19의 급증으로 인한 공급망 혼란 등 여러 안팎의 역풍에 직면했습니다. 또한 미국은 2021년 산업 생산을 유지했습니다. 2021년 미국의 산업 생산은 2조 4,971억 달러로 2020년 대비 11.55% 증가했습니다.
- 미국의 광공업 생산은 2023년 4월에 0.4% 증가로 상향 조정된 후 2023년 5월에는 전년 동월 대비 0.2% 증가했습니다. 광업은 5% 증가, 유틸리티은 3.8% 감소, 제조업은 0.3% 감소했습니다. 멕시코의 제조업 생산량은 총 2,300억 7,000만 달러로 2020년 대비 21.44% 증가했습니다. 따라서 이 지역의 산업 생산 증가는 앞으로 수년간 실내 조명 수요를 증가시킬 것으로 예상됩니다.
- 캐나다의 상업용 부동산 부문은 2022년 중반 이후 시장 변동성 상승에 직면했습니다. 금융, 기술, 생명과학 부문이 사무실 수요를 견인하고 있으며, 임대료는 2021년에 비해 상승했습니다. 고용은 건설, 창고 및 기타 부문에서 증가했습니다. 2022년 12월 캐나다에서는 10만 4,000명의 고용이 증가했습니다. 2022년 4분기 국내 사무소의 공실률은 16.5%로 2022년 3분기와 2021년 4분기를 상회했습니다. 이러한 사례로부터 가까운 미래에 사무실 공간 수요가 증가하여 실내 조명 제품의 요구가 높아질 것으로 예상됩니다.
제조시설, 주택 소유자, 소매시설 증가가 실내조명 수요를 촉진할 것으로 예상
- 금액과 수량으로 보면 2023년에는 미국이 점유율의 대부분을 차지하고 북미가 그에 이어집니다. 시장 점유율은 북미의 나머지 부분에서 감소하고 미국에서는 향후 수년간 변동이 줄어들 것으로 예상됩니다. 북미의 많은 국가에서 EV 수요가 급증하고 제조 설비가 증가했습니다. 2022년 3월 베트남 자동차 제조업체인 VinFast는 Chatham 카운티에 40억 달러를 투자하여 전 전기자동차 SUV 공장을 설립할 계획을 세웠습니다. 2023년 4월에는 포드가 13억 달러를 투자하여 캐나다에 새로운 제조 기지를 설립할 것이라고 발표했습니다. 제조시설 증가로 시장에서는 실내용 LED 수요가 높아질 것으로 예상됩니다.
- 2022년 미국에서는 실제 매장과 전자상거래 사업을 포함한 소매업에 초점을 맞춘 신흥기업이 가장 많았습니다(15.05%). 레스토랑 및 기타 식품 관련 사업은 신흥 기업의 13.71%를 차지했습니다. 신흥기업 증가로 이 지역에서는 실내 LED의 요구가 더욱 높아질 것으로 예상됩니다.
- 미국 가구 수는 2020년에서 2022년에 걸쳐 1억 2,845만 가구에서 1억 3,120만 가구로 증가했습니다. 게다가 2023년 5월에 건축 허가로 인가된 개인 소유의 주택 호수는 1,491,000호였습니다. 이것은 1,417,000에서 증가한 2023년 4월 보다는 5.2% 많습니다. 2023년 5월의 개인 주택 착공 호수는 1,631,000호였습니다. 이는 2022년 5월의 1,543,000을 5.7% 초과했습니다. 따라서 가구 수와 주택 소유자 수 증가는 이 지역에서 실내 LED에 대한 추가 수요를 창출할 것으로 보입니다.
북미의 실내 LED 조명 시장 동향
개인 소유 주택 증가와 정부 정책이 LED 시장을 견인
- 북미에서는 미국과 캐나다가 수익과 인구 측면에서 주요 도시입니다. 북미의 현재 인구는 2023년 6월 기준 3억 7,550만 명이었습니다. 미국은 이 지역 인구의 3억 3,100만 명으로 큰 점유율을 차지했으며, 이어 캐나다는 2020년까지 3,770만 명이 되었습니다. 인구의 82.6%는 도시에 살고 있었습니다(2019년에는 3억 470만명). 이 지역의 인구는 0.6%의 변화율로 증가했습니다. 따라서 인구 증가로 LED의 보급이 진행되고 국내 조명 요구가 높아질 것으로 보입니다.
- 캐나다와 미국에서는 가처분 소득이 높아 개인의 소비력이 높아져 새로운 거주 공간에 더 많은 자금을 채울 수 있습니다. 캐나다 월별 수입은 2023년 3월 3,464달러로 2023년 2월 3,500달러에서 감소했습니다. 평균 월수입이 약간 감소하고 있다고는 해도, 북미의 선진국이기 때문에 타국에 비해 구매력은 높습니다.
- 2023년 5월의 건축 허가 건수는 1,491,000호였습니다. 이것은 1,417,000에서 증가한 2023년 4월 보다는 5.2% 많습니다. 5월의 개인 주택 착공 호수는 1,631,000호였습니다. 이는 2022년 5월에 1,543,000호를 5.7% 이상, 4월 수정값 1,340,000호를 21.7% 웃돌았습니다.
- 에너지정책법(EPAct) 제179D조에 따라 2022년에는 1평방피트당 1.88달러의 공제가 있었던 것이, 신규제에 따라 2023년에는 업그레이드된 스페이스 1평방피트당 5달러에 최대 세 공제액이 뛰어올랐습니다(단, 1평방피트당 2). 대상 프로젝트는 실내 조명, 에어컨, 건물 외벽 등입니다. 이러한 사례로 인해 이 지역의 LED 조명 수요가 급증할 것으로 예상됩니다.
오래된 램프 업그레이드 및 교체, LED 조명 사용을 촉진하는 정부 이니셔티브 증가
- 주거용, 상업용, 산업용의 각 유형은 총 전력량의 약 1/3을 사용합니다. 2021년 3월 캐나다의 주택 평균 판매 가격은 전년 동월 대비 31.6% 상승했습니다. 역사적인 저금리와 넓이에 대한 요구로 인해 유행기에는 소규모 지역의 단독 주택 수요가 증가했습니다. 그러나 낮은 모기지 금리와 급속한 인구 증가는 신축 주택에 대한 높은 수요를 이끌고 있습니다. 2021년 3월 주택건축 투자는 11개월 연속 증가하여 7.6% 증가한 140억 캐나다 달러(109억 9,000만 달러)가 되었습니다. 이 지역의 LED 시장은 건설 활동 증가로 확대되고 있습니다.
- 상업 부문의 전력 수요는 8-10시간 정도가 되는 경향이 있습니다. 산업 부문의 전력 사용량은 하루 또는 일년 내내 변동하지 않는 경향이 있습니다. 주택 부문의 전력 수요는 약 7-9시간 변동합니다. 미국 전역에서 도로와 고속도로가 늘어나면서 조명 수요도 증가하고 있습니다. 미국에서는 공공 고속도로와 가로 건설에 2017년에는월평균 894억 달러, 2021년에는 월평균 999억 달러의 비용이 들었습니다. 그 결과, 지역사회는 오래된 가로등 인프라의 업그레이드와 교환에 많은 자금을 지출하고 LED의 사용을 장려하고 있습니다.
- 캐나다 정부는 캐나다의 ENERGY STAR 등 조명에 사용되는 에너지량을 줄이기 위한 여러 프로그램을 시작했습니다. 또한 2021년 3월 캐나다의 라발시는 3만 7,000개의 램프를 스마트 제어 LED 조명기구로 업데이트할 계획을 승인했습니다. LED 조명으로 전환하면 연간 275만 달러 감소가 예상됩니다. 이 지역에서 LED를 채택하는 것은 이러한 노력으로 촉진됩니다.
북미의 실내 LED 조명 산업 개요
북미의 실내 LED 조명 시장은 상당히 통합되어 있으며 상위 5개사에서 75.28%를 차지하고 있습니다. 이 시장 주요 기업은 다음과 같습니다. ACUITY BRANDS, INC., Current Lighting Solutions, LLC., LEDVANCE GmbH(MLS), Panasonic Holdings Corporation and Signify(Philips)(알파벳순 정렬).
기타 혜택
- 엑셀 형식 시장 예측(ME) 시트
- 3개월의 애널리스트 서포트
목차
제1장 주요 요약과 주요 조사 결과
제2장 보고서 제안
제3장 소개
- 조사의 전제조건과 시장 정의
- 조사 범위
- 조사 방법
제4장 주요 산업 동향
- 인구
- 1인당 소득
- LED 총 수입량
- 조명 전력 소비량
- 가구수
- LED 보급률
- 원예 면적
- 규제 프레임워크
- 미국
- 밸류체인과 유통채널 분석
제5장 시장 세분화
- 실내 조명
- 농업용 조명
- 상업용 조명
- 사무실
- 소매
- 기타
- 산업 및 창고
- 주택
- 국가
- 미국
- 기타 북미
제6장 경쟁 구도
- 주요 전략 동향
- 시장 점유율 분석
- 기업 상황
- 기업 프로파일(세계 수준 개요, 시장 수준 개요, 주요 사업 부문, 재무, 직원 수, 주요 정보, 시장 순위, 시장 점유율, 제품 및 서비스, 최근 동향 분석 포함)
- ACUITY BRANDS, INC.
- Cree LED(SMART Global Holdings, Inc.)
- Current Lighting Solutions, LLC.
- Dialight
- EGLO Leuchten GmbH
- Feit Electric Company, Inc.
- LEDVANCE GmbH(MLS Co Ltd)
- NVC INTERNATIONAL HOLDINGS LIMITED
- Panasonic Holdings Corporation
- Signify(Philips)
제7장 CEO에 대한 주요 전략적 질문
제8장 부록
- 세계의 개요
- 개요
- Five Forces 분석 프레임워크
- 세계의 밸류체인 분석
- 시장 역학(DROs)
- 정보원과 참고문헌
- 도표 일람
- 주요 인사이트
- 데이터 팩
- 용어집
The North America Indoor LED Lighting Market size is estimated at 6.46 billion USD in 2025, and is expected to reach 7.63 billion USD by 2030, growing at a CAGR of 3.39% during the forecast period (2025-2030).

Increasing demand for industrial production, rising need for storage space, and increasing availability of office space are driving the demand for the market
- In terms of value, in 2023, commercial accounted for the majority of the share, followed by residential, industrial and warehouse (I&W), and agricultural. The market share is expected to gain in I&W and a small reduction in the remaining divisions in years. The US industries faced several internal and external headwinds, such as weak domestic consumption, semiconductor crunch, plant closures, and supply chain disruptions caused by the surge of COVID-19. Further, the United States sustained its industrial production in 2021. In 2021, the United States produced a total of USD 2,497.1 billion, an increase of 11.55% compared to 2020.
- In the United States, industrial production grew by 0.2% Y-o-Y in May 2023, after an upwardly revised rise of 0.4% in April 2023. Mining went up by 5%, utilities dropped by 3.8%, and manufacturing fell by 0.3%. Mexico produced a total of USD 230.07 billion, an increase of manufacturing output of 21.44% compared to 2020. Thus, the growing industrial production in this region is expected to create more demand for Indoor lighting in the coming years.
- The Canadian commercial real estate sector has been facing increasing market volatility since the middle of 2022. The financial, technology, and life sciences sectors are the drivers of demand for office space, with leasing rates increasing compared to 2021. Employment gains were registered in the construction, warehouse, and other sectors. In December 2022, 104 thousand jobs were added in Canada. The availability of national offices in Q4 of 2022 and accounted for 16.5%, which was higher than in Q3 of 2022 and Q4 of 2021. These instances are expected to create more demand for office spaces in the near future, which will result in creating more need for indoor lighting products.
The growing number of manufacturing facilities, house owners, and retail facilities is expected to drive the demand for indoor lighting
- In terms of value and volume, in 2023, the United States accounted for the majority of the share, followed by the Rest of North America. The market share is expected to decline for the Rest of North America and gain for the United States with less fluctuation in the coming years. Demand for EVs surged across many countries in North America, resulting in increasing manufacturing facilities. In March 2022, VinFast, a Vietnamese automaker, planned to establish an all-electric SUV plant in Chatham County with an investment of USD 4 billion. In April 2023, Ford announced its new manufacturing hub in Canada, with an investment of USD 1.3 billion. The increase in manufacturing facilities is expected to create more demand for indoor LEDs in the market.
- In 2022, the largest number of startups in the United States focused on retail (15.05%), including brick-and-mortar stores and an e-commerce business. Restaurants and other food-related businesses account for 13.71% of the startups. The increasing number of startups is expected to create more need for indoor LEDs in the region.
- The number of households in the United States grew from 128.45 million to 131.2 million between 2020 and 2022. Further, the number of privately owned dwelling units authorized by building permits in May 2023 was 1,491,000. This is 5.2% more than the April 2023 rate, which was increased from 1,417,000. The number of privately owned homes started in May 2023 was 1,631,000. This is 5.7% above the May 2022 rate of 1,543,000. Thus, the growing number of households and house owners is expected to create more demand for indoor LEDs in the region.
North America Indoor LED Lighting Market Trends
Increase in private-owned dwellings and government policy to drive the market for LED
- In North America, the US and Canada are the main cities in terms of revenue and population. The current population of Northern America is 375.5 million as of June 2023. The United States occupies a major share of the people in this region, accounting for 331 million, followed by Canada at 37.7 million by 2020. 82.6 % of the population lives in urban areas (304.7 million people in 2019). The population in this region is growing with a 0.6% change. Thus, the increase in population is expected to create more LED penetration and increase the need for illumination in the country.
- In Canada and the US, disposable income is high, resulting in rising spending power of individuals and affording more money on new residential spaces. Canada's monthly earnings stood at USD 3,464 in Mar 2023, reduced from USD 3,500 in Feb 2023. Even though it is showing a slight decline in average monthly earnings, it has a high purchasing value compared to other nations, as it is a developed country in North America.
- The number of privately owned dwelling units authorized by building permits in May 2023 was 1,491,000. This is 5.2% more than the April 2023 rate, which was increased from 1,417,000. The number of privately owned homes started in May was 1,631,000. This is 5.7% above the May 2022 rate of 1,543,000 and is 21.7% higher than the revised April estimate of 1,340,000.
- As per the Energy Policy Act (EPAct) section 179D, the maximum tax deduction jumped to USD 5 per sq. ft. of upgraded space in 2023 under the new regulations, which has USD 1.88 per sq. ft. deductions in 2022 (but is set to rise to USD 2.00 per sq. ft.). Eligible projects include interior lighting, HVAC, and building envelopes. Such instances are expected to surge the demand for LED lighting in the region.
Upgradation and replacement of old lamps, increasing government initiatives to promote the use of LED lights
- Each customer type-residential, commercial, and industrial-uses around one-third of the total amount of electricity. The average selling price of a home in Canada climbed by 31.6% Y-o-Y in March 2021. Demand for detached homes in smaller areas increased during the pandemic due to historically low lending rates and a need for more space. However, low mortgage rates and rapid population increase drive a high demand for new homes. Residential building investment increased for 11 consecutive months in March 2021, up 7.6% to CAD 14.0 billion (USD 10.99 billion). The region's LED market is expanding due to the rise in construction activities.
- Electricity demand in the commercial sector tends to be around 8-10 hours. Electricity use in the industrial sector tends not to fluctuate through the day or year. Electricity demand in the residential sector varies for about 7 to 9 hours. The demand for illumination is also rising as there are more roads and highways across the US. In the US, public highway and street building cost an average of USD 89.4 billion per month on average in 2017 and USD 99.9 billion per month on average in 2021. As a result, communities are spending more money to upgrade or replace their old street lighting infrastructure, encouraging the use of LEDs.
- The Canadian government has launched several programs to cut down on the amount of energy used for lighting, including ENERGY STAR in Canada. Furthermore, in March 2021, the Canadian city of Laval approved a plan to upgrade 37,000 lamps to LED luminaires with smart controls. The switch to LED lighting is anticipated to save USD 2.75 million annually. The adoption of LEDs in the area is facilitated by these efforts.
North America Indoor LED Lighting Industry Overview
The North America Indoor LED Lighting Market is fairly consolidated, with the top five companies occupying 75.28%. The major players in this market are ACUITY BRANDS, INC., Current Lighting Solutions, LLC., LEDVANCE GmbH (MLS Co Ltd), Panasonic Holdings Corporation and Signify (Philips) (sorted alphabetically).
Additional Benefits:
- The market estimate (ME) sheet in Excel format
- 3 months of analyst support
TABLE OF CONTENTS
1 EXECUTIVE SUMMARY & KEY FINDINGS
2 REPORT OFFERS
3 INTRODUCTION
- 3.1 Study Assumptions & Market Definition
- 3.2 Scope of the Study
- 3.3 Research Methodology
4 KEY INDUSTRY TRENDS
- 4.1 Population
- 4.2 Per Capita Income
- 4.3 Total Import Of Leds
- 4.4 Lighting Electricity Consumption
- 4.5 # Of Households
- 4.6 Led Penetration
- 4.7 Horticulture Area
- 4.8 Regulatory Framework
- 4.8.1 United States
- 4.9 Value Chain & Distribution Channel Analysis
5 MARKET SEGMENTATION (includes market size in Value in USD and Volume, Forecasts up to 2030 and analysis of growth prospects)
- 5.1 Indoor Lighting
- 5.1.1 Agricultural Lighting
- 5.1.2 Commercial
- 5.1.2.1 Office
- 5.1.2.2 Retail
- 5.1.2.3 Others
- 5.1.3 Industrial and Warehouse
- 5.1.4 Residential
- 5.2 Country
- 5.2.1 United States
- 5.2.2 Rest of North America
6 COMPETITIVE LANDSCAPE
- 6.1 Key Strategic Moves
- 6.2 Market Share Analysis
- 6.3 Company Landscape
- 6.4 Company Profiles (includes Global level Overview, Market level overview, Core Business Segments, Financials, Headcount, Key Information, Market Rank, Market Share, Products and Services, and analysis of Recent Developments)
- 6.4.1 ACUITY BRANDS, INC.
- 6.4.2 Cree LED (SMART Global Holdings, Inc.)
- 6.4.3 Current Lighting Solutions, LLC.
- 6.4.4 Dialight
- 6.4.5 EGLO Leuchten GmbH
- 6.4.6 Feit Electric Company, Inc.
- 6.4.7 LEDVANCE GmbH (MLS Co Ltd)
- 6.4.8 NVC INTERNATIONAL HOLDINGS LIMITED
- 6.4.9 Panasonic Holdings Corporation
- 6.4.10 Signify (Philips)
7 KEY STRATEGIC QUESTIONS FOR LED CEOS
8 APPENDIX
- 8.1 Global Overview
- 8.1.1 Overview
- 8.1.2 Porter's Five Forces Framework
- 8.1.3 Global Value Chain Analysis
- 8.1.4 Market Dynamics (DROs)
- 8.2 Sources & References
- 8.3 List of Tables & Figures
- 8.4 Primary Insights
- 8.5 Data Pack
- 8.6 Glossary of Terms

