
|
시장보고서
상품코드
1683973
미국의 실내 LED 조명 : 시장 점유율 분석, 산업 동향 및 통계, 성장 예측(2025-2030년)US Indoor LED Lighting - Market Share Analysis, Industry Trends & Statistics, Growth Forecasts (2025 - 2030) |
||||||
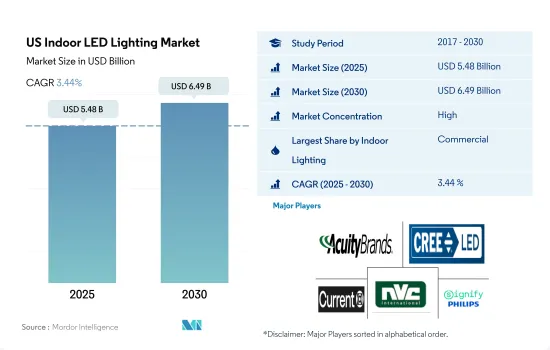
미국의 실내 LED 조명 시장 규모는 2025년에 54억 8,000만 달러에 달할 것으로 추정됩니다. 2030년에는 64억 9,000만 달러에 이를 것으로 예상되며, 예측 기간(2025-2030년)의 CAGR은 3.44%를 나타낼 것으로 전망됩니다.

가처분 소득 증가, 정부 투자, 이 지역의 상업 건축물 증가 등이 LED 조명 시장의 성장을 이끌고 있습니다.
- 금액 점유율에서는 2023년 상업시설이 점유율의 대부분을 차지했고 공업·창고, 주택이 뒤를 이었습니다. 산업 부문의 탄력성 성장에 기여하는 주요 요인은 중국의 노동력 수준 변화, 미국 생산에 대한 규제 부담이 적고, 미국 국내총생산에 대한 제조소득의 활력이 높습니다.
- 2023년의 수량 점유율에서는 상업 부문이 대부분을 차지했고 주택 부문, 산업·창고 부문이 이어졌습니다. 미국의 보관 공간에 대한 요구는 밝은 미래를 향해 진행되고 있습니다. 전자상거래가 가속됨에 따라 창고 산업은 지금까지 이상의 성장 기회를 볼 수 있습니다. 2020년 3분기 미국 소매 전자상거래 매출은 2,095억 달러에 달했습니다. 이는 2019년 3분기에 비해 36.7% 증가한 것입니다.
- 건설 산업은 모든 분야에서 성장 산업입니다. 민간 및 상업 부문의 건설업자, 계약자, 토목기사 등이 포함됩니다. 건설 및 광업 부문의 고용은 2019년부터 2029년까지 4% 증가할 것으로 예상되며, 이는 전체 고용의 평균과 거의 같은 비율입니다. 이 성장의 원동력의 일부는 인구 증가로 인한 새로운 건물, 도로 및 기타 구조물에 대한 수요 증가입니다.
- 2022년 미국 중소기업은 3,320만 사였습니다. 급성장하는 신흥기업 5곳의 본사는 샌프란시스코에 있습니다. 미국 신흥기업의 40%는 적어도 한 명의 여성이 리더십을 취하고 있습니다. 2022년에는 65% 이상의 중소기업이 이익을 계상했습니다. 위와 같은 사례로부터 향후 수년간 실내 LED 수요가 높아질 것으로 예상됩니다.
미국의 실내 LED 조명 시장 동향
개인 소유 주택 수 증가와 정부 규제가 LED 시장을 견인
- 2021년 기준 미국의 가구수는 약 1억 2,400만 가구였습니다. 2017년부터 2021년까지의 가구당 인구는 2.6명으로, 2022년까지 등록된 주택 총수는 1억 4,370만호가 되었습니다. 게다가 2020년 인구는 3억 3,140만 명으로, 2022년에는 3억 3,320만 명으로 증가하여 0.6% 성장을 보였습니다. 또한 소지율은 64.6%로 높았습니다. 위의 사례를 고려하면 가구 규모가 작아지고 새로운 주택이 필요하고 인구가 증가하고 있음을 시사합니다. 이러한 사례로부터 국내 조명 요구에 대한 LED의 보급이 진행될 것으로 예상됩니다. 미국에서는 가처분 소득이 증가하고 있으며, 그 결과 새로운 거주 공간에 더 많은 지출을 할 수 있는 개인의 소비력이 상승하고 있습니다. 미국 1인당 소득은 2020년 12월 33,740.8달러에 비해 2021년 12월 3만 6,430달러에 달했습니다. 다른 개발도상국에 비해 미국은 더 많은 소득을 얻었습니다. 예를 들어, 멕시코의 1인당 소득은 2020년 기준 2,639.7달러, 캐나다는 2만 9,330달러로 낮았습니다.
- 5월의 개인 주택 착공 건수는 연간 기준으로 163만 1,000건이었습니다. 이는 2022년 5월 154.3만호를 5.7% 웃돌고, 2023년 4월 개정치인 134.0만호를 21.7% 웃돈 수치입니다. 에너지정책법(EPAct) 제179D조에 따라 2023년 신규제하에서 최대 세액 공제액은 업그레이드된 공간 1평방피트당 5달러로 뛰어올랐습니다. 2022년에는 평방 피트당 미화 1.88달러가 공제됐습니다. 대상 프로젝트는 실내 조명, 에어컨, 건물 외벽에 관한 것입니다. 이러한 사례로 국내 LED 조명 수요가 더욱 급증할 것으로 예상됩니다.
2025년까지 상업빌딩에서 72%, 주택에서 56%, 산업에서 83%의 LED 설치가 증가하여 LED 시장 성장을 견인
- 미국 주택 및 상업 조명의 총 소비량은 약 2,130억 kWh였습니다. 2017년 대략 14억대 설치된 LED 조명이 2035년에는 79억대 이상으로 증가할 것으로 예측됩니다. 2025년까지 상업시설의 72%, 주택의 56%, 산업 시설의 83%에 LED 조명이 설치될 것으로 예상됩니다. 2021년 미국의 주택호수는 1억 4,200만호로 전년부터 20만호 증가했습니다. 주택 스톡 전체가 1억 4,080만호였던 2020년과 비교하면, 100만호 가까이 증가한 것입니다. LED의 성장은 주택 스톡 증가에 영향을 받는 것으로 보입니다.
- 상업 부문의 전력 수요는 영업 시간 동안 가장 높아지는 경향이 있습니다. 보통 하루에 8-10시간 정도입니다. 산업 부문의 전력 사용량은 하루 또는 일년 내내 변동하지 않는 경향이 있습니다. 주택 부문의 전력 수요는 약 7-9시간 변동합니다. 또한 시카고시는 2022년 2월 '시카고 스마트 조명 프로그램'을 완료하고 28만개 이상의 오래된 가로등을 고효율 LED 조명으로 교체함으로써 야간 시인성을 향상시켜 시카고 납세자가 향후 10년간 1억 달러의 전기 요금을 절약할 것으로 추정하고 있습니다.
- 미시간주 교통부와 Motorway Lighting Partner LLC는 기존 터널 조명 시스템과 고속도로 조명 시스템의 유지 보수 및 개선을 위한 자금 제공, 건설 및 설계를 공동으로 수행하는 15년 계약을 체결했습니다. LED는 에너지 효율과 에너지 절약에 도움을 주며, 국가가 전기 사용료를 절약하는 데 도움이 됩니다.
미국의 실내 LED 조명 산업 개요
미국의 실내 LED 조명 시장은 상당히 통합되어 상위 5개사에서 79.54%를 차지하고 있습니다. 이 시장 주요 기업은 다음과 같습니다. ACUITY BRANDS, INC., Cree LED(SMART Global Holdings, Inc.), Current Lighting Solutions, LLC., NVC INTERNATIONAL HOLDINGS LIMITED and Signify(Philips)(알파벳순 정렬).
기타 혜택
- 엑셀 형식 시장 예측(ME) 시트
- 3개월의 애널리스트 서포트
목차
제1장 주요 요약과 주요 조사 결과
제2장 보고서 제안
제3장 소개
- 조사의 전제조건과 시장 정의
- 조사 범위
- 조사 방법
제4장 주요 산업 동향
- 인구
- 1인당 소득
- LED 총 수입량
- 조명 전력 소비량
- 가구수
- LED 보급률
- 원예 면적
- 규제 프레임워크
- 미국
- 밸류체인과 유통채널 분석
제5장 시장 세분화
- 실내 조명
- 농업용 조명
- 상업용 조명
- 사무실
- 소매
- 기타
- 산업 및 창고
- 주택
제6장 경쟁 구도
- 주요 전략 동향
- 시장 점유율 분석
- 기업 상황
- 기업 프로파일(세계 수준 개요, 시장 수준 개요, 주요 사업 부문, 재무, 직원 수, 주요 정보, 시장 순위, 시장 점유율, 제품 및 서비스, 최근 동향 분석 포함)
- ACUITY BRANDS, INC.
- ams-OSRAM AG
- Cree LED(SMART Global Holdings, Inc.)
- Current Lighting Solutions, LLC.
- Dialight
- EGLO Leuchten GmbH
- Feit Electric Company, Inc.
- LEDVANCE GmbH(MLS Co Ltd)
- NVC INTERNATIONAL HOLDINGS LIMITED
- Signify(Philips)
제7장 CEO에 대한 주요 전략적 질문
제8장 부록
- 세계의 개요
- 개요
- Five Forces 분석 프레임워크
- 세계의 밸류체인 분석
- 시장 역학(DROs)
- 정보원과 참고문헌
- 도표 일람
- 주요 인사이트
- 데이터 팩
- 용어집
The US Indoor LED Lighting Market size is estimated at 5.48 billion USD in 2025, and is expected to reach 6.49 billion USD by 2030, growing at a CAGR of 3.44% during the forecast period (2025-2030).
The increasing disposable income, government investments, and rising commercial construction in the region drive the growth of led lighting market
- In terms of value share, in 2023, commercial accounted for the majority of the share, followed by industrial and warehouse, and residential. The main factors contributing to the growth of the industrial sector's resilience are changes in labor force levels in China, less regulatory burden for US production than European counterparts, and greater vitality of manufacturing income relative to the United States Gross Domestic Product.
- In terms of volume share, in 2023, commercial accounted for the majority of the share, followed by the residential sector and industrial and warehouse sector. America's need for storage space is advancing toward a brighter future. With the acceleration of e-commerce, the warehousing industry may see more growth opportunities than ever. The US retail e-commerce sales in Q3 2020 are estimated at USD 209.5 billion. This is a 36.7% increase over Q3 2019.
- The construction industry is a growth industry in all areas. These include builders, contractors, and civil engineers in the private and commercial sectors. Employment in the construction and mining sector is expected to increase by 4% from 2019 to 2029, about the same rate as the average for all jobs. Part of the driver of this growth is the increasing demand for new buildings, roads, and other structures due to population growth.
- In 2022, there were 33.2 million small businesses in the United States. The five fast-growing startups are headquartered in San Francisco. 40% of US startups have at least one woman in leadership. Over 65% of small businesses reported profits in 2022. The above instances are expected to create more demand for Indoor LEDs in the coming years.
US Indoor LED Lighting Market Trends
Increase in the number of private-owned dwellings and government regulations to drive the market for LEDs
- As of 2021, there were around 124 million households in the United States. Person per household between 2017 and 2021 was 2.6 persons, and the total housing units registered were 143.7 million by 2022. Furthermore, the population in 2020 was 331.4 million, which increased to 333.2 million by 2022, representing 0.6% growth. The owner-occupied housing unit rate was 64.6%, which is higher. Considering the above instances, it suggested that the household size is smaller and requires new housing units, and the population is growing, which also represents the same. Such instances are expected to create more LED penetration for the need for illumination in the country. In the United States, disposable income is growing, resulting in the rising spending power of individuals who can spend more on new residential spaces. The United States per Capita income reached USD 36,430 in December 2021, compared with USD 33,740.8 in December 2020. Compared to other developing nations, the US is getting more. For instance, Mexico had a per capita income of USD 2,639.7 as of 2020, and Canada had USD 29,330, which is lower.
- The number of privately owned home starts in May was 1,631,000 on an annual basis. This is 5.7% above the May 2022 rate of 1,543,000 and is 21.7% higher than the revised April 2023 estimate of 1,340,000. As per the Energy Policy Act (EPAct) section 179D, the maximum tax deduction jumped to USD 5 per sq. ft. of upgraded space in 2023 under the new regulations. Which had USD 1.88 per sq. ft. deductions in 2022 (but is set to rise to USD 2.00 per sq. ft.). Eligible projects include those related to interior lighting, HVAC, and building envelopes. Such instances are further expected to surge the demand for LED lighting in the country.
Increase in LED installation by 72% in commercial buildings, 56% in residential houses, and 83% in industries by 2025 to drive the growth of the LED market
- The combined consumption of residential and commercial lighting in the United States was roughly 213 billion kWh. From roughly 1.4 billion units installed in 2017 to over 7.9 billion units in 2035, the number of LED light installations in the US is rising. By 2025, 72% of commercial, 56% of residential, and 83% of industrial structures are expected to have LED lighting installed. There were 142 million housing units in the US in 2021, an increase of 200,000 from the previous year. In comparison to 2020, when the entire housing stock stood at 140.8 million units, there represented an increase of nearly one million. The growth of LED will be influenced by the rise in housing stock.
- Electricity demand in the commercial sector tends to be highest during operating business hours. Usually, in a day, it is around 8-10 hours. Electricity use in the industrial sector tends not to fluctuate through the day or year. Electricity demand in the residential sector varies for about 7 to 9 hours. In addition, the City of Chicago completed the Chicago Smart Lighting Programme in February 2022, which replaced more than 280,000 outdated streetlights with high-efficiency LED lights to improve visibility at night and save Chicago taxpayers an estimated USD 100 million in electricity costs over the next ten years.
- The Michigan Department of Transportation and Motorway Lighting Partner LLC entered a 15-year deal to jointly fund, construct, and design upgrades to existing tunnel lighting systems and motorways for the maintenance of the existing and improved lighting systems. LEDs can help with energy efficiency and conservation, which helps the nation's citizens save money on electricity use.
US Indoor LED Lighting Industry Overview
The US Indoor LED Lighting Market is fairly consolidated, with the top five companies occupying 79.54%. The major players in this market are ACUITY BRANDS, INC., Cree LED (SMART Global Holdings, Inc.), Current Lighting Solutions, LLC., NVC INTERNATIONAL HOLDINGS LIMITED and Signify (Philips) (sorted alphabetically).
Additional Benefits:
- The market estimate (ME) sheet in Excel format
- 3 months of analyst support
TABLE OF CONTENTS
1 EXECUTIVE SUMMARY & KEY FINDINGS
2 REPORT OFFERS
3 INTRODUCTION
- 3.1 Study Assumptions & Market Definition
- 3.2 Scope of the Study
- 3.3 Research Methodology
4 KEY INDUSTRY TRENDS
- 4.1 Population
- 4.2 Per Capita Income
- 4.3 Total Import Of Leds
- 4.4 Lighting Electricity Consumption
- 4.5 # Of Households
- 4.6 Led Penetration
- 4.7 Horticulture Area
- 4.8 Regulatory Framework
- 4.8.1 United States
- 4.9 Value Chain & Distribution Channel Analysis
5 MARKET SEGMENTATION (includes market size in Value in USD and Volume, Forecasts up to 2030 and analysis of growth prospects)
- 5.1 Indoor Lighting
- 5.1.1 Agricultural Lighting
- 5.1.2 Commercial
- 5.1.2.1 Office
- 5.1.2.2 Retail
- 5.1.2.3 Others
- 5.1.3 Industrial and Warehouse
- 5.1.4 Residential
6 COMPETITIVE LANDSCAPE
- 6.1 Key Strategic Moves
- 6.2 Market Share Analysis
- 6.3 Company Landscape
- 6.4 Company Profiles (includes Global level Overview, Market level overview, Core Business Segments, Financials, Headcount, Key Information, Market Rank, Market Share, Products and Services, and analysis of Recent Developments)
- 6.4.1 ACUITY BRANDS, INC.
- 6.4.2 ams-OSRAM AG
- 6.4.3 Cree LED (SMART Global Holdings, Inc.)
- 6.4.4 Current Lighting Solutions, LLC.
- 6.4.5 Dialight
- 6.4.6 EGLO Leuchten GmbH
- 6.4.7 Feit Electric Company, Inc.
- 6.4.8 LEDVANCE GmbH (MLS Co Ltd)
- 6.4.9 NVC INTERNATIONAL HOLDINGS LIMITED
- 6.4.10 Signify (Philips)
7 KEY STRATEGIC QUESTIONS FOR LED CEOS
8 APPENDIX
- 8.1 Global Overview
- 8.1.1 Overview
- 8.1.2 Porter's Five Forces Framework
- 8.1.3 Global Value Chain Analysis
- 8.1.4 Market Dynamics (DROs)
- 8.2 Sources & References
- 8.3 List of Tables & Figures
- 8.4 Primary Insights
- 8.5 Data Pack
- 8.6 Glossary of Terms

