


|
시장보고서
상품코드
1684033
일반 포틀랜드 시멘트 : 시장 점유율 분석, 산업 동향, 성장 예측(2025-2030년)Ordinary Portland Cement - Market Share Analysis, Industry Trends & Statistics, Growth Forecasts (2025 - 2030) |
||||||
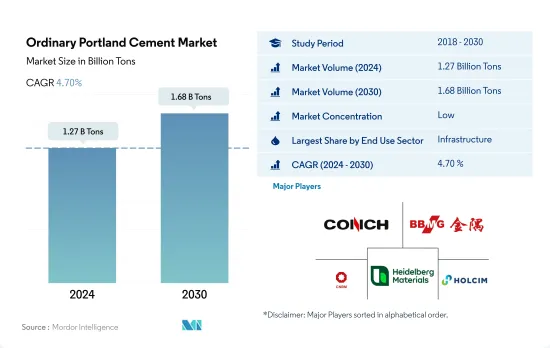
일반 포틀랜드 시멘트 시장 규모는 2024년에 12억 7,000만 톤으로 추정되고, 2030년에는 16억 8,000만 톤에 이르고, 예측 기간 중(2024-2030년)의 CAGR은 4.70%를 나타낼 것으로 예측됩니다.

인프라 지출 증가로 일반 포틀랜드 시멘트 수요 증가 전망
- 2022년 전 세계 시멘트 시장은 일반 포틀랜드 시멘트(OPC)가 29.18%의 시장 점유율을 차지하며 우위를 점했습니다. 2023년에는 주거 및 인프라 건설 부문의 수요 증가에 힘입어 OPC 소비량이 0.81% 증가할 것으로 예상됩니다.
- 2022년에는 인프라가 시장의 거의 절반(47.91%)을 차지하며 OPC의 주요 소비처로 부상했습니다. 2023년 전 세계 인프라 지출은 투자 증가에 힘입어 2조 7,800억 달러에 달할 것으로 예상됩니다. 특히 미국은 인프라 투자 및 일자리 법에 따른 5,500억 달러를 포함하여 2025년까지 1조 2,000억 달러를 배정할 계획입니다. 이 자금은 도로, 교량, 철도, 스마트 인프라, 광대역, 전기 자동차 등 다양한 프로젝트에 투입될 예정입니다. 이에 따라 인프라 부문의 OPC 수요는 2023년 5억 7,676만 톤에서 2030년 7억 7,892만 톤으로 급증할 것으로 예상됩니다.
- 상업 부문은 예측 기간 동안 6.30%의 강력한 연평균 성장률을 기록하며 가장 빠르게 성장하는 OPC 소비자가 될 것입니다. 쇼핑몰, 사무실 및 기타 상업 시설에 대한 수요 증가로 인해 2024년 전 세계 상업용 공간의 신규 연면적은 3억 100만 평방 피트 증가할 것으로 예측됩니다. 예를 들어 인도네시아에서는 2025년까지 6개의 쇼핑몰 프로젝트가 완성될 예정이며 총 면적은 29만 2,000제곱미터에 이릅니다. 그 결과 세계 OPC 수요는 2030년까지 2023년 수준에서 5,652만톤 증가할 것으로 예상됩니다.
중동 및 아프리카는 예측 기간 동안 일반 포틀랜드 시멘트 소비량 측면에서 선두를 차지할 것으로 예상
- 2022년 전 세계 일반 포틀랜드 시멘트 소비량은 전년 대비 3.14% 감소했습니다. 이러한 감소는 주로 아시아 태평양 지역의 소비가 5.72% 감소한 데 따른 것입니다. 건설 업계는 치솟는 인플레이션, 원자재 가격 급등, 임박한 경기 침체라는 역풍에 직면했습니다. 이러한 요인들은 투자 감소 및 프로젝트 지연과 맞물려 일반 포틀랜드 시멘트 수요에 부담을 주었습니다. 그러나 2023년에는 소비가 0.81% 증가하면서 완만한 반등을 보일 것으로 예상했습니다. 이러한 상승세는 주로 유럽에서 5.69% 증가할 것으로 예상되는 수요에 의해 주도됩니다.
- 아시아태평양 지역은 2022년 전 세계 수요의 70.71%를 차지하며 일반 포틀랜드 시멘트의 주요 소비 지역으로 부상했습니다. 특히 중국, 일본, 인도와 같은 국가들이 이러한 수요를 형성하는 데 중추적인 역할을 했습니다. 중국 운송 인프라 투자는 2021년 1,576억 달러에서 2022년 1,656억 달러로 증가했습니다. 일본은 제조 시설 건설이 급증했으며, 인도는 도로, 철도, 고속도로 프로젝트를 통해 연결성을 강화하는 데 주력했습니다.
- 중동 및 아프리카는 예측 기간 동안 6.98%의 연평균 성장률을 기록하며 일반 포틀랜드 시멘트 소비가 가장 빠르게 증가할 것으로 예상됩니다. 아랍에미리트는 2021년부터 2022년까지 인프라 투자가 82% 급증하면서 두각을 나타냈습니다. 2022년 사우디아라비아와 아랍에미리트는 각각 전 세계 소비의 11%와 3%를 차지할 것으로 예상됩니다. 특히 사우디아라비아의 야심찬 비전 2030과 약 26억 6,000만 달러 규모의 투자 기금을 포함한 협약은 상업, 관광 및 주거 프로젝트 개발에 대한 사우디아라비아의 의지를 잘 보여줍니다.
세계의 일반 포틀랜드 시멘트 시장 동향
아시아태평양의 대규모 오피스 빌딩 프로젝트 급증으로 전 세계 상업용 건축 연면적 증가 전망
- 2022년 전 세계 상업용 신축 연면적은 전년 대비 0.15%의 완만한 성장세를 보였습니다. 유럽은 2030년 탄소 배출량 목표를 달성하기 위해 에너지 효율이 높은 오피스 빌딩을 추진하면서 12.70%의 큰 폭의 증가율을 기록해 눈에 띄었습니다. 직원들이 사무실로 복귀하면서 임대 결정을 재개한 유럽 기업들은 2022년에 450만 평방피트의 신규 오피스 공간 건설에 박차를 가했습니다. 이러한 모멘텀은 2023년에도 지속될 것으로 예상되며, 전 세계적으로 4.26%의 성장률이 예상됩니다.
- 코로나19 팬데믹으로 인해 인력과 자재 부족이 발생하면서 상업용 건설 프로젝트가 취소되거나 지연되었습니다. 그러나 봉쇄 조치가 완화되고 건설 활동이 재개되면서 2021년 전 세계 상업용 신축 연면적은 11.11% 증가했으며, 아시아태평양이 20.98%의 성장률로 선두를 차지했습니다.
- 향후 전 세계 상업용 신축 연면적은 4.56%의 연평균 성장률을 달성할 것으로 전망됩니다. 아시아 태평양 지역은 5.16%의 연평균 성장률로 다른 지역을 앞설 것으로 예상됩니다. 이러한 성장은 중국, 인도, 한국, 일본에서 상업용 건설 프로젝트가 급증한 데 힘입은 결과입니다. 특히 베이징, 상하이, 홍콩, 타이베이와 같은 중국의 주요 도시에서는 A등급 오피스 공간 건설이 증가할 것으로 예상됩니다. 또한 인도는 2023년부터 2025년까지 상위 7개 도시에 약 2,325만 평방 피트에 이르는 약 60개의 쇼핑몰이 오픈할 예정입니다. 아시아태평양 전역의 이러한 노력을 합산하면 2030년까지 상업시설의 신규 바닥면적은 2022년 대비 15억 6,000만 평방피트 증가할 것으로 예상됩니다.
남미는 전 세계 주거 부문을 활성화하기 위한 정부의 저렴한 주택 공급 계획에 대한 투자 증가로 인해 주거용 건축이 가장 빠르게 성장할 것으로 예상
- 2022년 전 세계 주거용 신축 연면적은 2021년에 비해 약 2억 8,900만 평방피트 감소했습니다. 이는 토지 부족, 노동력 부족, 건축자재 가격의 지속 불가능한 급등으로 인한 주택 위기 때문입니다. 이는 토지, 노동력 부족, 지속 불가능한 높은 건축 자재 가격 등으로 인해 발생한 주택 위기의 원인으로 볼 수 있습니다. 이러한 위기는 아시아태평양 지역에 심각한 영향을 미쳤으며, 2021년 대비 2022년 신규 연면적이 5.39% 감소했습니다. 그러나 2023년에는 2030년까지 30억 명을 수용할 수 있는 저렴한 신규 주택 건설에 자금을 지원할 수 있는 정부 투자로 인해 전 세계 신규 연면적이 2022년에 비해 3.31% 증가할 것으로 예상됨에 따라 보다 긍정적인 전망이 예상됩니다.
- 코로나19 팬데믹으로 인한 경기 침체로 많은 주택 건설 프로젝트가 취소되거나 지연되면서 2020년 전 세계 신규 연면적은 2019년에 비해 4.79% 감소했습니다. 2021년에는 제한이 해제되고 주택 프로젝트에 대한 억눌린 수요가 풀리면서 2020년 대비 11.22% 증가했으며, 유럽이 18.28%로 가장 높은 성장률을 보였고 남미가 2020년 대비 2021년 17.36% 증가하며 그 뒤를 이었습니다.
- 전 세계 주거용 신축 연면적은 예측 기간 동안 3.81%의 연평균 성장률을 기록할 것으로 예상되며, 남미는 4.05%의 가장 빠른 연평균 성장률로 발전할 것으로 예측됩니다. 2023년에 발표된 브라질의 민하 카사 민하 비다와 같은 제도와 이니셔티브는 몇 가지 규제 변경을 통해 저소득층에게 저렴한 주택을 제공하기 위해 정부가 19억 8,000만 달러를 투자할 계획이며, 2023년에 발표된 칠레의 FOGAES도 5천만 달러의 초기 투자로 저렴한 주택을 위해 가정에 모기지 대출을 제공하고 새로운 주택 건설을 장려할 계획입니다.
일반 포틀랜드 시멘트 산업 개요
일반 포틀랜드 시멘트 시장은 세분화되어 상위 5개사에서 34.16%를 차지하고 있습니다. 이 시장 주요 기업은 다음과 같습니다. Anhui Conch Cement Company Limited, BBMG Corporation, China National Building Material Group Corporation, Heidelberg Materials and Holcim.
기타 혜택
- 엑셀 형식 시장 예측(ME) 시트
- 3개월의 애널리스트 지원
목차
제1장 주요 요약과 주요 조사 결과
제2장 보고서 제안
제3장 소개
- 조사의 전제조건과 시장 정의
- 조사 범위
- 조사 방법
제4장 주요 산업 동향
- 최종 용도 분야의 동향
- 상업용
- 산업 및 기관
- 인프라
- 주거용
- 주요 인프라 프로젝트(현재 및 발표됨)
- 규제 프레임워크
- 밸류체인과 유통채널 분석
제5장 시장 세분화
- 최종 용도 섹터
- 상업용
- 산업 및 기관
- 인프라
- 주거용
- 지역
- 아시아태평양
- 국가별
- 호주
- 중국
- 인도
- 인도네시아
- 일본
- 말레이시아
- 한국
- 태국
- 베트남
- 기타 아시아태평양
- 유럽
- 국가별
- 프랑스
- 독일
- 이탈리아
- 러시아
- 스페인
- 영국
- 기타 유럽
- 중동 및 아프리카
- 국가별
- 사우디아라비아
- 아랍에미리트(UAE)
- 기타 중동 및 아프리카
- 북미
- 국가별
- 캐나다
- 멕시코
- 미국
- 남미
- 국가별
- 아르헨티나
- 브라질
- 기타 남미
- 아시아태평양
제6장 경쟁 구도
- 주요 전략 동향
- 시장 점유율 분석
- 기업 상황
- 기업 프로파일
- Anhui Conch Cement Company Limited
- BBMG Corporation
- CEMEX, SAB de CV
- China National Building Material Group Corporation
- Dangote Cement Plc.
- Heidelberg Materials
- Holcim
- SIG
- UltraTech Cement Ltd.
- Votorantim Cimentos
제7장 CEO에 대한 주요 전략적 질문 CEO에 대한 주요 전략적 질문
제8장 부록
- 세계 개요
- 개요
- Five Forces 분석 프레임워크(산업 매력도 분석)
- 세계의 밸류체인 분석
- 시장 역학(DROs)
- 출처 및 참고문헌
- 도표 일람
- 주요 인사이트
- 데이터 팩
- 용어집
The Ordinary Portland Cement Market size is estimated at 1.27 billion Tons in 2024, and is expected to reach 1.68 billion Tons by 2030, growing at a CAGR of 4.70% during the forecast period (2024-2030).
Rising infrastructure spending is likely to drive the demand for ordinary Portland cement
- In 2022, the global cement market saw ordinary Portland cement (OPC) dominate, capturing a significant 29.18% market share. The consumption of OPC was projected to grow by 0.81% in 2023, driven by rising demand from the residential and infrastructure construction sectors.
- Infrastructure emerged as the leading consumer of OPC in 2022, accounting for nearly half (47.91%) of the market. Global infrastructure spending was set to hit USD 2.78 trillion in 2023, buoyed by increased investments. Notably, the United States plans to allocate USD 1.2 trillion by 2025, including USD 550 billion from the Infrastructure Investment and Jobs Act. These funds will be channeled into diverse projects like roads, bridges, rail, smart infrastructure, broadband, and electric vehicles. Consequently, OPC demand for the infrastructure sector is projected to surge from 576.76 million tons in 2023 to 778.92 million tons in 2030.
- The commercial segment is poised to be the fastest-growing consumer of OPC, with a robust CAGR of 6.30% during the forecast period. The global new floor area for commercial spaces is projected to rise by 301 million sq. ft in 2024, driven by heightened demand for shopping malls, offices, and other commercial establishments. For instance, Indonesia has six shopping mall projects slated for completion by 2025, adding up to a combined area of 292 thousand sq. meters. Consequently, the global OPC demand for the commercial sector is anticipated to climb by 56.52 million tons by 2030, compared to the levels seen in 2023.
The Middle East & Africa is expected to lead in terms of consumption volume of ordinary Portland cement during the forecast period
- In 2022, the global consumption of ordinary Portland cement dipped by 3.14% compared to the previous year. This decline was largely driven by a 5.72% drop in consumption from Asia-Pacific. The construction industry faced headwinds, grappling with surging inflation, soaring raw material prices, and an impending recession. These factors, coupled with a pullback in investments and project delays, weighed on the demand for ordinary Portland cement. However, in 2023, they anticipated a modest rebound, with consumption projected to inch up by 0.81%. This uptick is primarily driven by a projected 5.69% surge in demand from Europe.
- Asia-Pacific emerged as the dominant consumer of ordinary Portland cement in 2022, accounting for a significant 70.71% of the global demand. Notably, countries like China, Japan, and India played pivotal roles in shaping this demand. China's investment in transport infrastructure rose from USD 157.6 billion in 2021 to USD 165.6 billion in 2022. Japan witnessed a surge in manufacturing facility constructions, while India focused on bolstering its connectivity through road, rail, and highway projects.
- The Middle East & Africa is poised to witness the swiftest growth in ordinary Portland cement consumption, with a projected CAGR of 6.98% during the forecast period. The United Arab Emirates stood out, with an 82% surge in infrastructure investments from 2021 to 2022. In 2022, Saudi Arabia and the UAE accounted for 11% and 3% of global consumption, respectively. Notably, Saudi Arabia's ambitious Vision 2030 and its agreements, including those worth nearly USD 2.66 billion for investment funds, underscore its commitment to developing commercial, tourism, and residential projects.
Global Ordinary Portland Cement Market Trends
Asia-Pacific's surge in large-scale office building projects is set to elevate the global floor area dedicated to commercial construction
- In 2022, the global new floor area for commercial construction witnessed a modest growth of 0.15% from the previous year. Europe stood out with a significant surge of 12.70%, driven by a push for high-energy-efficient office buildings to align with its 2030 carbon emission targets. As employees returned to offices, European companies, resuming lease decisions, spurred the construction of 4.5 million square feet of new office space in 2022. This momentum is poised to persist in 2023, with a projected global growth rate of 4.26%.
- The COVID-19 pandemic caused labor and material shortages, leading to cancellations and delays in commercial construction projects. However, as lockdowns eased and construction activities resumed, the global new floor area for commercial construction surged by 11.11% in 2021, with Asia-Pacific taking the lead with a growth rate of 20.98%.
- Looking ahead, the global new floor area for commercial construction is set to achieve a CAGR of 4.56%. Asia-Pacific is anticipated to outpace other regions, with a projected CAGR of 5.16%. This growth is fueled by a flurry of commercial construction projects in China, India, South Korea, and Japan. Notably, major Chinese cities like Beijing, Shanghai, Hong Kong, and Taipei are gearing up for an uptick in Grade A office space construction. Additionally, India is set to witness the opening of approximately 60 shopping malls, spanning 23.25 million square feet, in its top seven cities between 2023 and 2025. Collectively, these endeavors across Asia-Pacific are expected to add a staggering 1.56 billion square feet to the new floor area for commercial construction by 2030, compared to 2022.
South America's estimated fastest growth in residential constructions due to increasing government investments in schemes for affordable housing to boost the global residential sector
- In 2022, the global new floor area for residential construction declined by around 289 million square feet compared to 2021. This can be attributed to the housing crisis generated due to the shortage of land, labor, and unsustainably high construction materials prices. This crisis severely impacted Asia-Pacific, where the new floor area declined 5.39% in 2022 compared to 2021. However, a more positive outlook is expected in 2023 as the global new floor area is predicted to grow by 3.31% compared to 2022, owing to government investments that can finance the construction of new affordable homes capable of accommodating 3 billion people by 2030.
- The COVID-19 pandemic caused an economic slowdown, due to which many residential construction projects got canceled or delayed, and the global new floor area declined by 4.79% in 2020 compared to 2019. As the restrictions were lifted in 2021 and pent-up demand for housing projects was released, new floor area grew 11.22% compared to 2020, with Europe having the highest growth of 18.28%, followed by South America, which rose 17.36% in 2021 compared to 2020.
- The global new floor area for residential construction is expected to register a CAGR of 3.81% during the forecast period, with South America predicted to develop at the fastest CAGR of 4.05%. Schemes and initiatives like the Minha Casa Minha Vida in Brazil announced in 2023 with a few regulatory changes, for which the government plans an investment of USD 1.98 billion to provide affordable housing units for low-income families, and the FOGAES in Chile also publicized in 2023, with an initial investment of USD 50 million, are aimed at providing mortgage loans to families for affordable housing and will encourage the construction of new residential units.
Ordinary Portland Cement Industry Overview
The Ordinary Portland Cement Market is fragmented, with the top five companies occupying 34.16%. The major players in this market are Anhui Conch Cement Company Limited, BBMG Corporation, China National Building Material Group Corporation, Heidelberg Materials and Holcim (sorted alphabetically).
Additional Benefits:
- The market estimate (ME) sheet in Excel format
- 3 months of analyst support
TABLE OF CONTENTS
1 EXECUTIVE SUMMARY & KEY FINDINGS
2 REPORT OFFERS
3 INTRODUCTION
- 3.1 Study Assumptions & Market Definition
- 3.2 Scope of the Study
- 3.3 Research Methodology
4 KEY INDUSTRY TRENDS
- 4.1 End Use Sector Trends
- 4.1.1 Commercial
- 4.1.2 Industrial and Institutional
- 4.1.3 Infrastructure
- 4.1.4 Residential
- 4.2 Major Infrastructure Projects (current And Announced)
- 4.3 Regulatory Framework
- 4.4 Value Chain & Distribution Channel Analysis
5 MARKET SEGMENTATION (includes market size, forecasts up to 2030 and analysis of growth prospects.)
- 5.1 End Use Sector
- 5.1.1 Commercial
- 5.1.2 Industrial and Institutional
- 5.1.3 Infrastructure
- 5.1.4 Residential
- 5.2 Region
- 5.2.1 Asia-Pacific
- 5.2.1.1 By Country
- 5.2.1.1.1 Australia
- 5.2.1.1.2 China
- 5.2.1.1.3 India
- 5.2.1.1.4 Indonesia
- 5.2.1.1.5 Japan
- 5.2.1.1.6 Malaysia
- 5.2.1.1.7 South Korea
- 5.2.1.1.8 Thailand
- 5.2.1.1.9 Vietnam
- 5.2.1.1.10 Rest of Asia-Pacific
- 5.2.2 Europe
- 5.2.2.1 By Country
- 5.2.2.1.1 France
- 5.2.2.1.2 Germany
- 5.2.2.1.3 Italy
- 5.2.2.1.4 Russia
- 5.2.2.1.5 Spain
- 5.2.2.1.6 United Kingdom
- 5.2.2.1.7 Rest of Europe
- 5.2.3 Middle East and Africa
- 5.2.3.1 By Country
- 5.2.3.1.1 Saudi Arabia
- 5.2.3.1.2 United Arab Emirates
- 5.2.3.1.3 Rest of Middle East and Africa
- 5.2.4 North America
- 5.2.4.1 By Country
- 5.2.4.1.1 Canada
- 5.2.4.1.2 Mexico
- 5.2.4.1.3 United States
- 5.2.5 South America
- 5.2.5.1 By Country
- 5.2.5.1.1 Argentina
- 5.2.5.1.2 Brazil
- 5.2.5.1.3 Rest of South America
- 5.2.1 Asia-Pacific
6 COMPETITIVE LANDSCAPE
- 6.1 Key Strategic Moves
- 6.2 Market Share Analysis
- 6.3 Company Landscape
- 6.4 Company Profiles
- 6.4.1 Anhui Conch Cement Company Limited
- 6.4.2 BBMG Corporation
- 6.4.3 CEMEX, S.A.B. de C.V.
- 6.4.4 China National Building Material Group Corporation
- 6.4.5 Dangote Cement Plc.
- 6.4.6 Heidelberg Materials
- 6.4.7 Holcim
- 6.4.8 SIG
- 6.4.9 UltraTech Cement Ltd.
- 6.4.10 Votorantim Cimentos
7 KEY STRATEGIC QUESTIONS FOR CONCRETE, MORTARS AND CONSTRUCTION CHEMICALS CEOS
8 APPENDIX
- 8.1 Global Overview
- 8.1.1 Overview
- 8.1.2 Porter's Five Forces Framework (Industry Attractiveness Analysis)
- 8.1.3 Global Value Chain Analysis
- 8.1.4 Market Dynamics (DROs)
- 8.2 Sources & References
- 8.3 List of Tables & Figures
- 8.4 Primary Insights
- 8.5 Data Pack
- 8.6 Glossary of Terms
