|
시장보고서
상품코드
1684057
아시아태평양의 시멘트 시장 : 시장 점유율 분석, 산업 동향, 성장 예측(2025-2030년)Asia-Pacific Cement - Market Share Analysis, Industry Trends & Statistics, Growth Forecasts (2025 - 2030) |
||||||
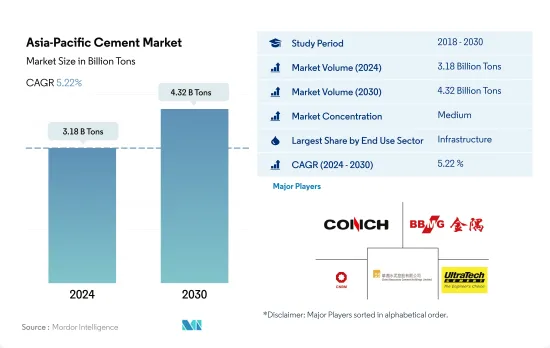
아시아태평양의 시멘트 시장 규모는 2024년에 31억 8,000만 톤으로 평가되었고, 2030년에는 43억 2,000만 톤에 이를 전망이며, 예측 기간(2024-2030년) 중 CAGR 5.22%로 성장할 것으로 예측됩니다.
아시아태평양의 인프라 지출은 1조 7,400억 달러에 달할 것으로 예상되며 시멘트 수요를 견인할 가능성이 높습니다.
- 2022년 이 지역의 시멘트 소비량은 전년대비 6.37% 감소했습니다. 이 감소는 주로 상업, 주택, 산업 및 시설 부문의 신규 바닥 면적 감소로 인한 것입니다. 특히 산업 및 시설 부문과 주택 부문의 2022년 신규 바닥 면적은 2021년에 비해 각각 5.63%와 5.39% 감소했습니다. 2023년까지 아시아태평양은 세계 시멘트 시장의 약 72.53%를 차지했습니다.
- 인프라 부문이 이 지역 최대의 시멘트 소비자로서 부상해, 2022년에는 약 39.48%를 차지했습니다. 인프라 사업에 대한 투자가 증가함에 따라 이 분야의 시멘트 수요는 증가할 것으로 예상됩니다. 예를 들어 인도는 2030년까지 4조 5,000억 달러의 인프라 투자를 목표로 하고 있습니다. 예측에 따르면 이 지역 인프라 투자는 2030년까지 1조 7,400억 달러에 이를 전망이며, 시멘트 부문은 2023년부터 2030년까지 16.03%로 성장할 전망입니다.
- 상업 부문은 예측 기간 동안 CAGR이 6.48%로 예측되며 이 지역에서 가장 빠르게 성장하는 시멘트 소비자가 됩니다. 이 지역에서는 쇼핑몰, 사무실 등 상업 공간 수요가 크게 증가할 전망입니다. 2025년에는 전년 대비 1억 7,800만 평방피트의 상업층 면적이 새롭게 추가될 것으로 추정되며, 이 지역은 현저하게 급증할 것으로 예상됩니다. 예를 들어 인도네시아에서는 2025년까지 6개의 쇼핑몰 프로젝트가 완성될 예정이며 총 면적은 29만 2,000제곱미터에 이를 전망입니다. 이러한 동향에서 이 지역의 상업용 시멘트 시장은 2022년 약 3억 3,600만 톤에서 2030년에는 5억 2,300만 톤에 이를 것으로 보입니다.
베트남이 가장 급성장하는 국가인 반면, 중국은 예측 기간 동안에도 아시아태평양의 최고 자리를 유지할 것으로 예상됩니다.
- 2022년 아시아태평양의 시멘트 수요는 전년대비 6.4% 감소했지만 이는 주로 이 지역의 패자인 중국 수요가 11.3% 감소한 것에 따릅니다. 이 지역의 일부 국가에서는 2023년 수요가 약간 떨어진 것으로 평가되었으며, 전체 성장은 2022년 대비 -0.4%로 음수가 될 것으로 예측됩니다.
- 항상 높은 건설 생산량을 자랑하는 중국은 아시아태평양 최대 시멘트 소비국입니다. 특히 2022년에는 인프라 부문에서만 아시아태평양의 시멘트 총 수요의 79%를 차지했습니다. 그러나 중국의 시멘트 수요는 부동산업계의 과제 및 신규 인프라 프로젝트의 감소에 따라 예측 기간 중 2023년부터 2030년까지 감소할 것으로 예상됩니다.
- 중국에 이어 인도는 아시아태평양에서 두 번째로 큰 시멘트 소비국으로 부상하고 있습니다. 인도의 주택 부문은 시멘트 수요의 주요 점유율을 차지하며 2022년에는 부문 전체 수요의 61%를 차지했습니다. 다른 지역과 달리 인도에서는 건축물을 주로 콘크리트에 의존하기 때문에 시멘트 수요가 증가하고 있습니다.
- 이 지역 국가들 중 베트남은 시멘트 수요의 가장 높은 성장률을 보일 것으로 예상되며, 예측 기간 동안 수량 기준으로 7.46%의 연평균 복합 성장률(CAGR)을 나타낼 것으로 예상됩니다. 이 수요의 급증은 부동산 개발을 뒷받침하는 새로운 토지 정책과 2030년까지 100만 호의 저렴한 주택을 건설하는 정부의 야심적인 계획에 기인하고 있는 것으로 보입니다.
아시아태평양의 시멘트 시장 동향
인도 등에서 소매점과 사무실 공간이 증가하고 아시아태평양의 상업 건설 분야를 뒷받침
- 2022년 아시아태평양 상업 시설의 신규 바닥 면적은 전년 대비 3.23% 감소했습니다. 이 후퇴는 규제의 압력, 인플레이션율의 상승, 모기지 금리 급상승 등의 요인에 의한 것입니다. 2023년에는 이 지역이 회복되었고 상업 시설의 신규 바닥 면적은 약 1억 4,600만 평방 피트 증가했습니다. 이 급증은 주로 외국 직접투자(FDI) 증가로 인한 것으로, 새로운 오피스, 창고, 소매점, 기타 시설 수요에 박차를 가했습니다. 특히 베트남 건설 부문은 2023년 7,144만 달러의 FDI 자본을 유치했습니다.
- 2020년 아시아태평양은 상업 시설의 신규 바닥 면적에서 대폭적인 후퇴를 경험해 2019년 대비 21.92%의 수량 감소가 되었습니다. 이 감소의 주요 원인은 정부의 봉쇄가 확산되고 프로젝트 작업이 중단되었으며 공급망, 장비 및 노동력에 심각한 영향을 미쳤다는 것입니다. 그러나 규제가 완화됨에 따라 이 지역은 눈부신 회복을 보였으며 2021년 상업 시설의 신규 바닥 면적은 20.98% 급증하여 약 5억 2,600만 평방 피트의 바닥 면적에 이르렀습니다.
- 아시아태평양의 상업용 신규 바닥 면적은 크게 성장할 것으로 예상되며, 2023년에 비해 2030년에는 14억 1,000만 평방 피트 증가할 것으로 추정됩니다. 이러한 급증은 쇼핑몰, 오피스 스페이스, 소매점 등에 대한 수요 증가에 힘입어지고 있습니다. 아시아태평양은 세계 소매 대국으로 부상하고 있으며 세계 소매 성장의 4분의 3에 기여하고 있습니다. 예를 들어, 인도의 등급 A 오피스 시장은 상위 7개 도시에서 2026년까지 10억 평방 피트, 2030년까지 12억 평방 피트로 확장될 수 있습니다. 전반적으로 아시아태평양 상업 시설의 신규 바닥 면적은 예측 기간 동안 CAGR 5.16%를 나타낼 것으로 예상됩니다.
인도에서는 2030년까지 2,500만 호에 달할 가능성이 있는 등 저렴한 주택이 증가하고, 이 지역의 주택 건설이 확대될 전망입니다.
- 2022년 아시아태평양 주택 착공 바닥 면적은 전년 대비 약 5.39% 감소했습니다. 이 침체는 COVID-19의 대유행 시 건축 활동이 급증한 후 분야가 정상화된 결과입니다. 이 지역의 주택 부문은 인구 증가, 부유층 증가 및 급속한 도시화에 의해 견인되고 있습니다. 이 지역의 주택 신축상 면적은 2023년에는 2022년 대비 4억 1,000만 평방 피트 증가할 것으로 예상되었습니다.
- 2020년 아시아태평양 주택 신규 바닥 면적은 2019년 대비 약 5.06% 감소했습니다. 이는 주로 정부의 봉쇄, 공급망 혼란, 노동력 부족, 건설 생산성 저하, 외국 투자 침체로 인한 것이었습니다. 그러나 규제가 완화됨에 따라 이 지역에서는 상당한 회복이 보였고, 2021년에는 주택 신설 호수 증가로 주택 신규 바닥 면적이 약 14억 평방 피트 급증했습니다. 예를 들어, 2021년에만 인도의 주택 부동산 시장은 상위 7개 도시에서 약 16만 3,000개의 신축 주택을 도입했습니다.
- 아시아태평양의 주택 신축 바닥 면적은 예측 기간 동안 CAGR 3.98%를 나타낼 것으로 예측됩니다. 이 성장은 주택 수요, 투자 증가, 유리한 정부 정책 때문입니다. 보다 저렴한 주택 건설에 주력함으로써 이 지역의 주택 건설 부문은 활기를 되찾고 회복할 것으로 예상됩니다. 2030년까지는 인도 인구의 40% 이상이 도시에 거주할 것으로 예상되며, 2,500만 호의 저렴한 주택 수요가 예상됩니다. 이 수요가 급증함에 따라 인도의 주거용 부동산 시장은 2030년까지 150만 호에 달할 것으로 예상됩니다.
아시아태평양의 시멘트 산업 개요
아시아태평양의 시멘트 시장은 적당히 통합되어 상위 5개사에서 50.04%를 차지하고 있습니다. 이 시장 주요 기업은 다음과 같습니다. Anhui Conch Cement Company Limited, BBMG Corporation, China National Building Material Group Corporation, China Resource Cement Holdings and UltraTech Cement Ltd.(알파벳순 정렬).
기타 혜택
- 엑셀 형식 시장 예측(ME) 시트
- 3개월의 애널리스트 서포트
목차
제1장 주요 요약 및 주요 조사 결과
제2장 보고서 제안
제3장 서문
- 조사 전제조건 및 시장 정의
- 조사 범위
- 조사 방법
제4장 주요 산업 동향
- 최종 용도 분야의 동향
- 상업
- 산업 및 시설
- 인프라
- 주택
- 주요 인프라 프로젝트(현재 및 발표됨)
- 규제 프레임워크
- 밸류체인 및 유통채널 분석
제5장 시장 세분화
- 최종 용도 분야별
- 상업
- 산업 및 시설
- 인프라
- 주택
- 제품별
- 혼합 시멘트
- 섬유 시멘트
- 보통 포틀랜드 시멘트
- 백색 시멘트
- 기타
- 국가별
- 호주
- 중국
- 인도
- 인도네시아
- 일본
- 말레이시아
- 한국
- 태국
- 베트남
- 기타 아시아태평양
제6장 경쟁 구도
- 주요 전략 동향
- 시장 점유율 분석
- 기업 상황
- 기업 프로파일
- Adani Group
- Anhui Conch Cement Company Limited
- BBMG Corporation
- China National Building Material Group Corporation
- China Resource Cement Holdings
- SCG
- SIG
- TAIWAN CEMENT LTD.
- UltraTech Cement Ltd.
- Vietnam National Cement Corporation
제7장 CEO에 대한 주요 전략적 질문
제8장 부록
- 세계 개요
- 개요
- Porter's Five Forces 분석 프레임워크(산업 매력도 분석)
- 세계 밸류체인 분석
- 시장 역학(DROs)
- 정보원 및 참고문헌
- 도표 일람
- 주요 인사이트
- 데이터 팩
- 용어집
The Asia-Pacific Cement Market size is estimated at 3.18 billion Tons in 2024, and is expected to reach 4.32 billion Tons by 2030, growing at a CAGR of 5.22% during the forecast period (2024-2030).

Infrastructure spending in Asia-Pacific is expected to reach USD 1.74 trillion and is likely to drive the demand for cement
- In 2022, the cement consumption volume in the region saw a 6.37% decline from the previous year. This drop was primarily driven by reduced new floor area constructions in the commercial, residential, and industrial & institutional sectors. Notably, the industrial & institutional, and residential sectors saw a 5.63% and 5.39% decrease in new floor area, respectively, in 2022, compared to 2021. By 2023, Asia-Pacific accounted for approximately 72.53% of the global cement market.
- The infrastructure sector emerged as the region's largest cement consumer, representing about 39.48% in 2022. With increased investments in infrastructure projects, this sector's cement demand is expected to rise. For instance, India has set its sights on a USD 4.5 trillion infrastructure investment by 2030. Projections indicate that infrastructure spending in the region will hit USD 1.74 trillion by 2030, propelling the cement sector to a 16.03% growth from 2023 to 2030.
- The commercial sector is poised to be the region's fastest-growing cement consumer, with a projected CAGR of 6.48% during the forecast period. The region is poised to experience a significant uptick in demand for commercial spaces, including shopping malls and offices. In 2025, the region is projected to witness a notable surge, adding 178 million sq. ft of new commercial floor area, compared to the previous year. For example, Indonesia has six shopping mall projects slated for completion by 2025, adding up to a total of 292 thousand sq. meters. These trends indicate that the cement market for the commercial sector in the region is set to reach 523 million tons in 2030, up from around 336 million tons in 2022.
Vietnam is the fastest-growing country, while China is expected to maintain its leading position in Asia-Pacific during the forecast period
- In 2022, the demand for cement in Asia-Pacific dropped by 6.4% compared to the previous year, primarily driven by an 11.3% decline in demand from China, which is the region's dominant player. Several countries in the region were expected to see a slight dip in demand in 2023, and the overall growth was projected to be negative, at -0.4%, compared to 2022.
- China, with its consistently high construction output, stands as the largest cement consumer in Asia-Pacific. Notably, in 2022, its infrastructure sector alone accounted for 79% of the region's total cement demand in that sector. However, China's cement demand is anticipated to decline during the forecast period (2023-2030) due to challenges in the real estate industry and a decrease in new infrastructure projects.
- Following China, India emerges as the second-largest consumer of cement in Asia-Pacific. The residential sector in India holds the major share of cement demand, representing 61% of the total demand across sectors in 2022. Unlike some of its regional counterparts, India predominantly relies on concrete for its buildings, driving up the demand for cement.
- Among the countries in the region, Vietnam is projected to witness the highest growth in the demand for cement, and it is expected to register a CAGR of 7.46% by volume during the forecast period. This surge in demand is likely to be attributed to new land policies that bolster real estate development and the government's ambitious plan to construct 1 million affordable housing units by 2030.
Asia-Pacific Cement Market Trends
Rising retail and office spaces in countries such as India to boost the Asia-Pacific commercial construction sector
- In 2022, Asia-Pacific witnessed a 3.23% decline in its commercial new floor area compared to the previous year. This setback was attributed to factors such as regulatory pressures, higher inflation, and a surge in mortgage rates. In 2023, the region rebounded, with commercial construction new floor area increasing by approximately 146 million sq. ft. This surge was primarily driven by a rise in foreign direct investment (FDI), which spurred the demand for new offices, warehouses, retail outlets, and other facilities. Notably, the Vietnamese construction sector attracted an FDI capital of USD 71.44 million in 2023.
- In 2020, the Asia-Pacific region experienced a significant setback in commercial new floor area, with a volume decline of 21.92% compared to 2019. This decline was primarily due to widespread government lockdowns, which disrupted project work and severely impacted supply chains, equipment, and labor. However, as restrictions eased, the region witnessed a remarkable rebound, with its commercial new floor area surging by 20.98% in 2021, reaching a volume of approximately 526 million sq. ft.
- Asia-Pacific's commercial new floor area is projected to witness substantial growth, with an estimated increase of 1.41 billion sq. ft by 2030 compared to 2023. This surge is fueled by a rising demand for shopping malls, office spaces, retail outlets, and more. The Asia-Pacific region is emerging as a global retail powerhouse, contributing to nearly three-quarters of the worldwide retail growth. For instance, the Indian Grade A office market in its top seven cities may to expand to 1 billion sq. ft by 2026 and further to 1.2 billion sq. ft. by 2030. Overall, the commercial new floor area in Asia-Pacific is projected to witness a volume CAGR of 5.16% during the forecast period.
Rising affordable housing units, such as India's likely to reach 25 million by 2030, to augment the residential constructions in the region
- In 2022, the residential new floor area in the Asia-Pacific region saw a volume decline of approximately 5.39% from the previous year. This dip was a result of the sector normalizing after a surge in building activity during the COVID-19 pandemic. The region's residential sector is driven by a growing population, increasing wealth, and rapid urbanization. The residential new floor area in the region was expected to rise by 410 million sq. ft in 2023 compared to 2022.
- In 2020, the residential new floor area in Asia-Pacific declined in volume by around 5.06% compared to 2019. This was primarily due to government-imposed lockdowns, disruptions in the supply chain, labor shortages, reduced construction productivity, and low foreign investments. However, as restrictions eased, the region saw a significant rebound, with the residential new floor area surging by about 1.4 billion sq. ft in 2021, driven by the addition of new residential housing units. For instance, in 2021 alone, the Indian residential real estate market introduced approximately 163 thousand new residential units across its top seven cities.
- The residential new floor area in the Asia-Pacific region is projected to witness a CAGR of 3.98% during the forecast period. This growth can be attributed to the demand for housing, increased investments, and favorable government policies. The focus on constructing more affordable housing units is expected to rejuvenate the residential construction sector in the region, aiding its recovery. By 2030, it is estimated that over 40% of India's population will reside in urban areas, leading to a demand for an additional 25 million affordable housing units. This surge in demand is expected to push the Indian residential real estate market to reach 1.5 million units by 2030.
Asia-Pacific Cement Industry Overview
The Asia-Pacific Cement Market is moderately consolidated, with the top five companies occupying 50.04%. The major players in this market are Anhui Conch Cement Company Limited, BBMG Corporation, China National Building Material Group Corporation, China Resource Cement Holdings and UltraTech Cement Ltd. (sorted alphabetically).
Additional Benefits:
- The market estimate (ME) sheet in Excel format
- 3 months of analyst support
TABLE OF CONTENTS
1 EXECUTIVE SUMMARY & KEY FINDINGS
2 REPORT OFFERS
3 INTRODUCTION
- 3.1 Study Assumptions & Market Definition
- 3.2 Scope of the Study
- 3.3 Research Methodology
4 KEY INDUSTRY TRENDS
- 4.1 End Use Sector Trends
- 4.1.1 Commercial
- 4.1.2 Industrial and Institutional
- 4.1.3 Infrastructure
- 4.1.4 Residential
- 4.2 Major Infrastructure Projects (current And Announced)
- 4.3 Regulatory Framework
- 4.4 Value Chain & Distribution Channel Analysis
5 MARKET SEGMENTATION (includes market size, forecasts up to 2030 and analysis of growth prospects.)
- 5.1 End Use Sector
- 5.1.1 Commercial
- 5.1.2 Industrial and Institutional
- 5.1.3 Infrastructure
- 5.1.4 Residential
- 5.2 Product
- 5.2.1 Blended Cement
- 5.2.2 Fiber Cement
- 5.2.3 Ordinary Portland Cement
- 5.2.4 White Cement
- 5.2.5 Other Types
- 5.3 Country
- 5.3.1 Australia
- 5.3.2 China
- 5.3.3 India
- 5.3.4 Indonesia
- 5.3.5 Japan
- 5.3.6 Malaysia
- 5.3.7 South Korea
- 5.3.8 Thailand
- 5.3.9 Vietnam
- 5.3.10 Rest of Asia-Pacific
6 COMPETITIVE LANDSCAPE
- 6.1 Key Strategic Moves
- 6.2 Market Share Analysis
- 6.3 Company Landscape
- 6.4 Company Profiles
- 6.4.1 Adani Group
- 6.4.2 Anhui Conch Cement Company Limited
- 6.4.3 BBMG Corporation
- 6.4.4 China National Building Material Group Corporation
- 6.4.5 China Resource Cement Holdings
- 6.4.6 SCG
- 6.4.7 SIG
- 6.4.8 TAIWAN CEMENT LTD.
- 6.4.9 UltraTech Cement Ltd.
- 6.4.10 Vietnam National Cement Corporation
7 KEY STRATEGIC QUESTIONS FOR CONCRETE, MORTARS AND CONSTRUCTION CHEMICALS CEOS
8 APPENDIX
- 8.1 Global Overview
- 8.1.1 Overview
- 8.1.2 Porter's Five Forces Framework (Industry Attractiveness Analysis)
- 8.1.3 Global Value Chain Analysis
- 8.1.4 Market Dynamics (DROs)
- 8.2 Sources & References
- 8.3 List of Tables & Figures
- 8.4 Primary Insights
- 8.5 Data Pack
- 8.6 Glossary of Terms