
|
시장보고서
상품코드
1684076
인도네시아의 콘크리트 혼화제 : 시장 점유율 분석, 산업 동향 및 통계, 성장 예측(2025-2030년)Indonesia Concrete Admixtures - Market Share Analysis, Industry Trends & Statistics, Growth Forecasts (2025 - 2030) |
||||||
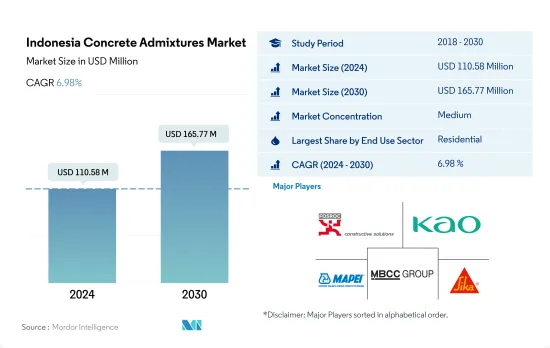
인도네시아의 콘크리트 혼화제 시장 규모는 2024년에 1억 1,058만 달러로 추정되며, 2030년에는 1억 6,577만 달러에 달할 것으로 예상되며, 예측 기간(2024-2030년) 동안 6.98%의 CAGR로 성장할 것으로 예상됩니다.
주택 수요 증가가 콘크리트 혼화제 수요를 견인할 것으로 보입니다.
- 인도네시아의 콘크리트 혼화제 소비량은 산업, 시설 및 주택 건설 부문의 수요 증가로 인해 2022년 전년 대비 1.73% 성장했으며, 2023년에는 콘크리트 혼화제가 인도네시아 건설용 화학제품 시장 총 소비량의 약 12.14%를 차지할 것으로 추정됩니다.
- 주택 부문은 국내 최대 콘크리트 혼화제 수요처로 2022년 약 31.4%를 차지했습니다. 도시화의 진전과 정부의 노력 및 국내외 투자로 인한 경기 부양책이 국가 주택 수요를 직간접적으로 끌어올리고 있으며, 장기적으로 주택 건설이 증가할 것으로 보입니다. 예를 들어, 인도네시아 정부(GOI)는 2025년까지 약 100만 가구의 주택 건설을 계획하고 있으며, 인도네시아의 주택 수요는 3,000만 가구에 달할 것으로 추정됩니다. 이에 따라 인도네시아의 콘크리트 혼화제 수요는 2023년 대비 2030년 2,124만 달러 증가할 것으로 예상됩니다.
- 산업 및 시설 부문은 콘크리트 혼화제의 가장 빠른 성장세를 보이고 있으며, 예측 기간 동안 7.86%의 가장 높은 CAGR을 기록할 것으로 예상됩니다. 산업 및 시설 부문의 신규 건축 면적은 산업 및 헬스케어 분야의 건설 투자 증가로 인해 2023년 4억 2,000만 평방피트에서 2030년 6억 3,300만 평방피트에 달할 것으로 예상됩니다. 이에 따라 이 부문의 콘크리트 혼화제는 2023년 2,994만 달러에서 2030년 5,085만 달러에 달할 것으로 예상됩니다.
인도네시아의 콘크리트 혼화제 시장 동향
인도네시아 상업용 부동산 시장 규모는 2028년까지 1조 3,900억 달러에 달할 것으로 예상되며, 상업 부문의 수요가 증가할 가능성이 높습니다.
- 2022년 인도네시아의 신규 상업용 바닥면적은 전년 대비 9.7% 감소했습니다. 이 감소는 COVID-19 팬데믹으로 인한 건축 활동의 감소에서 정상으로 돌아간 결과입니다. COVID-19 사태 이전부터 인도네시아 상업용 건물의 연간 에너지 소비량은 감소 추세를 보였으며, 그 비율은 연간 2.64%였습니다. 그러나 2023년에는 새로운 사무실, 창고 및 소매 공간을 필요로 하는 외국인 직접투자(FDI)의 급증으로 인해 새로운 상업용 바닥 면적이 5.7% 증가하면서 회복세를 보였습니다.
- 인도네시아는 2020년과 2021년에 COVID-19가 유행하는 동안 약 960만 평방피트의 신규 상업용 면적이 크게 증가했습니다. 정부가 경제 활성화에 집중한 결과, 민간 및 공공 프로젝트 모두 건설 관련 검역을 완화하는 등의 조치가 취해졌습니다. 이에 따라 직원들은 현장 작업을 재개할 수 있게 되었고, 기업들은 사업을 계속할 수 있게 되었습니다. 주목할 만한 것은 인도네시아의 완공 공사 금액이 2020년에는 약 1조 3,200억 IDR에 달하고 2021년에는 1조 4,200억 IDR로 증가할 것이라는 점입니다.
- 인도네시아의 신규 상업용 바닥면적은 2023년 대비 2030년까지 약 58.72%의 큰 폭의 성장이 예상됩니다. 이러한 급격한 증가는 쇼핑몰, 사무실 및 기타 상업용 공간에 대한 수요 증가에 기인합니다. 소매 부동산 부문은 특히 매력적인 분야로 부상하고 있습니다. 예를 들어, 상업용 부동산 시장 규모는 2028년까지 1조 3,900억 달러에 달할 것으로 예상됩니다. 인도네시아의 신규 상업용 건물 면적은 예측 기간 동안 6.82%의 CAGR을 기록하며 안정적인 성장을 유지할 것으로 예상됩니다.
주택 수요 증가는 주택 부문의 성장을 촉진할 가능성이 높습니다.
- 2022년 인도네시아의 신규 주택 연면적은 2021년 대비 7.10% 증가했습니다. 이러한 급격한 증가는 인구 증가, 부유화, 도시화에 기인합니다. 정부 주도의 주택 지원은 2022년 29조 루피에 달했으며, 주택 융자 유동성 지원 제도에 따라 2023년에는 32조 루피로 증가할 것으로 예측되었습니다. 이 이니셔티브는 최소 22만 채의 주택 건설을 목표로 하고 있습니다. 주택 건설 부문은 2023년에 전년 대비 약 5,600만 평방피트까지 증가할 것으로 예상되며, 주택 건설 부문이 크게 성장할 것으로 예상됩니다.
- 2020년 인도네시아의 주택 신축 면적이 2019년 대비 7.06% 증가했습니다. 이는 경기 침체를 완화하고 소득 감소로 어려움을 겪고 있는 가계를 지원하기 위해 건설을 우선순위에 둔 정부의 전략적 움직임입니다. 그 결과, 검역을 포함한 건설 활동의 제한이 크게 완화되었습니다. 그러나 2021년에는 추세가 반전되어 주택 착공 면적이 약 12.54% 감소했습니다. 이는 주로 건설 부문에 대한 외국인 직접 투자(FDI)의 감소에 기인하며, 2021년 건설 FDI는 전년 대비 51% 감소했습니다.
- 인도네시아의 신규 주택 연면적은 예측 기간 동안 물량 기준으로 CAGR 6.08%로 성장할 것으로 예상됩니다. 이러한 성장은 정부 이니셔티브와 국내외 투자에 힘입어 인도네시아의 도시화 진전에 기인합니다. 이러한 요인들은 직간접적으로 주택 수요의 증가를 강조하고, 궁극적으로 주택 건설을 촉진할 것입니다. 급증하는 수요를 충족시키기 위해 2030년까지 연간 82만-100만 채의 주택이 필요할 것이라는 예측도 있습니다.
인도네시아의 콘크리트 혼화제 산업 개요
인도네시아의 콘크리트 혼화제 시장은 적당히 통합되어 있으며, 상위 5개 기업이 64.93%를 점유하고 있습니다. 이 시장의 주요 기업은 다음과 같습니다. Fosroc, Inc., Kao Corporation, MAPEI S.p.A., MBCC Group 및 Sika AG(알파벳 순으로 정렬).
기타 혜택
- 엑셀 형식의 시장 예측(ME) 시트
- 3개월 애널리스트 지원
목차
제1장 주요 요약과 주요 조사 결과
제2장 보고서 오퍼
제3장 소개
- 조사 가정과 시장 정의
- 조사 범위
- 조사 방법
제4장 주요 산업 동향
- 최종 용도 부문 동향
- 상업
- 산업·시설
- 인프라
- 주택
- 주요 인프라 프로젝트(현재 및 발표된)
- 규제 프레임워크
- 밸류체인과 유통 채널 분석
제5장 시장 세분화(시장 규모, 2030년까지 예측, 성장 전망 분석을 포함)
- 최종 용도 부문
- 상업
- 산업·시설
- 인프라
- 주택
- 서브 프로덕트
- 촉진제
- 공기 혼입 혼화제
- 고범위 감수제(초가소제)
- 리타더
- 수축 저감 혼화제
- 점도 조정제
- 감수제(가소제)
- 기타 유형
제6장 경쟁 구도
- 주요 전략적 활동
- 시장 점유율 분석
- 기업 상황
- 기업 개요
- Cementaid International Group of Companies
- Fosroc, Inc.
- Kao Corporation
- MAPEI S.p.A.
- MBCC Group
- PT. Grolen New Building Material Indonesia
- PT. Kimia Konstruksi Indonesia
- RPM International Inc.
- Saint-Gobain
- Sika AG
제7장 CEO에 대한 주요 전략적 질문
제8장 부록
- 세계 개요
- 개요
- Five Forces 분석 프레임워크(산업 매력도 분석)
- 세계의 밸류체인 분석
- 시장 역학(DROs)
- 정보 출처와 참고문헌
- 도표
- 주요 인사이트
- 데이터팩
- 용어집
The Indonesia Concrete Admixtures Market size is estimated at 110.58 million USD in 2024, and is expected to reach 165.77 million USD by 2030, growing at a CAGR of 6.98% during the forecast period (2024-2030).

Rise in demand for housing units is likely to drive the demand for concrete admixtures
- Indonesia's concrete admixtures consumption value witnessed a growth of 1.73% by value in 2022 compared to the previous year due to increasing demand from the industrial, institutional, and residential construction sectors. In 2023, concrete admixtures were estimated to account for around 12.14% of the total consumption of the Indonesian construction chemicals market.
- The residential sector is the country's largest consumer of concrete admixtures, which accounted for around 31.4% in 2022. The growing urbanization and economic boost from government initiatives and foreign and domestic investments are directly and indirectly pushing the country's housing needs, which would increase residential building construction in the long run. For instance, the Government of Indonesia (GOI) intends to construct around 1 million housing units by 2025, with the country's housing requirements estimated to reach 30 million units. As a result, the country's concrete admixtures for the sector are projected to increase by USD 21.24 million in 2030 as compared to 2023.
- The country's industrial and institutional sector is expected to be the fastest-growing consumer of concrete admixtures, with the highest CAGR of 7.86% during the forecast period. The industrial and institutional new floor area in the country is projected to reach 633 million sq. ft in 2030 from 420 million sq. ft in 2023, owing to increased investment in the construction of industrial and healthcare sectors. As a result, the country's concrete admixtures for the sector are projected to reach USD 50.85 million in 2030 from USD 29.94 million in 2023.
Indonesia Concrete Admixtures Market Trends
Indonesian commercial real estate market volume is projected to reach USD 1.39 trillion by 2028 and is likely to augment the demand for commercial sector
- In 2022, Indonesia witnessed a 9.7% decline in the volume of new commercial floor area compared to the previous year. This drop was a result of a return to normalcy following a decline in building activities during the COVID-19 pandemic. Even before the pandemic, commercial buildings in Indonesia were already showing a downward trend in annual energy intensity, accounting for a rate of 2.64% per year. However, in 2023, the country saw a rebound, registering a 5.7% increase in the volume of new commercial floor area, driven by a surge in foreign direct investment (FDI) necessitating new offices, warehouses, and retail spaces.
- Amidst the COVID-19 pandemic, in 2020 and 2021, Indonesia witnessed a significant surge in the volume of new commercial floor area, accounting for approximately 9.6 million square feet. The government's focus on revitalizing the economy led to measures such as easing construction-related quarantines, both in private and public projects. This allowed employees to resume work on-site and companies to continue their operations. Notably, the value of completed constructions in Indonesia stood at around IDR 1.32 quadrillion in 2020 and rose to IDR 1.42 quadrillion in 2021.
- The volume of new commercial floor area in Indonesia is projected to witness a robust growth of around 58.72% by 2030 compared to 2023. This surge is driven by a rising demand for shopping malls, offices, and other commercial spaces. The retail real estate segment is emerging as a particularly captivating sector in the country. For instance, the volume of the commercial real estate market is anticipated to reach USD 1.39 trillion by 2028. The commercial new floor area in Indonesia is expected to maintain steady growth, registering a CAGR of 6.82% during the forecast period.
Increase in demand for housing units is likely to augment the residential sector's growth
- In 2022, Indonesia witnessed a 7.10% volume growth in residential new floor area compared to 2021. This surge can be attributed to increased population, wealth, and urbanization. The government-led housing aid reached IDR 29 trillion in 2022, which was projected to increase to IDR 32 trillion in 2023 under the Housing Financing Liquidity Facility scheme. This initiative aims to construct at least 220 thousand houses. The residential construction sector is poised to witness a significant growth rate. It was estimated to increase to approximately 56 million square feet in 2023 compared to the preceding year.
- In 2020, the volume of residential new floor areas in Indonesia grew by 7.06% compared to 2019. This was a strategic move by the government, prioritizing construction to mitigate the economic downturn and support households grappling with reduced incomes. Consequently, restrictions on construction activities, including quarantines, were significantly eased. However, in 2021, the trend reversed, with a decline of about 12.54% in residential new floor area, primarily attributed to a dip in foreign direct investment (FDI) in the construction sector. FDI for construction plummeted by 51% in 2021 compared to the previous year.
- The residential new floor area in Indonesia is projected to witness a CAGR of 6.08% in volume during the forecast period. This growth stems from the country's increasing urbanization, bolstered by government initiatives and foreign and domestic investments. These factors, directly and indirectly, underscore the mounting housing needs in the nation, ultimately driving residential building construction. Projections indicate that to meet the escalating demand, the country would require between 820,000 and 1 million housing units annually by 2030.
Indonesia Concrete Admixtures Industry Overview
The Indonesia Concrete Admixtures Market is moderately consolidated, with the top five companies occupying 64.93%. The major players in this market are Fosroc, Inc., Kao Corporation, MAPEI S.p.A., MBCC Group and Sika AG (sorted alphabetically).
Additional Benefits:
- The market estimate (ME) sheet in Excel format
- 3 months of analyst support
TABLE OF CONTENTS
1 EXECUTIVE SUMMARY & KEY FINDINGS
2 REPORT OFFERS
3 INTRODUCTION
- 3.1 Study Assumptions & Market Definition
- 3.2 Scope of the Study
- 3.3 Research Methodology
4 KEY INDUSTRY TRENDS
- 4.1 End Use Sector Trends
- 4.1.1 Commercial
- 4.1.2 Industrial and Institutional
- 4.1.3 Infrastructure
- 4.1.4 Residential
- 4.2 Major Infrastructure Projects (current And Announced)
- 4.3 Regulatory Framework
- 4.4 Value Chain & Distribution Channel Analysis
5 MARKET SEGMENTATION (includes market size, forecasts up to 2030 and analysis of growth prospects.)
- 5.1 End Use Sector
- 5.1.1 Commercial
- 5.1.2 Industrial and Institutional
- 5.1.3 Infrastructure
- 5.1.4 Residential
- 5.2 Sub Product
- 5.2.1 Accelerator
- 5.2.2 Air Entraining Admixture
- 5.2.3 High Range Water Reducer (Super Plasticizer)
- 5.2.4 Retarder
- 5.2.5 Shrinkage Reducing Admixture
- 5.2.6 Viscosity Modifier
- 5.2.7 Water Reducer (Plasticizer)
- 5.2.8 Other Types
6 COMPETITIVE LANDSCAPE
- 6.1 Key Strategic Moves
- 6.2 Market Share Analysis
- 6.3 Company Landscape
- 6.4 Company Profiles
- 6.4.1 Cementaid International Group of Companies
- 6.4.2 Fosroc, Inc.
- 6.4.3 Kao Corporation
- 6.4.4 MAPEI S.p.A.
- 6.4.5 MBCC Group
- 6.4.6 PT. Grolen New Building Material Indonesia
- 6.4.7 PT. Kimia Konstruksi Indonesia
- 6.4.8 RPM International Inc.
- 6.4.9 Saint-Gobain
- 6.4.10 Sika AG
7 KEY STRATEGIC QUESTIONS FOR CONCRETE, MORTARS AND CONSTRUCTION CHEMICALS CEOS
8 APPENDIX
- 8.1 Global Overview
- 8.1.1 Overview
- 8.1.2 Porter's Five Forces Framework (Industry Attractiveness Analysis)
- 8.1.3 Global Value Chain Analysis
- 8.1.4 Market Dynamics (DROs)
- 8.2 Sources & References
- 8.3 List of Tables & Figures
- 8.4 Primary Insights
- 8.5 Data Pack
- 8.6 Glossary of Terms
