|
시장보고서
상품코드
1685686
농업용 킬레이트 화합물 시장 : 시장 점유율 분석, 산업 동향 및 통계, 성장 예측(2025-2030년)Agricultural Chelates - Market Share Analysis, Industry Trends & Statistics, Growth Forecasts (2025 - 2030) |
||||||
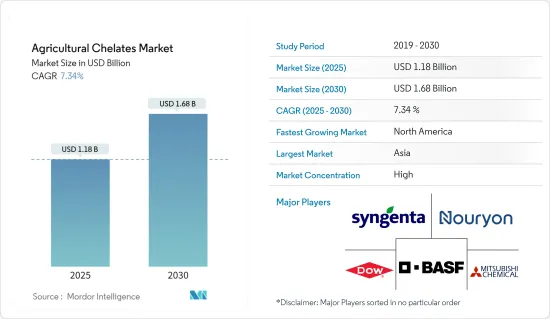
농업용 킬레이트 화합물 시장 규모는 2025년에 11억 8,000만 달러로 추정되고, 예측 기간인 2025-2030년 CAGR 7.34%로 성장할 전망이며, 2030년에는 16억 8,000만 달러에 달할 것으로 예측됩니다.

주요 하이라이트
- 기후조건 변화, 경작지 감소, 세계 인구의 급속한 확대로 식량안보에 대한 우려가 커지고 있습니다. 미국 농무부(USDA)가 실시한 2022년 농업 센서스에서는 미국(US)의 농장 수가 200만을 인터럽트한 것이 밝혀졌습니다. 구체적으로 2022년 미국의 농가 수는 190만 호로 2017년 인구조사 수치에서 7% 감소했습니다. 게다가 인구조사는 미국의 농지 총 면적이 2.2% 감소하였고, 2022년에는 8억 8,000만 에이커가 된 것을 강조했습니다. 이러한 개발을 바탕으로 적절한 농업 투입에 의한 생산성 향상이 필수적입니다. 그 결과, 세계의 식량 수요를 충족시키기 위해 작물의 수율을 향상시키기 위해, 농업에 있어서 킬레이트 화합물의 채용이 현저하게 급증하고 있습니다. 킬레이트 화합물는 식물의 영양소 섭취를 촉진하여 특정 영양소를 더 쉽게 이용할 수 있습니다. 이것은 식물의 성장과 개발을 개선하고 궁극적으로 작물의 수율과 품질을 향상시킵니다.
- 독립 연구소의 분석에 따르면 영국의 밀 작물에서는 질소가 10%, 인이 25%가 부족하다는 것이 수천 개의 토양 샘플에서 밝혀졌습니다. 킬레이트화는 용액과 토양 모두에서 원치 않는 반응으로부터 미량 영양소를 보호하는 메커니즘으로 작용합니다. Fe, Cu, Mn, Zn 등의 미량영양소의 생물학적 이용능력을 높임으로써, 킬레이트 비료는 상업 작물 생산의 생산성과 수익성을 높이는데 있어 매우 중요한 역할을 합니다. 특히 pH가 6.5를 초과하는 토양이나 저미량 영양소 스트레스 하에 있는 토양에서 킬레이트 비료는 표준 미량 영양소와 비교하여 상업적 수율을 증가시키는 우수한 능력을 입증합니다.
- 지속 가능한 농업의 기운이 높아지고, 합성 킬레이트 화합물이 환경에 미치는 영향에 대한 의식이 높아지는 가운데, 생분해성의 대체품을 모색하는 움직임이 현저해지고 있습니다. 이러한 상황에 근거하여, 각사는 이 수요의 고조에 대응하기 위해서 전략적인 포지셔닝을 취해, 시장에서의 존재감을 높이고 있습니다.
농업용 킬레이트 화합물 시장 동향
농업에서 EDTA 선호 증가
- 에틸렌디아민 테트라아세트산(EDTA)은 농업에서 주요 합성 킬레이트 화합물로서 두각을 나타내며 토양 및 엽면 영양제 모두에 널리 사용됩니다. 토양 pH가 6.0 전후이면 EDTA는 노지 시비로 그 효과를 발휘합니다. 이 적응성의 높이는 EDTA 시장에서 주도적 지위를 확고하게 하고 있습니다.
- EDTA 킬레이트는 철(Fe), 망간(Mn), 구리(Cu), 아연(Zn) 등의 필수 미량 원소를 토양으로부터 직접 식물의 뿌리로 이행시키는 효율이 우수하기 때문에 종래의 무기물보다도 선호되고 있습니다. 인도 토양 과학 연구소(Indian Institute of Soil Science)는 미량 영양소의 부족이 만연하고 있다는 우려할 동향을 강조합니다. 인도 토양의 평균 결핍율은 아연이 43.0%, 철이 12.1%, 구리가 5.4%, 망간이 5.6%, 붕소가 18.3%입니다. 우려해야 할 점은 산성 토양에서는 아연과 인산이, 반건조 지역에서는 아연과 철이 부족하여 미래의 제작 체계에 잠재적인 과제가 있음을 보여줍니다. 중요한 미량 영양소인 아연은 식물 호르몬의 균형을 유지하고 성장을 가속하는 데 필수적입니다. 유기 킬레이트 아연 공급원, 특히 Zn-EDTA(Zn을 12% 포함)는 무기 대체품보다 우수한 것으로 간주되는 경우가 많습니다. 예를 들어, 옥수수와 콩류와 같은 작물에 Zn-EDTA 킬레이트 비료를 적용하는 경우, 농부는 전통적인 황산 아연(ZnSO4)의 절반의 양으로 끝납니다. 게다가, EDTA 킬레이트는 가격이 저렴할 뿐만 아니라, 현재 이용가능한 많은 다른 시판 농업용 킬레이트 화합물보다 얻기 쉽다는 장점도 있습니다.
- 시장의 유력 기업은 농업용으로 조정된 광범위한 EDTA 제품을 전시하고 있습니다. 예를 들어 Corteva는 Versenol과 Crop Max라는 브랜드 이름으로 EDTA 킬레이트 화합물를 제공하며, 모두 농업 업계에서 높은 수요가 있습니다. EDTA는 영양제로서의 용도뿐만 아니라 수은 카드뮴, 납 등의 중금속으로 오염된 토양을 무해화하는 능력도 있어 시장 확대에 박차를 가하고 있습니다. 그러나 EDTA에도 과제가 없는 것은 아닙니다. 많은 합성 약물과 마찬가지로 EDTA는 고비용, 제한된 생분해성, 잠재적인 2차 오염 위험 등의 문제에 대처하고 있습니다. 이러한 과제는 이 부문의 성장 궤도를 방해할 수 있습니다.
아시아태평양이 시장을 독점
- 아시아태평양에서는 중국, 인도, 일본, 호주가 농업용 킬레이트 화합물 시장 수요를 이끌고 있습니다. 호주 정부에 따르면 알칼리성 토양은 호주 토지의 약 24%를 차지하고 있으며, 특히 서부 지역에서는 pH 수준이 4-8.5가 되고 있습니다. 그 결과 호주에서는 농업 생산성 향상을 방해하는 미량 원소의 부족을 배경으로 킬레이트 화합물 수요가 증가하고 있습니다.
- 세계 최대의 인구를 가진 중국은 가장 광대한 농업 시설도 보유하고 있습니다. 인구가 급증하고 식량 수요가 높아지는 가운데 중국 농부들은 더 높은 작물 수율을 달성할 필요가 있습니다. 그러나 중국의 여러 지역에서는 석회질 토양에서 미량 영양소의 결핍에 시달리고 있습니다. 이러한 과제를 해결하기 위해 중국은 베이징의 비영리 환경보호단체가 주도하는 종합적인 토양센서에 임하고 있으며 2025년 완료를 목표로 하고 있습니다. 이 토양 조사에서 얻은 발견은 토양의 부족을 밝혀내고 나라에서 킬레이트 화합물의 판매를 밀어 올릴 수 있습니다.
- 미량 영양소의 결핍은 태국을 비롯한 쌀 생산국의 생산성을 손상시키고 있습니다. 한 독자적인 연구는 주요 미량 영양소(Fe, Mn, Zn, Cu)가 매우 중요하다는 것을 확인하였고, 이들의 결핍은 쌀알의 수율을 24.12%-46.46%까지 감소시킬 수 있다는 것이 밝혀졌습니다. 그러나 DTPA를 적용하면 이러한 미량 영양소를 첨가하여 수율을 크게 향상시킬 수 있습니다.
농업용 킬레이트 화합물 산업 개요
세계의 농업용 킬레이트 화합물 시장은 통합되어 BASF SE, Mitsubishi Chemical Corporation, Syngenta Ag, Dow Inc, Nouryon Chemicals Holding BV 등 대기업이 큰 점유율을 차지하고 있습니다. 이러한 기업의 시장 점유율이 큰 것은 고도로 다양화된 제품 포트폴리오와 리뷰 기간 중 인수 및 제휴에 기인하고 있습니다. 이 회사들은 또한 지리적 존재를 확대하기 위해 연구개발 및 제품 혁신에 주력하고 있습니다.
기타 혜택 :
- 엑셀 형식 시장 예측(ME) 시트
- 애널리스트에 의한 3개월간의 서포트
목차
제1장 서론
- 조사 전제조건 및 시장 정의
- 조사 범위
제2장 조사 방법
제3장 주요 요약
제4장 시장 역학
- 시장 개요
- 시장 성장 촉진요인
- 농작물의 고수량화에 대한 수요
- 미량 영양소 중독에 있어서 킬레이트 용도
- 토양의 미량 영양소의 결핍
- 시장 성장 억제요인
- 생분해성 킬레이트 화합물의 빈약한 제품 제공
- 합성 킬레이트 화합물 사용에 대한 규제의 향상
- Porter's Five Forces 분석
- 공급기업의 협상력
- 구매자의 협상력
- 신규 참가업체의 위협
- 대체품의 위협
- 경쟁 기업간 경쟁 관계의 강도
제5장 시장 세분화
- 유형별
- 합성
- EDTA
- EDDHA
- DTPA
- IDHA
- 기타 합성 유형
- 유기
- 사과황산염
- 아미노산
- 헵타글루콘산염
- 기타 유기 유형
- 합성
- 용도별
- 토양
- 잎면 살포
- 시비
- 기타 용도
- 작물 유형별
- 곡물
- 콩류 및 지방종자
- 상업 작물
- 과일 및 채소
- 잔디 및 관엽식물
- 지역별
- 북미
- 미국
- 캐나다
- 멕시코
- 기타 북미
- 유럽
- 스페인
- 영국
- 프랑스
- 독일
- 러시아
- 이탈리아
- 기타 유럽
- 아시아태평양
- 중국
- 일본
- 인도
- 호주
- 기타 아시아태평양
- 남미
- 브라질
- 아르헨티나
- 기타 남미
- 아프리카
- 남아프리카
- 기타 아프리카
- 북미
제6장 경쟁 구도
- 가장 채용된 전략
- 시장 점유율 분석
- 기업 프로파일
- Nouryon Chemicals Holding BV
- Shandong Iro Chelating Chemical Co. Ltd
- Ava Chemicals Private Limited
- Protex International
- Innospec Inc.
- Syngenta Ag
- Mitsubishi Group(Mitsubishi Chemical Corporation)
- Dow Inc
제7장 시장 기회 및 향후 동향
AJY 25.04.17The Agricultural Chelates Market size is estimated at USD 1.18 billion in 2025, and is expected to reach USD 1.68 billion by 2030, at a CAGR of 7.34% during the forecast period (2025-2030).
Key Highlights
- Concerns over food security are rising due to changing climate conditions, diminishing arable land, and a swiftly expanding global population. The 2022 Census of Agriculture, conducted by the United States Department of Agriculture (USDA), revealed that the number of farms in the United States (U.S.) has dipped below 2 million. Specifically, in 2022, the U.S. counted 1.9 Million farms, marking a 7% decrease from the figures in the 2017 Census. Additionally, the Census highlighted a 2.2% reduction in total U.S. farmland, bringing it down to 880 million acres in 2022. Given these developments, boosting productivity through appropriate agricultural inputs has become imperative. Consequently, there's been a notable surge in the adoption of chelating agents in agriculture, to enhance crop yields to satisfy global food requirements. Chelating agents facilitate plants' uptake of nutrients, making certain nutrients more accessible. This leads to improved plant growth and development, ultimately enhancing crop yield and quality.
- Independent laboratory analyses highlight troubling trends, includes wheat crops in the UK are experiencing a 10% nitrogen deficiency and a 25% phosphorus deficiency, as evidenced by thousands of soil samples. Chelation serves as a protective mechanism, shielding micronutrients from unwanted reactions in both solutions and soil. By boosting the bioavailability of micronutrients like Fe, Cu, Mn, and Zn, chelated fertilizers play a pivotal role in enhancing the productivity and profitability of commercial crop production. Notably, in soils with a pH exceeding 6.5 or those under low-micronutrient stress, chelated fertilizers have demonstrated a superior capacity to boost commercial yields compared to standard micronutrients.
- With the rising momentum of sustainable farming and growing awareness about the environmental repercussions of synthetic chelating agents, there's a marked pivot towards exploring biodegradable alternatives. In light of this, companies are strategically positioning themselves to meet this evolving demand, thereby strengthening their market presence.
Agricultural Chelates Market Trends
Increasing Preference for EDTA in Agriculture
- Ethylenediaminetetraacetic acid (EDTA) has emerged as the premier synthetic chelating agent in agriculture, widely employed for both soil and foliar nutrient applications. At soil pH levels around 6.0, EDTA demonstrates its efficacy in open-field fertigation. This adaptability plays a pivotal role in cementing EDTA's leading market position.
- EDTA chelates are preferred over conventional inorganic sources due to their superior efficiency in transferring essential trace elements such as iron (Fe), manganese (Mn), copper (Cu), and zinc (Zn)-from the soil directly to plant roots. The Indian Institute of Soil Science highlights a concerning trend of micronutrient deficiencies are widespread, with average deficiencies in Indian soils being 43.0% for Zinc, 12.1% for Iron, 5.4% for Copper, 5.6% for Manganese, and 18.3% for Boron. Alarmingly, the combined deficiency of Zn and B in acidic soils, and Zn and Fe in semi-arid regions, signals potential challenges for future cropping systems. Zinc, a crucial micronutrient, is essential for maintaining plant hormone balance and fostering growth. Organic chelated zinc sources, particularly Zn-EDTA (which contains 12% Zn), are frequently regarded as superior to their inorganic alternatives. For instance, when treating crops like corn and beans, the application of Zn-EDTA chelate fertilizer allows farmers to use only half the quantity compared to traditional zinc sulfate (ZnSO4). Additionally, EDTA chelates not only come at a lower price point but also boast greater accessibility than numerous other commercial agricultural chelates available today.
- Prominent players in the market showcase a wide array of EDTA products tailored for agricultural use. Corteva, for instance, offers its EDTA chelating agents under the brand names Versenol and Crop Max, both of which are in high demand within the agricultural community. Beyond its nutrient application, EDTA's ability to detoxify soils contaminated with heavy metals like mercury, cadmium, and lead further fuels its market expansion. However, EDTA isn't without its challenges. Like many synthetic agents, it grapples with issues such as high costs, limited biodegradability, and potential secondary pollution risks. These challenges could hinder the segment's growth trajectory.
Asia-Pacific Dominates the Market
- In the Asia-Pacific region, China, India, Japan, and Australia lead in market demand for agricultural chelates. According to the Australian Government, alkaline soils account for about 24% of Australia's land, particularly in the western regions, where pH levels range from 4 to 8.5. As a result, Australia is experiencing an increasing demand for chelating agents, driven by trace element deficiencies that impede agricultural productivity growth.
- China, home to the world's largest population, also hosts some of the most expansive agricultural facilities. With its population surging and food demand rising, Chinese farmers are under pressure to achieve higher crop yields. Yet, various regions in China grapple with micronutrient deficiencies in their calcareous soils. To address these challenges, China is undertaking a comprehensive soil census, led by a nonprofit environmental organization from Beijing, with an anticipated completion in 2025. Insights from this soil survey are poised to illuminate soil deficiencies, potentially boosting chelate sales in the nation.
- Micronutrient deficiencies are currently undermining productivity in rice-growing nations, notably Thailand. An independent study identified key micronutrients (Fe, Mn, Zn, and Cu) as pivotal, revealing their deficiency could slash rice grain yields by a staggering 24.12%-46.46%. However, with the application of DTPA, these yields can be significantly bolstered through the addition of these micronutrients.
Agricultural Chelates Industry Overview
The global agricultural chelates market is consolidated, with the major players in the market including BASF SE, Mitsubishi Chemical Corporation, Syngenta Ag, Dow Inc, Nouryon Chemicals Holding B.V, etc holding a significant share of the market. The significant market share of these players can be attributed to a highly diversified product portfolio and acquisitions and partnerships during the review period. These players also focus on R&D and product innovations to widen their geographical presence.
Additional Benefits:
- The market estimate (ME) sheet in Excel format
- 3 months of analyst support
TABLE OF CONTENTS
1 INTRODUCTION
- 1.1 Study Assumptions and Market Definition
- 1.2 Scope of the Study
2 RESEARCH METHODOLOGY
3 EXECUTIVE SUMMARY
4 MARKET DYNAMICS
- 4.1 Market Overview
- 4.2 Market Drivers
- 4.2.1 Demand For Higher Crop Yields
- 4.2.2 Application of Chelates in Micronutrient Intoxication
- 4.2.3 Micronutrient Deficiency In Soil
- 4.3 Market Restraints
- 4.3.1 Poor Product Offering in Biodegradable Chelates
- 4.3.2 Rising Regulation on Use of Synthetic Chelating Agents
- 4.4 Porter's Five Forces Analysis
- 4.4.1 Bargaining Power of Suppliers
- 4.4.2 Bargaining Power of Buyers
- 4.4.3 Threat of New Entrants
- 4.4.4 Threat of Substitutes
- 4.4.5 Intensity of Competitive Rivalry
5 MARKET SEGMENTATION
- 5.1 Type
- 5.1.1 Synthetic
- 5.1.1.1 EDTA
- 5.1.1.2 EDDHA
- 5.1.1.3 DTPA
- 5.1.1.4 IDHA
- 5.1.1.5 Other Synthetic Types
- 5.1.2 Organic
- 5.1.2.1 LingoSulphates
- 5.1.2.2 Aminoacids
- 5.1.2.3 Heptagluconates
- 5.1.2.4 Other Organic Types
- 5.1.1 Synthetic
- 5.2 Application
- 5.2.1 Soil
- 5.2.2 Foliar
- 5.2.3 Fertigation
- 5.2.4 Other Applications
- 5.3 Crop Type
- 5.3.1 Grains and Cereals
- 5.3.2 Pulses and Oilseeds
- 5.3.3 Commercial Crops
- 5.3.4 Fruits and Vegetables
- 5.3.5 Turf and Ornamentals
- 5.4 Geography
- 5.4.1 North America
- 5.4.1.1 United States
- 5.4.1.2 Canada
- 5.4.1.3 Mexico
- 5.4.1.4 Rest of North America
- 5.4.2 Europe
- 5.4.2.1 Spain
- 5.4.2.2 United Kingdom
- 5.4.2.3 France
- 5.4.2.4 Germany
- 5.4.2.5 Russia
- 5.4.2.6 Italy
- 5.4.2.7 Rest of Europe
- 5.4.3 Asia-Pacific
- 5.4.3.1 China
- 5.4.3.2 Japan
- 5.4.3.3 India
- 5.4.3.4 Australia
- 5.4.3.5 Rest of Asia-Pacific
- 5.4.4 South America
- 5.4.4.1 Brazil
- 5.4.4.2 Argentina
- 5.4.4.3 Rest of South America
- 5.4.5 Africa
- 5.4.5.1 South Africa
- 5.4.5.2 Rest of Africa
- 5.4.1 North America
6 COMPETITIVE LANDSCAPE
- 6.1 Most Adopted Strategies
- 6.2 Market Share Analysis
- 6.3 Company Profiles
- 6.3.1 Nouryon Chemicals Holding B.V
- 6.3.2 Shandong Iro Chelating Chemical Co. Ltd
- 6.3.3 Ava Chemicals Private Limited
- 6.3.4 Protex International
- 6.3.5 Innospec Inc.
- 6.3.6 Syngenta Ag
- 6.3.7 Mitsubishi Group (Mitsubishi Chemical Corporation)
- 6.3.8 Dow Inc