|
시장보고서
상품코드
1906878
폴리옥시메틸렌(POM) : 시장 점유율 분석, 업계 동향 및 통계, 성장 예측(2026-2031년)Polyoxymethylene (POM) - Market Share Analysis, Industry Trends & Statistics, Growth Forecasts (2026 - 2031) |
||||||
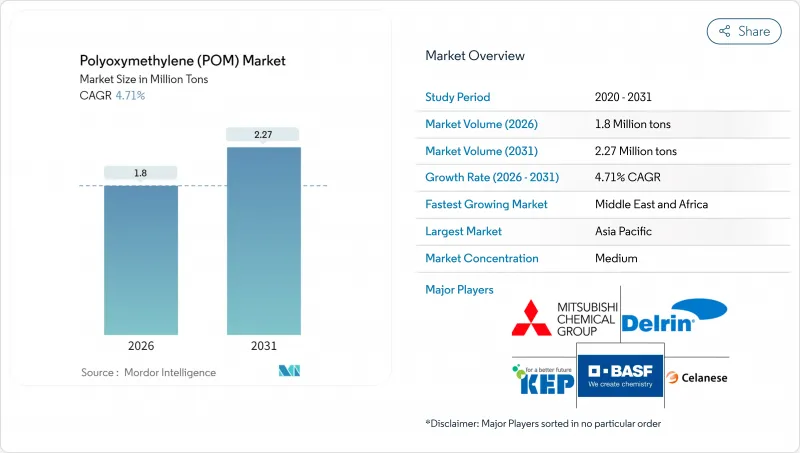
폴리옥시메틸렌(POM) 시장 규모는 2026년에는 180만톤에 달할 것으로 예측되고 있습니다.
이는 2025년 172만톤에서 증가한 수치이며, 2031년에는 227만톤에 달할 것으로 예상되고 있습니다. 2026년부터 2031년까지의 연평균 성장률(CAGR)은 4.71%를 나타낼 것으로 전망됩니다.

수요 증가의 배경으로는 자동차 경량화 프로그램, 전자 기기의 소형화, 정밀 기계의 금속에서 플라스틱으로의 전환 등이 있습니다. 유럽연합(EU), 중국, 미국의 자동차 배출가스 규제 강화는 치수 안정성이 우수한 엔지니어링 수지의 보급을 촉진하고 있습니다. 자동차 제조업체(OEM)는 부품 수를 줄이고 재활용을 단순화하기 위해 단일 재료 모듈을 설계하고 있으며, 이 접근법은 아세탈 공중합체의 선택을 뒷받침하고 있습니다. 한편, 지속가능성에 대한 노력으로 제조업체는 기계적 특성을 손상시키지 않고 규제기준을 충족하는 저포름알데히드 함유 등급 및 재생재 함유 등급의 개발을 추진하고 있습니다. 경쟁 면에서 아시아의 통합업체는 메탄올 공급과 하류 가공업자에 대한 근접성을 활용하여 비용 우위성을 강화하는 한편, 구미공급자는 전기자동차(EV) 내장 부품과 반도체 제조 장치용 특수 배합 제품으로 차별화를 도모하고 있습니다.
세계의 폴리옥시메틸렌(POM) 시장 동향과 인사이트
자동차 경량화의 급성장
자동차 제조업체는 특히 연료 모듈, 도어 래치 및 변속기 부품에서 구조 강성을 유지하면서 차량 무게를 줄이기 위해 아세탈 공중 합체를 지정합니다. 2024년 기준에서 평균적인 자동차에는 8-10파운드의 POM이 사용되었으며, 이 수치는 신형 배터리 전기자동차 모델마다 증가하고 있습니다. EV의 열 관리 시스템은 수지의 크리프 저항성과 화학적 불활성을 향상시켜 보닛 아래의 열 사이클을 견디는 얇은 부품을 구현할 수 있습니다. 윈도우 레귤레이터 등의 슬라이드 기구에서는 POM제 기어를 채용하는 것으로, 수명에 걸친 소음·진동·거칠기(NVH) 목표를 달성하고 있습니다. 자동차 제조업체는 또한 가이드 레일, 씰, 힌지 핀과 같은 여러 하위 기능을 단일 사출 성형 모듈에 통합하여 중량 감소를 극대화하는 동시에 사용이 끝날 때 분해를 간소화합니다. 2024년 수요의 31.05%가 자동차 관련이라는 것은 차세대 모빌리티 솔루션에서 이 폴리머의 확고한 역할을 뒷받침합니다.
전기 및 전자 기기의 소형화
스마트폰, 웨어러블 기기, 5G 인프라에서 부품의 미세화는 마이크론 단위의 공차를 유지하는 치수 안정성 플라스틱 수요를 가속화하고 있습니다. POM의 저흡습성은 습윤 환경 하에서의 팽창을 방지하고 미세 피치 커넥터 및 마이크로 기어의 정확도를 보호합니다. 정전기 소산 등급은 칩 핸들링 지그의 정전기 방전 위험을 줄이고, 높은 유동성 등급은 카메라 모듈에 대해 0.25mm까지 얇은 성형을 가능하게 합니다. 소비자용 디바이스 제조업체는 이 수지의 가공 용이성을 활용하여 새로운 액추에이터 설계의 프로토타입을 가속화하여 시장 투입까지의 시간을 단축하고 있습니다. 수십 개의 미세 이동 부품을 필요로 하는 IoT 노드의 급증은 아시아태평양의 수탁 제조 거점에서 아세탈 공중합체의 적용 범위를 더욱 확대하고 있습니다.
바이오베이스 및 고성능 플라스틱과의 경쟁
지속가능성 목표를 배경으로 OEM 제조업체는 셀룰로오스 강화 아세탈과 완전 바이오 유래 폴리아미드의 실험을 진행하고 있습니다. 이들은 라이프사이클 배출량을 2자리 퍼센트 감소시킵니다. 항공우주 공급업체는 POM의 내열 한계 100℃를 초과하는 고온 부품에서 비용이 증가하면서 폴리에테르 에테르 케톤(PEEK)에 대한 대안을 검토 중입니다. 유럽의 소비재 시장에서는 규제 당국이 탄소 음수(탄소 배출량 마이너스)의 배합을 에코세의 경감으로 우대하고, 조달 판단에 영향을 주고 있습니다. 일부 의료기기 제조업체는 반복적인 증기 멸균 사이클을 견디는 멸균 안정적인 화학 물질로 전환하여 정밀 펌프 부품의 POM 점유율을 침식하고 있습니다. 기존 폴리머는 비용 성능 측면에서 우위를 유지하고 있지만, 환경 정보 공개 의무의 강화는 환경 친화적인 대체품이 존재하는 용도에 대한 수요를 위협받고 있습니다.
부문 분석
시트 카테고리는 2025년 세계 소비량의 64.78%를 차지했으며 자동차 도어 모듈, 전자기기 케이스, 산업용 커버 등에서의 광범위한 사용을 반영했습니다. 이 부문은 2031년까지 연평균 복합 성장률(CAGR) 5.05%를 유지할 것으로 예측됩니다. 압출 기술의 진보로 시트 두께의 공차는 ±3%까지 달성되어, 2차적인 평삭 가공을 필요로 하지 않고 복잡한 3차원 부품에의 직접 가공이 가능하게 되었습니다. 컨버터는 대형 패널의 열성형시에 휨을 일으키기 어려운 균일한 결정 형태를 높이 평가했습니다.
봉재·관재 형태는 사용온도 범위 내에서 치수 드리프트가 0.05mm를 초과해서는 안되는 기어, 스러스트 와셔, 유체 처리 매니폴드 등의 고정밀 틈새 시장에 대응합니다. 하이브리드 파워트레인 조립품과 공장 자동화 설비가 완만하면서도 꾸준한 성장을 견인하고 있습니다. '기타' 카테고리(주로 사출 성형에 의한 니어 넷 모양)는 알루미늄과 동등한 중량을 실현하면서 비용을 3분의 1로 억제하는 설계 기술자의 주목을 받고 있습니다. ASTM D6100 표준은 모든 형태의 공차 기준을 통일하여 세계 OEM 제조업체에게 여러 지역의 조달에 대한 확신을 제공합니다. 시트가 주류로 유지되는 반면, 적층 성형용 펠릿 원료의 보급으로 인해 2027년 이후에는 "기타" 하위 부문이 점차 확대될 수 있습니다.
폴리옥시메틸렌(POM) 시장 보고서는 형상 유형(시트, 막대, 튜브 등), 최종 사용자 산업(항공우주, 자동차, 전기, 전자, 산업, 기계 및 기타 최종 사용자 산업), 지역(아시아태평양, 북미, 유럽, 남미, 중동, 아프리카)별로 분류됩니다. 시장 예측은 수량(톤) 및 금액(달러)으로 제공됩니다.
지역별 분석
아시아태평양은 수직 통합 공급망과 중국, 인도, 동남아시아 OEM 제조업체 수요 급증에 힘입어 2025년 출하량의 66.70%를 차지했습니다. 일본 제조업체는 정밀 기어에 선호되는 고결정성 공중합체공급을 계속하고 있는 한편, 한국공급업체는 반도체 제조 장치용 전도성 등급의 보급을 추진하고 있습니다. 호치민시와 푸네 주변의 산업집적지에서는 시판시트에서 자동차부품으로의 전환이 가속되어 지역의 자급자족 체제가 강화되고 있습니다.
중동 및 아프리카는 2031년까지 연평균 복합 성장률(CAGR) 5.90%로 가장 급속한 확대 궤도를 나타냅니다. SABIC의 페트로케미야와 같은 메가사이트에서는 메탄올·포름알데히드·하류 폴리머 제조 설비를 통합하여 원료 안정성과 에너지 효율을 실현하고 있습니다. 아랍에미리트(UAE)의 항공우주 부품 제조업체는 알루미늄에서 벗어나고 걸프 항공사의 장비 확장 계획을 지원하기 위해 POM을 현지 조달합니다. 이 지역이 아시아와 유럽의 소비지 중간에 위치한 이점은 수출업체의 운송 비용 절감에 기여하고 있으며, 홍해 항로의 병목에 의해 이 효과는 더욱 증폭되고 있습니다.
북미와 유럽은 기술적 우위를 유지하고 저포름알데히드 함량과 재생재 함유형의 연구개발 파이프라인을 육성하고 있습니다. 미시간과 바이에른의 자동차 Tier 1 공급업체는 수지 제조 업체와 협력하여 제조 공정까지의 라이프 사이클 평가를 실시. 순환형 경제와의 적합성을 확보하기 위해, 사양 범위의 협소화를 추진하고 있습니다. 남미 시장은 미성숙하면서 브라질의 자동차 산업 회랑에서 제조 투자의 혜택을 받고 있으며, 아세탈 수요는 현지 연료 시스템 생산과 연동하고 있습니다. 전반적으로 아시아태평양은 메탄올 원료와 완제품 조립 라인이 모두 집중되어 우위를 유지하는 태세에 있다고 생각됩니다.
기타 혜택 :
- 엑셀 형식 시장 예측(ME) 시트
- 애널리스트 지원(3개월간)
자주 묻는 질문
목차
제1장 서론
- 조사 전제조건 및 시장 정의
- 조사 범위
제2장 조사 방법
제3장 주요 요약
제4장 시장 상황
- 시장 개요
- 시장 성장 촉진요인
- 자동차 경량화의 붐
- 전기 및 전자 기기 분야에 있어서 소형화
- 산업기계에서 금속에서 플라스틱으로의 전환
- 아시아태평양의 제조업 확대
- EV 내장용 저 VOC POM 등급
- 시장 성장 억제요인
- 바이오 베이스 플라스틱 및 고성능 플라스틱과의 경쟁
- 원재료 가격의 변동성과 무역장벽
- 메탄올에서 SAF(지속가능항공연료)로의 전용 밸류체인
- 밸류체인 분석
- 규제 상황
- 수출입 분석
- 가격 동향
- Porter's Five Forces 분석
- 공급기업의 협상력
- 구매자의 협상력
- 대체품의 위협
- 경쟁 기업 간 경쟁 관계
- 신규 진입업자의 위협
- 최종 용도 부문 동향
- 항공우주(항공우주 부품 생산수익)
- 자동차(자동차 생산 대수)
- 건축 및 건설(신축 건축 연면적)
- 전기 및 전자 기기(전기 및 전자 기기 생산 수익)
- 포장(플라스틱 포장 용량)
제5장 시장 규모와 성장 예측(금액 및 수량 기준)
- 형태별
- 시트
- 봉 및 튜브
- 기타
- 최종 사용자 업계별
- 항공우주
- 자동차
- 전기 및 전자 기기
- 산업 및 기계
- 기타 최종 사용자 업계
- 지역별
- 아시아태평양
- 중국
- 일본
- 인도
- 한국
- 호주
- 말레이시아
- 기타 아시아태평양
- 북미
- 캐나다
- 멕시코
- 미국
- 유럽
- 독일
- 프랑스
- 이탈리아
- 영국
- 러시아
- 기타 유럽
- 남미
- 브라질
- 아르헨티나
- 기타 남미
- 중동 및 아프리카
- 사우디아라비아
- 아랍에미리트(UAE)
- 나이지리아
- 남아프리카
- 기타 중동 및 아프리카
- 아시아태평양
제6장 경쟁 구도
- 시장 집중도
- 전략적 동향
- 시장 점유율(%)/순위 분석
- 기업 프로파일
- Celanese Corporation
- China BlueChemical Ltd.
- Delrin USA, LLC
- Henan Energy and Chemical Group Co., Ltd.
- Kolon BASF innoPOM, Inc.
- Korea Engineering Plastics Co., Ltd.
- LG Chem
- Mitsubishi Chemical Group Corporation
- Polyplastics Co., Ltd.(Daicel Group)
- SABIC
- Yuntianhua Group Co., Ltd.
제7장 시장 기회와 향후 전망
제8장 CEO를 위한 주요 전략적 과제
KTH 26.01.20Polyoxymethylene market size in 2026 is estimated at 1.80 million tons, growing from 2025 value of 1.72 million tons with 2031 projections showing 2.27 million tons, growing at 4.71% CAGR over 2026-2031.
Elevated demand stems from automotive lightweighting programs, electronics miniaturization, and the shift from metal to plastic in precision machinery. The implementation of tighter vehicle emission rules in the European Union, China, and the United States favors the broader adoption of dimensionally stable engineering resins. Original equipment manufacturers (OEMs) are designing single-material modules to reduce part counts and simplify recycling, an approach that reinforces the selection of acetal copolymers. Meanwhile, sustainability initiatives encourage producers to launch low-formaldehyde and recycled-content grades that meet regulatory thresholds without sacrificing mechanical integrity. On the competitive front, integrated Asian producers leverage captive methanol supply and proximity to downstream converters to reinforce cost advantages, while Western suppliers differentiate through specialty formulations aimed at electric vehicle (EV) interiors and semiconductor tooling.
Global Polyoxymethylene (POM) Market Trends and Insights
Automotive Lightweighting Boom
Carmakers specify acetal copolymers to reduce vehicle mass while retaining structural stiffness, particularly in fuel modules, door latches, and transmission components. The average automobile incorporated 8-10 lb of POM in 2024, a figure that increases with every new battery-electric model. EV thermal-management systems enhance the resin's creep resistance and chemical inertness, allowing for thinner-walled parts that withstand under-hood heat cycling. Sliding assemblies, such as window regulators, adopt POM gears to meet lifetime noise, vibration, and harshness (NVH) targets. Automakers also bundle several sub-functions-such as guide rails, seals, and hinge pins-into single, injection-molded modules, maximizing weight savings while simplifying end-of-life disassembly. The 31.05% slice of 2024 demand tied to automotive underlines the polymer's entrenched role in next-generation mobility solutions.
Miniaturization in Electrical and Electronics
Component scaling in smartphones, wearables, and 5G infrastructure intensifies demand for dimensionally stable plastics that hold micron-level tolerances. POM's low moisture uptake prevents swelling in humid environments, safeguarding precision in fine-pitch connectors and micro-gears. Static-dissipative grades mitigate electrostatic discharge risks in chip-handling fixtures, while high-flow variants enable thin-wall molding down to 0.25 mm for camera modules. Consumer device makers capitalize on the resin's easy machinability to rapidly prototype new actuator designs, thereby shortening the time-to-market. The surge of IoT nodes-each requiring dozens of miniature moving parts-further broadens the addressable base for acetal copolymers across Asia-Pacific contract manufacturing hubs.
Competition from Bio-based and High-Performance Plastics
Sustainability goals prompt OEMs to experiment with cellulose-reinforced acetal and fully bio-derived polyamides, which reduce life-cycle emissions by double-digit percentages. Aerospace suppliers are weighing the substitution of polyetheretherketone (PEEK) for hot-section parts operating above POM's 100 °C ceiling, despite the associated cost premium. In European consumer goods markets, regulators reward carbon-negative formulations through lower eco-taxes, thereby tilting sourcing decisions. Some medical-device firms are pivoting to sterilization-stable chemistries to withstand repeated steam cycles, thereby eroding the share of POM in precision pump components. Although the incumbent polymer retains a cost-performance sweet spot, rising environmental disclosure obligations threaten demand in applications where drop-in greener alternatives exist.
Other drivers and restraints analyzed in the detailed report include:
- Metal-to-Plastic Shift in Industrial Machinery
- Manufacturing Expansion in Asia-Pacific
- Raw-Material Price Volatility and Trade Barriers
For complete list of drivers and restraints, kindly check the Table Of Contents.
Segment Analysis
The sheet category accounted for 64.78% of global consumption in 2025, reflecting its widespread use in automotive door modules, electronics housings, and industrial covers. The segment is also projected to pace a 5.05% CAGR through 2031. Extrusion advances now yield sheet thickness tolerances of +-3%, allowing for direct machining into complex three-dimensional parts without the need for secondary planing. Converters appreciate the material's uniform crystalline morphology, which resists warp during thermoforming of large panels.
Rod and tube forms serve high-precision niches, such as gears, thrust washers, and fluid-handling manifolds, where dimensional drift cannot exceed 0.05 mm over the service temperature range. Hybrid powertrain assemblies and factory automation equipment drive modest but steady growth. The "others" bucket-principally injection-molded near-net-shapes-attracts design engineers seeking weight parity with aluminum at one-third the cost. The ASTM D6100 specification unifies tolerance benchmarks across all form factors, providing global OEMs with confidence in multi-regional sourcing. Although sheet will remain dominant, the proliferation of additive-manufacturing feedstock pellets could gradually elevate the "others" sub-segment after 2027.
The Polyoxymethylene (POM) Market Report is Segmented by Form Type (Sheet, Rod and Tube, and Others), End-User Industry (Aerospace, Automotive, Electrical and Electronics, Industrial and Machinery, and Other End-User Industries), and Geography (Asia-Pacific, North America, Europe, South America, and Middle-East and Africa). The Market Forecasts are Provided in Terms of Volume (Tons) and Value (USD).
Geography Analysis
Asia-Pacific contributed 66.70% of 2025 shipments, buoyed by vertically integrated supply chains and surging demand from Chinese, Indian, and Southeast Asian OEMs. Japanese producers continue supplying high-crystallinity copolymers favored in precision gears, while Korean suppliers push electro-conductive grades for semiconductor tooling. Clusters around Ho Chi Minh City and Pune accelerate the conversion of off-the-shelf sheet into automotive assemblies, reinforcing regional self-sufficiency.
The Middle-East and Africa exhibit the fastest trajectory at 5.90% CAGR through 2031. Mega-sites like SABIC's Petrokemya integrate methanol, formaldehyde, and downstream polymer units, conferring feedstock stability and energy efficiency. Aerospace parts makers in the United Arab Emirates diversify away from aluminum, sourcing POM locally to support Gulf carrier fleet expansion plans. The region's location between Asian and European consumer bases helps exporters minimize freight costs, a factor amplified by Red Sea shipping bottlenecks.
North America and Europe maintain technology leadership, nurturing research and development pipelines for low-formaldehyde and recycled-content variants. Automotive Tier-1 suppliers in Michigan and Bavaria collaborate with resin producers on cradle-to-gate life-cycle assessments, advocating for narrower specification windows that ensure compatibility with the circular economy. South American markets remain nascent but benefit from manufacturing investments in Brazil's automotive corridor, where acetal demand aligns with localized fuel system production. Overall, the Asia-Pacific region appears poised to maintain its dominance, given its concentration of both methanol feedstock and finished goods assembly lines.
- Celanese Corporation
- China BlueChemical Ltd.
- Delrin USA, LLC
- Henan Energy and Chemical Group Co., Ltd.
- Kolon BASF innoPOM, Inc.
- Korea Engineering Plastics Co., Ltd.
- LG Chem
- Mitsubishi Chemical Group Corporation
- Polyplastics Co., Ltd. (Daicel Group)
- SABIC
- Yuntianhua Group Co., Ltd.
Additional Benefits:
- The market estimate (ME) sheet in Excel format
- 3 months of analyst support
TABLE OF CONTENTS
1 Introduction
- 1.1 Study Assumptions and Market Definition
- 1.2 Scope of the Study
2 Research Methodology
3 Executive Summary
4 Market Landscape
- 4.1 Market Overview
- 4.2 Market Drivers
- 4.2.1 Automotive Lightweighting Boom
- 4.2.2 Miniaturisation in Electrical and Electronics
- 4.2.3 Metal-to-plastic Shift in Industrial Machinery
- 4.2.4 Manufacturing Expansion in Asia-Pacific
- 4.2.5 Low-VOC POM Grades for EV Interiors
- 4.3 Market Restraints
- 4.3.1 Competition from Bio-based and High-performance Plastics
- 4.3.2 Raw-material Price Volatility and Trade Barriers
- 4.3.3 Methanol Diversion to SAF Value-chain
- 4.4 Value Chain Analysis
- 4.5 Regulatory Landscape
- 4.6 Import and Export Analysis
- 4.7 Price Trends
- 4.8 Porter's Five Forces Analysis
- 4.8.1 Bargaining Power of Suppliers
- 4.8.2 Bargaining Power of Buyers
- 4.8.3 Threat of Substitutes
- 4.8.4 Competitive Rivalry
- 4.8.5 Threat of New Entrants
- 4.9 End-use Sector Trends
- 4.9.1 Aerospace (Aerospace Component Production Revenue)
- 4.9.2 Automotive (Automobile Production)
- 4.9.3 Building and Construction (New Construction Floor Area)
- 4.9.4 Electrical and Electronics (Electrical and Electronics Production Revenue)
- 4.9.5 Packaging (Plastic Packaging Volume)
5 Market Size and Growth Forecasts (Value and Volume)
- 5.1 By Form Type
- 5.1.1 Sheet
- 5.1.2 Rod and Tube
- 5.1.3 Others
- 5.2 By End-user Industry
- 5.2.1 Aerospace
- 5.2.2 Automotive
- 5.2.3 Electrical and Electronics
- 5.2.4 Industrial and Machinery
- 5.2.5 Other End-user Industries
- 5.3 By Geography
- 5.3.1 Asia-Pacific
- 5.3.1.1 China
- 5.3.1.2 Japan
- 5.3.1.3 India
- 5.3.1.4 South Korea
- 5.3.1.5 Australia
- 5.3.1.6 Malaysia
- 5.3.1.7 Rest of Asia-Pacific
- 5.3.2 North America
- 5.3.2.1 Canada
- 5.3.2.2 Mexico
- 5.3.2.3 United States
- 5.3.3 Europe
- 5.3.3.1 Germany
- 5.3.3.2 France
- 5.3.3.3 Italy
- 5.3.3.4 United Kingdom
- 5.3.3.5 Russia
- 5.3.3.6 Rest of Europe
- 5.3.4 South America
- 5.3.4.1 Brazil
- 5.3.4.2 Argentina
- 5.3.4.3 Rest of South America
- 5.3.5 Middle-East and Africa
- 5.3.5.1 Saudi Arabia
- 5.3.5.2 United Arab Emirates
- 5.3.5.3 Nigeria
- 5.3.5.4 South Africa
- 5.3.5.5 Rest of Middle-East and Africa
- 5.3.1 Asia-Pacific
6 Competitive Landscape
- 6.1 Market Concentration
- 6.2 Strategic Moves
- 6.3 Market Share (%)/Ranking Analysis
- 6.4 Company Profiles (includes Global level Overview, Market level overview, Core Segments, Financials as available, Strategic Information, Market Rank/Share for key companies, Products and Services, and Recent Developments)
- 6.4.1 Celanese Corporation
- 6.4.2 China BlueChemical Ltd.
- 6.4.3 Delrin USA, LLC
- 6.4.4 Henan Energy and Chemical Group Co., Ltd.
- 6.4.5 Kolon BASF innoPOM, Inc.
- 6.4.6 Korea Engineering Plastics Co., Ltd.
- 6.4.7 LG Chem
- 6.4.8 Mitsubishi Chemical Group Corporation
- 6.4.9 Polyplastics Co., Ltd. (Daicel Group)
- 6.4.10 SABIC
- 6.4.11 Yuntianhua Group Co., Ltd.
7 Market Opportunities and Future Outlook
- 7.1 White-space and Unmet-Need Assessment