|
시장보고서
상품코드
1685747
데이터센터 시장 : 점유율 분석, 산업 동향 및 통계, 성장 예측(2025-2030년)Data Center - Market Share Analysis, Industry Trends & Statistics, Growth Forecasts (2025 - 2030) |
||||||
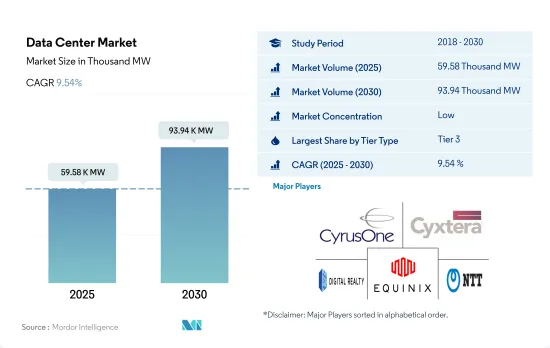
세계의 데이터센터 시장 규모는 2025년 5만 9,580MW로 추정되며, 2030년에는 9만 3,940MW에 이르고 CAGR 9.54%로 성장할 것으로 예측됩니다.
게다가 2025년 코로케이션 수익은 696억 3,250만 달러, 2030년에는 1,326억 6,070만 달러에 달할 것으로 예측되고, 예측 기간 중(2025-2030년) CAGR 13.76%로 성장할 것으로 예상됩니다.
2023년 시장 점유율은 Tier 3 데이터센터가 대부분을 차지했고 예측 기간 동안 Tier 4 부문이 가장 빠르게 성장할 것으로 예측됨
- 현재 Tier 3 부문이 시장의 주요 점유율을 차지하고 있습니다. 이 계층의 가동률은 약 99.982%로, 다운타임은 연간 1.6시간입니다.
- 2022년 IT 부하 용량은 6,857.78MW로, 유럽이 최고 점유율을 차지하고 있습니다. 아일랜드에서는 더블린이 Tier 3 시설의 98% 이상을 보유한 유일한 지역이며 북 더블린과 남 더블린이 큰 점유율을 차지하고 있습니다.
- Tier 4 부문은 예측 기간 동안 16.2%의 연평균 복합 성장률(CAGR)을 나타낼 것으로 예상됩니다. 다양한 선진국들은 모든 컴포넌트의 완전한 내결함성과 중복성의 이점을 얻기 위해 Tier 4 인증의 채택에 주력하고 있습니다. 따라서 많은 개발지역도 Tier 4 Zone을 채용하고 있습니다. 미국에서는 에너지 믹스의 20% 이상이 재생 가능 에너지로 차지되고 있으며, 2030년에는 50%를 나타낼 것으로 예상되고 있습니다. 개발중인 데이터센터 시설의 대부분은 IT 전력을 강화하고 있습니다.
- 전체 트래픽의 70% 이상이 서버에서 서버로 이동하기 때문에 Tier 1 및 Tier 2 부문의 성장은 가장 작습니다. 최근의 용도는 데이터센터 내에서 더 빨리 이동하기 때문에 더 많은 데이터가 필요하고 대기 시간에 대한 집착이 강해지고 있습니다. Tier 1 및 Tier 2 데이터센터는 최소한의 성장에 머무를 것으로 예상되기 때문에 이러한 성장은 IT 부하가 최소한 중소기업을 위한 시설에서만 기대할 수 있습니다.
북미가 큰 점유율을 차지하고 조사 기간 동안 APAC가 가장 급성장할 전망
- 데이터센터 시장은 북미, 유럽, 아시아태평양에 크게 집중되어 있습니다. 버지니아 주 북부는 미국 최대의 데이터센터 핫스팟으로 2022년 데이터센터 설치 용량의 13.07% 이상을 차지합니다. 그러나 시장은 이미 성숙기를 맞이하고 있기 때문에 향후 시장 점유율은 2029년까지 감소세를 보일 것으로 예상됩니다. 버지니아는 법적 투자 및 고용 요구 사항을 충족하는 데이터센터에서 구입한 자격을 갖춘 컴퓨터 장비에 소매 판매세 및 사용세 면제를 제공합니다. 버지니아는 코로케이션 데이터센터 테넌트가 소비세 면제의 혜택을 받을 수 있도록 한 최초의 주입니다. 버지니아는 또한 고밀도로 놓인 섬유 백본의 혜택을 받고 있습니다. 버지니아 비치는 4개의 새로운 대양 횡단 섬유 연결 케이블의 착지점입니다.
- 유럽에서는 프랑크푸르트, 런던/슬로우, 암스테르담, 파리, 더블린 등 FLAP-D의 메트로 시장에 시장이 집중하고 있습니다. 런던의 지가는 평방 피트당 약 150달러입니다. 런던의 지가가 높기 때문에 지가가 저렴한 다른 도시로 투자가 이동할 것으로 예상됩니다. 예를 들어 암스테르담은 FLAP 데이터센터 시장의 시설 건설에 필요한 토지 가격이 저렴하며 평방 피트당 38달러입니다.
- 아시아태평양에서는 호주가 데이터센터의 성장에 눈에 띄는 국가 중 하나입니다. 이 나라는 신재생에너지에 힘을 쏟고 있으며 데이터센터의 주요 거점이 되고 있습니다. 시드니는 현재 뉴사우스웨일즈의 풍력 발전소와 태양광 발전소에서 발전된 100% 재생 가능 에너지를 사용하고 있습니다. 멜버른에서는 빅토리아 주 정부가 이 지역의 AI 스타트업 개발을 지원하기 위해 9,500만 달러를 확보하고 있습니다. 기술 개발 기지가 증가함에 따라 데이터센터 수요가 크게 증가할 것으로 예상됩니다.
세계 데이터센터 시장 동향
데이터 소비 증가, 스마트 서비스, 소셜 네트워킹, 현금없는 결제, 스마트 홈 자동화 서비스 등 디지털화 용도 증가가 시장 성장을 견인
- 세계의 데이터 소비량은 2016년의 1.8GB/월에서 2022년에는 7.6GB/월로 증가했습니다. 2029년에는 26GB/월에 도달할 것으로 추정됩니다. 스마트 홈 자동화 서비스 등, 디지털화 용도 증가가 데이터 소비를 세계적으로 밀어 올리고 있습니다.
- 그러나 아프리카에서는 먼저 4G 서비스를 강화하고 그 후 5G를 전개할 계획이기 때문에 전개는 늦어지고 있습니다. 하지만, 사용자의 데이터 소비를 밀어 올리고 있습니다.
- 세계의 데이터 소비량은 예측 기간 중에 더욱 증가해, 19.2%에 이를 것으로 예상됩니다.
온라인 쇼핑, 소셜 네트워킹, 택시 예약, 디지털 거래, 식품 주문 등 디지털화 서비스의 확대가 시장 수요를 이끌 것으로 예상됩니다.
- 2022년 세계 인구는 79억 1,000만 명으로 추정되며 인터넷 사용자는 49억 5,000만 명, 활성 소셜 미디어 사용자는 46억 2,000만 명입니다. 전 세계 사용자가 인터넷을 이용하는 시간은 하루 평균 약 6시간입니다. 사용자 수는 예측 기간 중(2023-2029년) CAGR 4.6%를 나타낼 것으로 예상됩니다. 온라인 쇼핑, 소셜 네트워킹, 택시 예약, 디지털 거래, 식품 주문 등 디지털화 서비스의 확대로 데이터 소비량이 증가할 것으로 예상됩니다. 데이터 소비량은 예측 기간 중에 18.6%의 성장이 예상됩니다. 인터넷 이용자가 90%를 초과하는 지역에는 북미, 북유럽, 서유럽이 포함됩니다.
- 그러나 스마트폰 사용자 수로는 아시아태평양이 세계를 선도하고 있습니다. 2022년 스마트폰 사용자 수는 26억 4,700만 명으로 추정되며, 2029년에는 44억 5,600만 명에 이를 수 있습니다. 이 지역의 스마트폰 사용자 수는 예측 기간 동안 CAGR 7.5%를 나타낼 것으로 예측됩니다. 5G의 도입으로 지역 사용자는 여러 디지털화 서비스에 액세스할 수 있습니다.
- 아랍에미리트(UAE), 한국, 중국, 네덜란드는 각각 136.4Mbps, 106.9Mbps, 96.3Mbps, 94.9Mbps의 인터넷 속도로 세계적으로 선도하고 있습니다. 통신 및 스마트 디바이스에서의 첨단 기술의 도입과 디지털화 서비스를 이용하는 사람 증가가 향후 세계 데이터센터 시장의 성장을 이끌 것으로 예상됩니다.
데이터센터 산업 개요
데이터센터 시장은 세분화되어 있으며 상위 5개 기업에서 19.69%를 차지하고 있습니다. 시장 주요 기업은 CyrusOne Inc., Cyxtera Technologies, Digital Realty Trust Inc., Equinix Inc. and NTT Ltd 등이 있습니다(알파벳순 정렬).
기타 혜택
- 엑셀 형식 시장 예측(ME) 시트
- 3개월간의 애널리스트 서포트
목차
제1장 주요 요약과 주요 조사 결과
제2장 보고서 제안
제3장 소개
- 조사의 전제조건과 시장 정의
- 조사 범위
- 조사 방법
제4장 시장 전망
- 내하중
- 바닥면적
- 코로케이션 수입
- 설치 랙 수
- 랙 공간 이용률
- 해저 케이블
제5장 주요 업계 동향
- 스마트폰 사용자수
- 스마트폰 1대당 데이터 트래픽
- 모바일 데이터 속도
- 광대역 데이터 속도
- 광섬유 접속 네트워크
- 규제 프레임워크
- 호주
- 오스트리아
- 벨기에
- 브라질
- 캐나다
- 칠레
- 중국
- 덴마크
- 프랑스
- 독일
- 홍콩
- 인도
- 인도네시아
- 아일랜드
- 이스라엘
- 이탈리아
- 일본
- 말레이시아
- 멕시코
- 네덜란드
- 뉴질랜드
- 나이지리아
- 노르웨이
- 필리핀
- 폴란드
- 러시아
- 사우디아라비아
- 싱가포르
- 남아프리카
- 한국
- 스페인
- 스웨덴
- 스위스
- 대만
- 태국
- 아랍에미리트(UAE)
- 영국
- 미국
- 베트남
- 밸류체인과 유통채널 분석
제6장 시장 세분화
- 데이터센터의 규모
- 대규모
- 대규모
- 중규모
- 메가
- 소규모
- 티어 유형
- Tier 1 및 Tier 2
- Tier 3
- Tier 4
- 흡수
- 비이용
- 이용
- 코로케이션 유형별
- 하이퍼스케일
- 소매
- 홀세일
- 최종 사용자별
- BFSI
- 클라우드
- 전자상거래
- 정부기관
- 제조업
- 미디어 및 엔터테인먼트
- 텔레콤
- 기타 최종 사용자
- 지역
- APAC
- 아프리카
- 유럽
- 중동
- 북미
- 남미
제7장 경쟁 구도
- 시장 점유율 분석
- 기업 상황
- 기업 프로파일
- AirTrunk Operating Pty Ltd
- Chindata Group Holdings Ltd
- CyrusOne Inc.
- Cyxtera Technologies
- Digital Realty Trust Inc.
- Equinix Inc.
- Flexential Corp.
- NTT Ltd
- Quality Technology Services
- Space DC Pte Ltd
- Switch
- Vantage Data Centers LLC
- LIST OF COMPANIES STUDIED
제8장 CEO에 대한 주요 전략적 질문
제9장 부록
- 세계의 개요
- 개요
- Porter's Five Forces 분석 프레임워크
- 세계의 밸류체인 분석
- 세계 시장 규모와 DRO
- 정보원과 참고문헌
- 도표 목록
- 주요 인사이트
- 데이터 팩
- 용어집
The Data Center Market size is estimated at 59.58 thousand MW in 2025, and is expected to reach 93.94 thousand MW by 2030, growing at a CAGR of 9.54%. Further, the market is expected to generate colocation revenue of USD 69,632.5 Million in 2025 and is projected to reach USD 132,660.7 Million by 2030, growing at a CAGR of 13.76% during the forecast period (2025-2030).
Tier 3 data centers accounted for majority market share in 2023, and the Tier 4 segment is expected to be the fastest growing during the forecast period
- The tier 3 segment currently holds a major share of the market. These tiers have an uptime of around 99.982%, translating into a downtime of 1.6 hours per year. With the increasing adoption of edge and cloud connectivity, the tier 3 segment is expected to grow further in the future.
- Europe held a leading market share, with a 6,857.78 MW IT load capacity in 2022. The United Kingdom hosts the maximum number of tier 3 data centers, with Slough and Greater London holding a major share. In Ireland, Dublin is the only region that hosts more than 98% of the tier 3 facilities, with North and South Dublin holding a major share. The tier 3 segment in Europe is expected to grow from 7,979.69 MW in 2023 to 12,110.18 MW in 2029, at a CAGR of 7.20%.
- The tier 4 segment is expected to record a CAGR of 16.2% during the forecast period. Various developed countries are focusing on adopting a Tier 4 certification to get the advantage of complete fault tolerance and redundancy for every component. Therefore, many developing regions are also adopting the tier 4 zone. In the United States, over 20% of the energy mix is contributed by renewable energy, which is expected to reach 50% by 2030. The majority of data center facilities under development are adding more IT power.
- The tier 1 & 2 segment had the least growth as more than 70% of all traffic moves from server to server. Modern applications require significantly more data to travel within a data center at faster speeds and are more particular about latency. Since tier 1 & 2 data centers are projected to witness minimal growth, such growth is only expected from facilities that cater to SMEs with a minimal IT load.
North America holds the major share and APAC is expected to be the fastest growing during the study period
- The data center market has been largely concentrated in North America, Europe, and Asia-Pacific. Northern Virginia is the largest data center hotspot in the United States, accounting for over 13.07% of the data center installed capacity in 2022. However, the future market share is expected to reflect a decreasing trend until 2029, as the market has already reached maturity. Virginia offers an exemption from retail sales and uses tax for qualifying computer equipment purchased by data centers that meet statutory investment and employment requirements. Virginia was the first state to allow the tenants of colocation data centers to receive the benefits of sales tax exemption. Virginia also benefits from densely packed fiber backbones. Virginia Beach is the landing point for four new transoceanic fiber connection cables.
- In Europe, the market is concentrated in FLAP-D metro markets, including Frankfurt, London/Slough, Amsterdam, Paris, and Dublin. The land price in London is around USD 150 per sq. ft. Higher land costs in London are expected to shift investments to other cities with lower land prices. For instance, Amsterdam has a lower land price for building facilities in the FLAP data center market, which is USD 38 per sq. ft.
- In Asia-Pacific, Australia is one of the prominent countries in terms of the growth of data centers. The country is a major hub for data centers due to its focus on renewable energy. Sydney is now powered using 100% renewable electricity generated from wind and solar farms in regional NSW. In Melbourne, the Victorian government has also set aside USD 95 million to support AI startup development in the region. With increasing technology development hubs, the demand for data centers is expected to increase significantly.
Global Data Center Market Trends
Rising data consumption, growing number of digitalization applications, such as smart services, social networking, cashless payments, smart home automation services, and other applications drive the market's growth
- Global data consumption increased from 1.8 GB/month in 2016 to 7.6 GB/month in 2022. It is estimated to reach 26 GB/month by 2029. The growing number of digitalization applications, such as smart services, social networking, cashless payments, smart home automation services, and others, has boosted data consumption globally. A few countries, such as China and the United States, have already implemented 6G, while multiple countries are still implementing phases of 5G.
- However, in Africa, the deployment has been slow as the region plans to strengthen its 4G services first and then roll out 5G. The growing demand for online streaming services such as Netflix, Disney+, and Amazon Prime is boosting the consumption of data among users. The data consumed per smartphone increased from 1.8 GB/month in 2016 to 9.1 GB/month in 2023, which may reach 26 GB/month by 2029.
- Global data consumption is expected to grow further during the forecast period, reaching 19.2%. The leading regions in terms of data consumption are Africa, North America, and the Middle East, with 25.8%, 24.6%, and 23.9%, respectively. The increasing data consumption due to high bandwidth speeds and the growing adoption of digitalization services and IoT platforms may boost the demand for data centers globally.
Growing digitalization services such as online shopping, social networking, cab booking, digital transactions, food orders, and other services are expected to drive the market demand
- The global population was estimated at 7.91 billion in 2022, with 4.95 billion internet users and 4.62 billion active social media users. On average, global users spend around 6 hours using the internet daily. The number of users is expected to record a CAGR of 4.6% during the forecast period (2023-2029). Growing digitalization services such as online shopping, social networking, cab booking, digital transactions, food orders, and other services are expected to increase data consumption. The data consumption is expected to grow by 18.6% during the forecast period. The regions with more than 90% internet users include North America and Northern and Western Europe.
- However, Asia-Pacific leads globally in terms of the number of smartphone users. The number of smartphone users was estimated at 2,647 million in 2022, which may reach 4,456 million by 2029. The region is estimated to record a CAGR of 7.5% in terms of the number of smartphone users during the forecast period. The deployment of 5G has helped users gain access to multiple digitalization services in the region.
- The United Arab Emirates, South Korea, China, and the Netherlands are the leading countries globally, with internet speeds of 136.4 Mbps, 106.9 Mbps, 96.3 Mbps, and 94.9 Mbps, respectively. The implementation of advanced technologies in telecommunication and smart devices and the growing number of people using digitalization services are expected to drive the growth of the global data center market in the future.
Data Center Industry Overview
The Data Center Market is fragmented, with the top five companies occupying 19.69%. The major players in this market are CyrusOne Inc., Cyxtera Technologies, Digital Realty Trust Inc., Equinix Inc. and NTT Ltd (sorted alphabetically).
Additional Benefits:
- The market estimate (ME) sheet in Excel format
- 3 months of analyst support
TABLE OF CONTENTS
1 EXECUTIVE SUMMARY & KEY FINDINGS
2 REPORT OFFERS
3 INTRODUCTION
- 3.1 Study Assumptions & Market Definition
- 3.2 Scope of the Study
- 3.3 Research Methodology
4 MARKET OUTLOOK
- 4.1 It Load Capacity
- 4.2 Raised Floor Space
- 4.3 Colocation Revenue
- 4.4 Installed Racks
- 4.5 Rack Space Utilization
- 4.6 Submarine Cable
5 Key Industry Trends
- 5.1 Smartphone Users
- 5.2 Data Traffic Per Smartphone
- 5.3 Mobile Data Speed
- 5.4 Broadband Data Speed
- 5.5 Fiber Connectivity Network
- 5.6 Regulatory Framework
- 5.6.1 Australia
- 5.6.2 Austria
- 5.6.3 Belgium
- 5.6.4 Brazil
- 5.6.5 Canada
- 5.6.6 Chile
- 5.6.7 China
- 5.6.8 Denmark
- 5.6.9 France
- 5.6.10 Germany
- 5.6.11 Hong Kong
- 5.6.12 India
- 5.6.13 Indonesia
- 5.6.14 Ireland
- 5.6.15 Israel
- 5.6.16 Italy
- 5.6.17 Japan
- 5.6.18 Malaysia
- 5.6.19 Mexico
- 5.6.20 Netherlands
- 5.6.21 New Zealand
- 5.6.22 Nigeria
- 5.6.23 Norway
- 5.6.24 Philippines
- 5.6.25 Poland
- 5.6.26 Russia
- 5.6.27 Saudi Arabia
- 5.6.28 Singapore
- 5.6.29 South Africa
- 5.6.30 South Korea
- 5.6.31 Spain
- 5.6.32 Sweden
- 5.6.33 Switzerland
- 5.6.34 Taiwan
- 5.6.35 Thailand
- 5.6.36 United Arab Emirates
- 5.6.37 United Kingdom
- 5.6.38 United States
- 5.6.39 Vietnam
- 5.7 Value Chain & Distribution Channel Analysis
6 MARKET SEGMENTATION (INCLUDES MARKET SIZE IN VOLUME, FORECASTS UP TO 2030 AND ANALYSIS OF GROWTH PROSPECTS)
- 6.1 Data Center Size
- 6.1.1 Large
- 6.1.2 Massive
- 6.1.3 Medium
- 6.1.4 Mega
- 6.1.5 Small
- 6.2 Tier Type
- 6.2.1 Tier 1 and 2
- 6.2.2 Tier 3
- 6.2.3 Tier 4
- 6.3 Absorption
- 6.3.1 Non-Utilized
- 6.3.2 Utilized
- 6.3.2.1 By Colocation Type
- 6.3.2.1.1 Hyperscale
- 6.3.2.1.2 Retail
- 6.3.2.1.3 Wholesale
- 6.3.2.2 By End User
- 6.3.2.2.1 BFSI
- 6.3.2.2.2 Cloud
- 6.3.2.2.3 E-Commerce
- 6.3.2.2.4 Government
- 6.3.2.2.5 Manufacturing
- 6.3.2.2.6 Media & Entertainment
- 6.3.2.2.7 Telecom
- 6.3.2.2.8 Other End User
- 6.4 Region
- 6.4.1 APAC
- 6.4.2 Africa
- 6.4.3 Europe
- 6.4.4 Middle East
- 6.4.5 North America
- 6.4.6 South America
7 COMPETITIVE LANDSCAPE
- 7.1 Market Share Analysis
- 7.2 Company Landscape
- 7.3 Company Profiles (includes Global Level Overview, Market Level Overview, Core Business Segments, Financials, Headcount, Key Information, Market Rank, Market Share, Products and Services, and Analysis of Recent Developments).
- 7.3.1 AirTrunk Operating Pty Ltd
- 7.3.2 Chindata Group Holdings Ltd
- 7.3.3 CyrusOne Inc.
- 7.3.4 Cyxtera Technologies
- 7.3.5 Digital Realty Trust Inc.
- 7.3.6 Equinix Inc.
- 7.3.7 Flexential Corp.
- 7.3.8 NTT Ltd
- 7.3.9 Quality Technology Services
- 7.3.10 Space DC Pte Ltd
- 7.3.11 Switch
- 7.3.12 Vantage Data Centers LLC
- 7.4 LIST OF COMPANIES STUDIED
8 KEY STRATEGIC QUESTIONS FOR DATA CENTER CEOS
9 APPENDIX
- 9.1 Global Overview
- 9.1.1 Overview
- 9.1.2 Porter's Five Forces Framework
- 9.1.3 Global Value Chain Analysis
- 9.1.4 Global Market Size and DROs
- 9.2 Sources & References
- 9.3 List of Tables & Figures
- 9.4 Primary Insights
- 9.5 Data Pack
- 9.6 Glossary of Terms