


|
시장보고서
상품코드
1685797
아시아태평양의 생물촉진제 시장(2025-2030년) : 시장 점유율 분석, 산업 동향 및 성장 예측Asia-Pacific Biostimulants - Market Share Analysis, Industry Trends & Statistics, Growth Forecasts (2025 - 2030) |
||||||
■ 보고서에 따라 최신 정보로 업데이트하여 보내드립니다. 배송일정은 문의해 주시기 바랍니다.
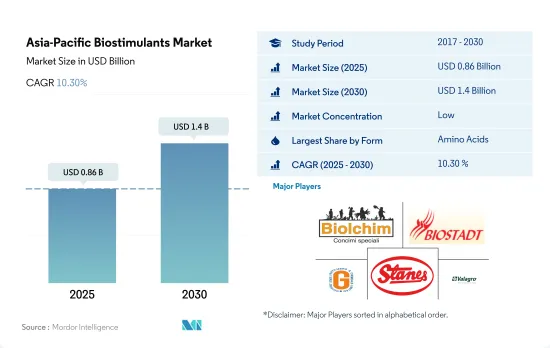
아시아태평양의 생물촉진제 시장 규모는 2025년에는 8억 6,000만 달러로 추정되며, 2030년에는 14억 달러에 이를 것으로 예측되고, 예측 기간(2025-2030년) 동안 CAGR 10.30%로 성장할 전망입니다.

- 현대농업은 인류의 가장 어려운 과제 해결에 중심적인 역할을 하고 있습니다.
- 토양질의 악화는 이 지역의 농가와 농업 종사자들 사이에서 큰 우려가 되고 있습니다.
- 그 결과 혁신적인 솔루션을 이용한 환경 친화적이고 지속 가능한 농법이 현대 농업의 표준 관행이 되고 있습니다. 생물촉진제는 환경에 영향이 적으며 현대 농업에 있어서 유망한 기술 혁신으로서 부상해 왔습니다.
- 아미노산은 아시아태평양에서 가장 일반적으로 사용되는 생물촉진제이며, 2022년 시장 점유율은 25.2%로 최대치를 달성했습니다.
- 인도와 중국과 같은 이 지역의 주요 농업국은 유기농업과 지속 가능한 농업 투입물의 사용을 촉진하기 위해 다양한 정책을 개시하고 있습니다.
- 아시아태평양에서는 유기 재배 식품에 대한 수요가 현저하게 증가하고 있으며, 그 결과 생물촉진제 시장이 급성장하고 있습니다. 재배면적은 2017년의 310만 헥타르에서 2022년에는 380만 헥타르로 증가했습니다.
- 기후 변화의 영향은 작물 생산에 심각한 영향을 미치고 있으며, 가뭄, 염분, 온도 변화와 같은 기후 스트레스를 완화하기 위해 생물촉진제를 사용하는 것이 필수적입니다. 생물촉진제의 사용은 식물에 긍정적인 영향을 미치는 것으로 입증되어 농업 생태계의 생태학적 균형을 유지하고 농약과 화학비료의 필요성을 줄이는데 도움이 됩니다.
- 아시아태평양에서는 중국, 인도, 호주가 생물촉진제의 주요 사업지역으로 부상하고 있습니다., 인센티브를 제공하고 연구개발에 투자하여 목표를 설정함으로써 농가가 지속 가능한 농법을 채용하도록 장려하고 있습니다.
- 아시아태평양의 생물촉진제 수요는 유기농업의 재배면적 증가와 지속 가능한 농업의 필요성으로 인해 증가 추세에 있습니다.
아시아태평양의 생물촉진제 시장 동향
중국, 인도, 인도네시아, 호주 등 국가의 정부 지원 확대가 이 지역의 유기농업을 뒷받침함
- FiBL의 통계에 따르면, 2021년에 아시아태평양의 유기농지면적은 370만 헥타르를 넘어 세계의 유기농지면적의 26.4%를 차지했습니다. 중국, 인도, 인도네시아, 호주는 이 지역에서 유기 재배 면적이 큰 주요 국가이며, 인도는 Krishi Vikas Yojana나 All India Network Programme on Organic Farming(AI-NPOF)과 같은 제도를 실시했습니다.
- 2021년에는 중국이 250만 헥타르로 66.1%로 최대 점유율을 차지했으며 인도, 인도네시아, 호주가 각각 19.3%, 1.5%, 1.4%의 점유율로 뒤를 이었습니다. 작물은 3가지 유형으로 나눌 수 있으며 그 중 줄뿌림작물은 이 지역의 유기농지의 67.5%를 점유하여 2021년에는 250만 헥타르를 차지하였습니다.
- 환금작물의 점유율은 2위이며 2021년에는 70만 헥타르를 차지하여 유기농지의 18.5%를 점유하였습니다.
유기농 제품에 대한 1인당 지출은 호주가 우세하고, 중국의 유기농 식품 시장이 크게 성장
- 아시아태평양의 유기농 제품에 대한 1인당 지출은 2021년에는 85.1달러를 기록했습니다. Trade에 따르면, 호주 유기농 포장 식음료 시장은 2021년에 8억 8,520만 달러에 달했습니다.
- 중국의 유기농 식품 시장은 2021년에 13.3% 성장했으며, 이 플러스 성장 패턴은 2023년부터 2029년까지 추정 CAGR 7.1%로 지속될 것으로 예상됩니다. 젊은 세대 사이에서 유기농 제품의 중요성이 점점 강조되고 있으며, 직장인 엄마 증가와 건강 및 웰니스 동향의 선호도 증가로 유기농 유아식품 수요가 증가하고 있기 때문에 유기농 제품은 2025년까지 64억 달러 규모에 달할 것으로 예상됩니다.
- 인도의 유기농 제품은 세계 수요의 1.0%에도 미치지 못하고 있으며 2021년 1인당 지출액은 불과 0.08달러였습니다. 소비자의 지식과 구매 의욕의 고조로 이 지역에서 유기농 식품의 지속 가능성의 특질에 대한 이해가 높아지고 있습니다.
아시아태평양 생물촉진제 산업 개요
아시아태평양의 생물촉진제 시장은 단편화되어 있으며 상위 5개사에서 8.79%를 차지하고 있습니다.
기타 혜택
- 엑셀 형식 시장 예측(ME) 시트
- 3개월간 애널리스트 지원
목차
제1장 주요 요약과 주요 조사 결과
제2장 보고서 제안
제3장 소개
- 조사의 전제조건과 시장 정의
- 조사 범위
- 조사 방법
제4장 주요 산업 동향
- 유기 재배 면적
- 1인당 유기농 제품에 대한 지출
- 규제 프레임워크
- 호주
- 중국
- 인도
- 인도네시아
- 일본
- 필리핀
- 태국
- 베트남
- 밸류체인과 유통채널 분석
제5장 시장 세분화
- 형태
- 아미노산
- 풀빅산
- 후민산
- 단백질 가수분해물
- 해초 추출물
- 기타 생물촉진제
- 작물 유형
- 환금작물
- 원예작물
- 줄뿌림작물
- 생산국
- 호주
- 중국
- 인도
- 인도네시아
- 일본
- 필리핀
- 태국
- 베트남
- 기타 아시아태평양
제6장 경쟁 구도
- 주요 전략 동향
- 시장 점유율 분석
- 기업 상황
- 기업 프로파일
- Agrinos
- Atlantica Agricola
- Biolchim SpA
- Biostadt India Limited
- Coromandel International Ltd
- Gujarat State Fertilizers & Chemicals Ltd.
- Plant Response Biotech Inc.
- Rallis India Ltd
- T. Stanes and Company Limited
- Valagro
제7장 CEO에 대한 주요 전략적 질문
제8장 부록
- 세계의 개요
- 개요
- Porter's Five Forces 분석 프레임워크
- 세계의 밸류체인 분석
- 시장 역학(DROs)
- 정보원과 참고문헌
- 도표 일람
- 주요 인사이트
- 데이터 팩
- 용어집
The Asia-Pacific Biostimulants Market size is estimated at 0.86 billion USD in 2025, and is expected to reach 1.4 billion USD by 2030, growing at a CAGR of 10.30% during the forecast period (2025-2030).
- Modern agriculture plays a central role in solving some of humanity's most challenging problems. As the population in the Asia-Pacific region grows, the agricultural sector is under pressure to meet the rising demand for food and achieve food security goals.
- The deterioration of soil quality has become a major concern among farmers and agriculturists in the region. This has resulted in a loss of fertility, biodiversity, and production capacity. The agriculture sector's most significant challenge is the increasing use of synthetic fertilizers and pesticides to boost agricultural production. According to studies, excessive fertilizer use could hasten the climate crisis.
- As a result, environmentally friendly and sustainable farming practices with innovative solutions are now standard practices in modern agriculture. To ensure adequate food production, the agricultural sector must embrace new solutions and approaches to improve resource utilization efficiency. Biostimulants have emerged as an environmentally friendly and promising innovation for modern agriculture in this regard. Amino acids, humic acid, fulvic acid, seaweed extract, and protein hydrolysates are among the most commonly used biostimulants.
- Amino acids are the most commonly used biostimulants in the Asia-Pacific region, with the largest market share of 25.2% in 2022. This is due to their ability to enhance plant productivity, especially under abiotic and biotic stress conditions.
- Major agricultural countries in the region, such as India and China, have launched various initiatives to promote organic farming and the use of sustainable agricultural inputs. They offer various incentives that may drive the market, and as a result, the market value is anticipated to record a CAGR of 11.9% between 2023 and 2029.
- The Asia-Pacific region has witnessed a remarkable increase in the demand for organically grown food, resulting in a surge in the biostimulants market. With countries like India, China, Australia, and Japan promoting organic farming, the area under organic cultivation increased from 3.1 million hectares in 2017 to 3.8 million hectares in 2022. As a result, the biostimulants market experienced a growth rate of 11.5% between 2017-2022.
- The impact of climate change has severely affected crop production, making it imperative to use biostimulants to mitigate climate-induced stresses like drought, salinity, and temperature variations. The application of biostimulants has proven to have a positive impact on plants and helps maintain the ecological balance of agroecosystems, reducing the need for pesticides and chemical fertilizers.
- China, India, and Australia have emerged as the major business areas for biostimulants in the Asia-Pacific region. In 2022, China dominated the biostimulants market with a 27.6% share, followed by India and Australia. The governments of these countries are encouraging farmers to adopt sustainable agricultural practices by providing incentives, investing in research and development, and setting targets to meet. For instance, Japan has set a goal to reduce the usage of chemical fertilizers and pesticides by 30.0% and 50.0%, respectively, by 2050.
- The demand for biostimulants in the Asia-Pacific region is on the rise due to the increasing area under organic farming and the need for sustainable agricultural practices. The biostimulants market in the Asia-Pacific region is expected to witness further growth in the coming years, with the potential to help combat the adverse effects of climate change on agriculture.
Asia-Pacific Biostimulants Market Trends
Growing government support in countries like China, India, Indonesia, and Australia, boosts organic farming in the region
- In 2021, the area of organic agricultural land in the Asia-Pacific region exceeded 3.7 million hectares, representing 26.4% of the global organic area, according to FiBL statistics. The organic area under cultivation grew by 19.3% between 2017 and 2022. As of 2020, the region had about 1.83 million organic producers, with India leading the way with 1.3 million organic producers. China, India, Indonesia, and Australia are the major countries with large organic cultivation areas in the region. Government authorities in countries such as China and India are continuously promoting organic agriculture to reduce reliance on chemical inputs for crop cultivation. India, for instance, has implemented schemes like Paramparagat Krishi Vikas Yojana and the All India Network Programme on Organic Farming (AI-NPOF).
- In 2021, China accounted for the largest share at 66.1% with 2.5 million hectares, followed by India, Indonesia, and Australia with shares of 19.3%, 1.5%, and 1.4%, respectively. The total organic land is divided into three crop types: row crops, horticultural crops, and cash crops. Row crops occupy the largest share of organic agricultural land in the region, accounting for 67.5% with 2.5 million hectares in 2021. Major row crops grown in the region include paddy, wheat, pulses, soybeans, and millets.
- Cash crops held the second largest share, with 0.7 million hectares in 2021, accounting for an 18.5% share of organic cropland. The demand for organic cash crops, such as sugar and organic tea, is increasing globally. China and India are the largest producers of organic green tea and organic black tea, respectively, globally. The growing international demand is expected to increase the organic acreages in the region.
Per capita spending on organic product predominant in Australia and China's organic food market growing significantly
- The per capita spending on organic products in the Asia-Pacific region was recorded at USD 85.1 in 2021. Australia witnessed a higher per capita spending on organic products, with USD 58.3 in 2021, which was attributed to the higher demand due to consumers' perception of organic food as healthy. According to Global Organics Trade, the organic packed food and beverage market in Australia stood at USD 885.2 million in 2021.
- China's organic food market grew by 13.3% in 2021, and the positive growth pattern is expected to continue with an estimated CAGR of 7.1% between 2023 and 2029. With an increasing emphasis on the importance of organic products among the younger generation and a rise in demand for organic baby food due to the growing number of working mothers and the increasing adoption of the health and wellness trend, organic products are expected to reach a value of USD 6.4 billion by 2025.
- Organic products in India represent far less than 1.0% of global demand, with a per capita expenditure of just USD 0.08 in 2021. However, India represents a promising market over the coming years, reaching a value of USD 153.3 million by 2025. Currently, the market for organic goods in the region is very fragmented, with just a few supermarkets and specialty stores selling them, as only people from higher-income families are potential customers. Growing consumer knowledge and buying motivations will lead to a better understanding of the sustainability qualities of organic food in the region. Increasing per capita income, along with increased consumer awareness of the importance of organic food intake, has the potential to raise per capita expenditure on organic food items in the Asia-Pacific region.
Asia-Pacific Biostimulants Industry Overview
The Asia-Pacific Biostimulants Market is fragmented, with the top five companies occupying 8.79%. The major players in this market are Biolchim SpA, Biostadt India Limited, Gujarat State Fertilizers & Chemicals Ltd., T. Stanes and Company Limited and Valagro (sorted alphabetically).
Additional Benefits:
- The market estimate (ME) sheet in Excel format
- 3 months of analyst support
TABLE OF CONTENTS
1 EXECUTIVE SUMMARY & KEY FINDINGS
2 REPORT OFFERS
3 INTRODUCTION
- 3.1 Study Assumptions & Market Definition
- 3.2 Scope of the Study
- 3.3 Research Methodology
4 KEY INDUSTRY TRENDS
- 4.1 Area Under Organic Cultivation
- 4.2 Per Capita Spending On Organic Products
- 4.3 Regulatory Framework
- 4.3.1 Australia
- 4.3.2 China
- 4.3.3 India
- 4.3.4 Indonesia
- 4.3.5 Japan
- 4.3.6 Philippines
- 4.3.7 Thailand
- 4.3.8 Vietnam
- 4.4 Value Chain & Distribution Channel Analysis
5 MARKET SEGMENTATION (includes market size in Value in USD and Volume, Forecasts up to 2030 and analysis of growth prospects)
- 5.1 Form
- 5.1.1 Amino Acids
- 5.1.2 Fulvic Acid
- 5.1.3 Humic Acid
- 5.1.4 Protein Hydrolysates
- 5.1.5 Seaweed Extracts
- 5.1.6 Other Biostimulants
- 5.2 Crop Type
- 5.2.1 Cash Crops
- 5.2.2 Horticultural Crops
- 5.2.3 Row Crops
- 5.3 Country
- 5.3.1 Australia
- 5.3.2 China
- 5.3.3 India
- 5.3.4 Indonesia
- 5.3.5 Japan
- 5.3.6 Philippines
- 5.3.7 Thailand
- 5.3.8 Vietnam
- 5.3.9 Rest of Asia-Pacific
6 COMPETITIVE LANDSCAPE
- 6.1 Key Strategic Moves
- 6.2 Market Share Analysis
- 6.3 Company Landscape
- 6.4 Company Profiles (includes Global Level Overview, Market Level Overview, Core Business Segments, Financials, Headcount, Key Information, Market Rank, Market Share, Products and Services, and Analysis of Recent Developments).
- 6.4.1 Agrinos
- 6.4.2 Atlantica Agricola
- 6.4.3 Biolchim SpA
- 6.4.4 Biostadt India Limited
- 6.4.5 Coromandel International Ltd
- 6.4.6 Gujarat State Fertilizers & Chemicals Ltd.
- 6.4.7 Plant Response Biotech Inc.
- 6.4.8 Rallis India Ltd
- 6.4.9 T. Stanes and Company Limited
- 6.4.10 Valagro
7 KEY STRATEGIC QUESTIONS FOR AGRICULTURAL BIOLOGICALS CEOS
8 APPENDIX
- 8.1 Global Overview
- 8.1.1 Overview
- 8.1.2 Porter's Five Forces Framework
- 8.1.3 Global Value Chain Analysis
- 8.1.4 Market Dynamics (DROs)
- 8.2 Sources & References
- 8.3 List of Tables & Figures
- 8.4 Primary Insights
- 8.5 Data Pack
- 8.6 Glossary of Terms


샘플 요청 목록