|
시장보고서
상품코드
1849931
스마트 교통 : 시장 점유율 분석, 산업 동향, 통계, 성장 예측(2025-2030년)Smart Transportation - Market Share Analysis, Industry Trends & Statistics, Growth Forecasts (2025 - 2030) |
||||||
스마트 교통 시장 규모는 2025년 1,256억 5,000만 달러로 평가되었고, 2030년 2,478억 1,000만 달러에 이를 것으로 예측되며, CAGR은 14.55%를 나타낼 전망입니다.

강력한 정책 지원과 증가하는 도시 인구는 정부가 추가 차선 포장 없이도 더 많은 수용력을 제공하는 데이터 중심 교통 시스템으로 나아가도록 이끌고 있습니다. 클라우드 네이티브 분석, 5G 기반 차량 연결성, 디지털 트윈 모델링이 융합되어 교통 체증을 줄이고 이동 시간을 단축하며 안전성을 향상시키고 있습니다. 공공 자본이 전개에 투입되고 있습니다. 2024년 10월, 미국은 44개 차세대 모빌리티 프로젝트에 42억 달러를 승인했습니다. 유럽은 500km 미만 무공해 이동을 장려하고 교통 수단 전반에 걸쳐 개방형 데이터를 의무화하는 '지속가능하고 스마트한 모빌리티 전략'을 통해 도입을 선도하고 있습니다. 아시아태평양 지역은 역사상 최대 규모의 도시화를 관리하기 위해 초거대 도시들이 지능형 고속도로와 MaaS 플랫폼을 도입하며 가장 빠르게 확장 중입니다.
세계의 스마트 교통 시장 동향 및 인사이트
급격한 도시 인구 증가로 인한 기존 도로망의 스트레스
인구의 도시 집중은 전례 없는 교통 밀도를 초래하고 있으며, 2030년까지 전 세계 인구의 60%가 도시 지역에 거주할 것으로 전망됩니다. 이미 많은 경제권에서 교통 정체는 GDP의 2-4%를 잠식하고 있어, 교통 당국은 비용이 많이 드는 도로 확장 대신 인공지능 기반 교통 최적화 시스템을 도입하고 있습니다. 베이징의 스마트 신호망은 2024년 평균 지연 시간을 23% 단축했으며, 뭄바이와 자카르타에서도 유사한 시스템 구축이 진행 중입니다. 디지털 트윈 기술은 계획자들이 가상 환경에서 차로 구성을 스트레스 테스트할 수 있게 하며, 차량 프로브 데이터와 결합된 적응형 신호 제어는 아시아 메가시티 내 통행 시간을 25% 단축시켰습니다. 따라서 도시들이 콘크리트 확장이 아닌 기술적 해결책을 우선시함에 따라 스마트 교통 시장은 도시 밀집도의 직접적인 혜택을 누리고 있습니다.
정부가 스마트시티에 자금을 지원하고 ITS 의무화
입법적 지원이 지능형 모빌리티를 위한 수십억 달러 규모의 프로젝트로 이어지고 있습니다. 미국 인프라 투자 및 일자리 법안은 대중교통 현대화를 위해 912억 달러를 배정했으며, ATTAIN 프로그램은 첨단 기술 시범 사업에 연간 6천만 달러를 할당합니다. 유럽연합의 병행 이니셔티브는 상호운용 가능한 데이터 공유와 탄소 중립 통로를 의무화하여 스마트 교통 시장 공급업체들의 수요 안정성을 보장합니다. 자금 조달 조항은 종종 농촌 지역 포함을 요구하여 1선 도시를 넘어선 잠재 수요를 확대하고, 저비용 센서 패키지와 클라우드 오케스트레이션 분야의 혁신을 촉진합니다.
도시 전체 ATMS 구축을 위한 높은 초기 자본 지출
첨단 교통 관리 백본 구축 비용은 교차로당 6,000-7,000달러에 달하며, 대도시의 경우 7천만 달러 이상의 자본 지출이 쉽게 발생합니다. 예산 주기와 조달 규정이 도입을 지연시키며, 특히 세원이 작은 지역에서 더욱 두드러집니다. 자본 지출을 연기하기 위한 공공-민간 협력과 사용량 기반 요금 모델이 등장하고 있으나, 재정적 마찰은 여전히 스마트 교통 시장이 직면한 가장 시급한 장애물입니다.
부문 분석
교통 관리는 2024년 스마트 교통 시장에서 32.30%의 점유율을 차지했으며, 도시들이 AI 협업을 통해 두 자릿수 교통 정체 감소를 목표로 함에 따라 전체 성장률을 상회할 것으로 전망됩니다. 플로리다 전역 시범 구간에서 실시간 적응형 신호 제어는 35%의 통행 시간 단축 효과를 보여주며, 교차로 분석, 사고 감지, 통로 최적화 솔루션 도입을 뒷받침하고 있습니다. 지방자치단체 구매자들은 기존 제어기에 포크리프트 업그레이드 없이 연결 가능한 모듈형 클라우드 대시보드를 선호하며, 이는 공급업체 접근성을 확대하는 설계 원칙입니다.
주차 관리 기술은 연평균 13.2% 성장률로 발전 중이며, 노변 주차 공간을 디지털 자산으로 전환하고 도심 교통량의 최대 30%를 차지하는 순회 교통량을 대폭 감소시킵니다. 대중교통은 승객들이 차량 소유에서 사용량 기반 구독 서비스로 전환함에 따라 성장하고 있습니다. 화물 운송 분야에서는 협력형 적응형 크루즈 컨트롤이 5-6%의 연료 절감과 평균 속도 향상을 보여주고 있어, 물류 ITS(지능형 교통 시스템) 도입의 비즈니스 사례를 창출하고 스마트 교통 시장을 더욱 활성화하고 있습니다.
2024년 첨단 교통 관리 시스템(ATMS)은 스마트 교통 시장의 32%를 차지하며 다중 모드 네트워크의 디지털 운영체제 역할을 수행했습니다. 기관들은 예측 분석, 작업 구역 자동화, 온실가스 대시보드를 지원하는 클라우드 네이티브 오케스트레이션으로 사일로화된 온프레미스 서버를 대체하고 있습니다. 캘리포니아주의 20개 레거시 시스템을 단일 상용 플랫폼(COTS)으로 통합하는 조달 사례는 이러한 통합 추세를 잘 보여줍니다.
협동 주행 시스템은 연평균 복합 성장률(CAGR) 17.2%를 기록하며 5G와 엣지 AI를 결합해 플래토닝(차량 편대 주행), 고급 위험 경고, 우선순위 긴급 경로 안내를 가능하게 합니다. 5G Automotive Association(5GAA)의 2025년 파리 비지상파 네트워크 시험은 하이브리드 위성-셀룰러 V2X를 검증하여 시골 고속도로의 커버리지를 확대했습니다(5gaa.org). 혼잡 통행료가 수익 흐름을 재편하고 모달 전환을 촉진함에 따라 첨단 교통 요금 시스템이 추진력을 얻고 있으며, 실시간 마이크로 통행료 징수를 위해 블록체인을 활용하는 경우가 많습니다.
지역 분석
유럽은 엄격한 배출 목표와 통합된 자금 조달 모델을 바탕으로 2024년 스마트 교통 시장 매출의 39.5%를 차지했습니다. 지속가능하고 스마트한 모빌리티 전략은 2030년까지 3천만 대의 무공해 차량 도입과 고속철도 교통량 두 배 증가를 요구합니다. 공공 데이터 공간 및 오픈소스 시뮬레이션 플랫폼에 대한 투자는 공급업체의 혁신을 가속화하는 동시에 도시들이 지역 전체의 성과를 벤치마킹하는 데 도움을 줍니다. 북유럽의 성숙한 통신 인프라와 혼잡 통행료의 조기 도입은 유럽 전역에서 적용 가능한 모델을 제공합니다.
북미는 2위를 차지합니다. SMART 보조금(연간 1억 달러) 및 대규모 보조금 회랑을 포함한 연방 프로그램은 파일럿 확장 및 농촌 지역 확대를 지원합니다. 실리콘밸리의 클라우드 및 반도체 클러스터는 풍부한 공급업체 생태계를 형성하여 스마트 교통 시장에 필수적인 라이다 모듈, 매핑 API, 미들웨어의 신속한 상용화를 가능케 합니다. FCC의 상용 모바일 주파수 대역을 활용한 위성 보충 커버리지 승인은 V2X 도달 범위를 인구 희소 지역까지 확장하여 긴급 서비스의 복원력을 강화합니다.
아시아태평양 지역은 연평균 13.6% 성장률로 가장 높은 성장세를 기록합니다. 중국 지방 정부는 국가 정책 이행 차원에서 도로변 C-V2X를 활성화하고 있으며, 인도는 전용 고속도로 및 항만 프로그램에 IoT 센서를 통합해 이동 시간 보장을 실현합니다. 아세안 메가시티들은 국가 신원 확인 체계와 연계된 비접촉식 티켓팅 시스템을 도입해 MaaS(Mobility-as-a-Service) 도입 주기를 단축하고 있습니다. 동시에 중동 국가들은 ‘비전 2030’ 기금을 자율주행 지하철 노선에 투입하며, 2030년까지 지역 ITS 투자액 70억 달러를 목표로 하고 있습니다. 이러한 노력들이 종합적으로 아시아태평양 지역을 스마트 교통 시장의 주요 성장 동력으로 확고히 자리매김하게 합니다.
기타 혜택 :
- 엑셀 형식 시장 예측(ME) 시트
- 3개월간의 애널리스트 지원
목차
제1장 서론
- 조사의 전제조건과 시장의 정의
- 조사 범위
제2장 조사 방법
제3장 주요 요약
제4장 시장 상황
- 시장 개요
- 시장 성장 촉진요인
- 기존 도로망에 부담을 주는 급속한 도시 인구 증가
- 정부의 스마트 시티 자금과 ITS 의무
- AI 기반 엣지 센서의 가격 하락
- MaaS 구독 플랫폼의 성장
- 블록체인 기반 소액 결제 시스템으로의 유료 도로 전환
- 고밀도 도시 협곡 지역에 항공 등급 GNSS 중복 시스템 도입
- 시장 성장 억제요인
- 도시 전체 ATMS 구축을 위한 높은 초기 자본 지출
- V2X의 벤더간 데이터 표준 부족
- 공공 기관의 사이버 보안 규정 준수 부담
- 대도시의 전용 5.9GHz 주파수 대역 부족
- 가치/공급망 분석
- 규제 상황
- 기술의 전망
- Porter's Five Forces 분석
- 공급기업의 협상력
- 구매자의 협상력
- 신규 참가업체의 위협
- 경쟁 기업간 경쟁 관계
- 대체품의 위협
- 거시 경제 동향의 영향
- 업계 밸류체인 분석
제5장 시장 규모와 성장 예측
- 용도별
- 교통 관리
- 도로의 안전과 보안
- 주차 관리
- 대중교통 ITS
- 자동차 텔레매틱스
- 화물 및 물류 ITS
- 제품 유형별
- 첨단 여행자 정보 시스템(ATIS)
- 첨단 운송 관리 시스템(ATMS)
- 첨단 교통 요금 시스템(ATPS)
- 첨단 대중교통시스템(APTS)
- 협조형 차량 시스템(C-ITS)
- 서비스별
- 전개 및 통합
- 클라우드 및 관리형 서비스
- 전문 및 컨설팅
- 교통 수단별
- 도로
- 철도
- 공로
- 해로
- 연결 기술별
- DSRC/C-V2X
- 5G와 LTE-M
- 위성(GNSS, L 밴드)
- 지역별
- 북미
- 미국
- 캐나다
- 멕시코
- 남미
- 브라질
- 아르헨티나
- 유럽
- 독일
- 영국
- 프랑스
- 러시아
- 기타 유럽
- 아시아태평양
- 중국
- 일본
- 인도
- 기타 아시아태평양
- 중동 및 아프리카
- 사우디아라비아
- 아랍에미리트(UAE)
- 남아프리카
- 기타 중동 및 아프리카
- 북미
제6장 경쟁 구도
- 시장 집중도
- 전략적 이니셔티브와 합병 및 인수
- 시장 점유율 분석
- 기업 프로파일
- Siemens Corporation
- Cisco Systems Inc.
- IBM Corporation
- SAP SE
- AVEVA Group PLC
- Thales Group
- Huawei Technologies Co. Ltd.
- Alstom SA
- Kapsch TrafficCom AG
- Hitachi Ltd.
- Oracle Corporation
- Advantech Co. Ltd.
- Orange SA
- TransCore LP
- Cubic Transportation Systems
- TomTom NV
- Panasonic Holdings Corp.
- Ericsson AB
- Qualcomm Inc.
- Continental AG
- Iteris Inc.
- PTV Group
제7장 시장 기회와 장래의 전망
HBR 25.11.14The smart transportation market size is valued at USD 125.65 billion in 2025 and is forecast to reach USD 247.81 billion by 2030, registering a 14.55% CAGR.
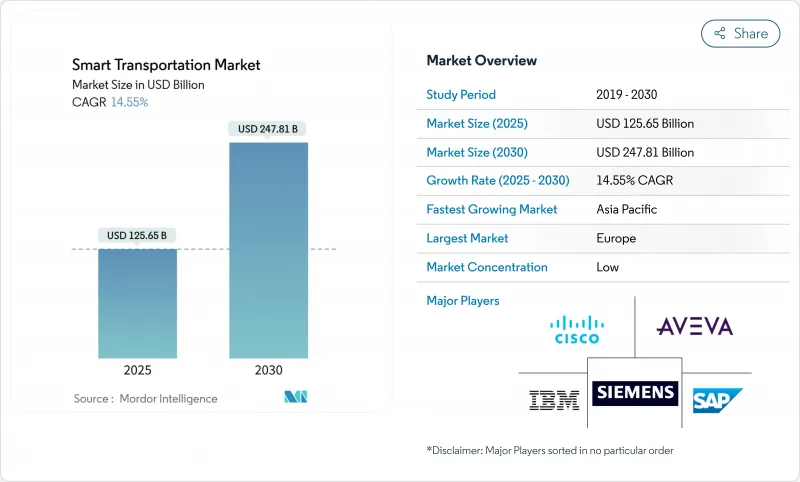
Strong policy backing and rising urban populations are steering governments toward data-centric traffic systems that deliver more capacity without paving additional lanes. Cloud-native analytics, 5G-enabled vehicle connectivity, and digital twin modeling are converging to cut congestion, shorten travel times, and improve safety. Public capital is flowing into deployment: in October 2024, the United States approved USD 4.2 billion for 44 next-generation mobility projects.Europe leads adoption through its Sustainable and Smart Mobility Strategy that promotes zero-emission travel under 500 km and mandates open data across modes of transport. Asia-Pacific is scaling fastest as megacities roll out intelligent highways and MaaS platforms to manage the largest wave of urbanisation in history.
Global Smart Transportation Market Trends and Insights
Rapid Urban-Population Growth Stressing Legacy Road Networks
The migration of people toward cities is creating unprecedented traffic density, with urban areas forecast to host 60% of the global population by 2030. Congestion already erodes 2-4% of GDP in many economies, spurring transport agencies to deploy AI-driven traffic optimisation instead of costly road widening. Beijing's smart signal network cut average delays by 23% in 2024, and similar deployments are underway in Mumbai and Jakarta. Digital twins allow planners to stress-test lane configurations virtually, while adaptive signal control paired with vehicle probe data has trimmed corridor travel times by 25% inside Asian megacities. The smart transportation market, therefore, benefits directly from urban density as cities prioritise technological fixes over concrete expansions.
Government Smart-City Funding & ITS Mandates
Legislative support is translating into multibillion-dollar pipelines for intelligent mobility. The U.S. Infrastructure Investment and Jobs Act allocates USD 91.2 billion for modernising public transit, and the ATTAIN program reserves USD 60 million annually for advanced technology pilots. Parallel initiatives in the European Union mandate interoperable data sharing and carbon-neutral corridors, anchoring demand certainty for vendors in the smart transportation market. Funding provisions often require rural inclusion, widening addressable demand beyond tier-one cities, and stimulating innovation in low-cost sensor packages and cloud orchestration.
High Upfront Capex for City-Wide ATMS Roll-Outs
Deploying an advanced traffic management backbone can cost USD 6,000-7,000 per intersection, and large cities easily exceed USD 70 million capital outlay. Budget cycles and procurement rules slow adoption, particularly where tax bases are small. Public-private partnerships and usage-based pricing models are emerging to defer capex, yet financial friction remains the most immediate headwind facing the smart transportation market.
Other drivers and restraints analyzed in the detailed report include:
- Drop-in Cost of AI-Enabled Edge Sensors
- Growth of MaaS Subscription Platforms
- Lack of Cross-Vendor Data Standards for V2X
For complete list of drivers and restraints, kindly check the Table Of Contents.
Segment Analysis
Traffic Management contributed 32.30% market share to the smart transportation market in 2024 and is projected to outpace overall growth as cities target double-digit congestion cuts with AI coordination. Real-time adaptive signal control shows 35% travel-time savings in pilot corridors across Florida, underpinning procurement for intersection analytics, incident detection, and corridor optimisation. Municipal buyers value modular cloud dashboards that plug into legacy controllers without forklift upgrades, a design principle widening vendor addressability.
Parking Management technologies are advancing at a 13.2% CAGR, converting curbside inventory into digital assets and slashing cruising traffic that can reach 30% of downtown volumes. Public Transport is growing as passengers shift from ownership toward usage-based subscriptions. In freight, cooperative adaptive cruise control demonstrates 5-6% fuel savings and higher average speeds, generating business cases for logistics ITS deployments and further boosting the smart transportation market.
Advanced Transportation Management Systems represented 32% of smart transportation market share in 2024, acting as the digital operating system for multi-modal networks. Agencies are replacing siloed, on-premise servers with cloud-native orchestration that supports predictive analytics, work-zone automation, and greenhouse-gas dashboards. California's procurement to unify 20 legacy systems under a single COTS platform exemplifies the consolidation trend.
Cooperative Vehicle Systems, posting a 17.2% CAGR, marries 5G and edge AI to enable platooning, advanced hazard alerts, and prioritised emergency routing. The 5G Automotive Association's 2025 non-terrestrial network trial in Paris validated hybrid satellite-cellular V2X, widening coverage for rural highways 5gaa.org. Advanced Transportation Pricing Systems are gaining momentum as congestion pricing reshapes revenue streams and nudges modal shift, often using blockchain for real-time micro-tolling.
The Smart Transportation Market is Segmented by Application (Traffic Management, Road Safety and Security, and More), Product Type (Advanced Traveler Information Systems (ATIS), and More), Service (Deployment and Integration, and More), Transportation Mode (Roadways, Railways, and More), Connectivity Technology (DSRC/C-V2X, 5G and LTE-M, and More), and by Geography. The Market Forecasts are Provided in Terms of Value (USD).
Geography Analysis
Europe captured 39.5% of 2024 revenue in the smart transportation market, underpinned by stringent emissions targets and cohesive funding models. The Sustainable and Smart Mobility Strategy calls for 30 million zero-emission vehicles and a doubling of high-speed rail traffic by 2030. Investment in public data spaces and open-source simulation platforms accelerates vendor innovation while helping cities benchmark performance region-wide. Northern Europe's mature telecom infrastructure and early adoption of congestion pricing provide templates replicable across the continent.
North America ranks second. Federal programmes, including SMART Grants (USD 100 million annually) and mega-grant corridors, finance pilot scaling and rural outreach. Silicon Valley's cloud and semiconductor clusters feed a rich supplier ecosystem, allowing rapid commercialization of LIDAR modules, mapping APIs, and middleware critical to the smart transportation market. The FCC's approval for supplemental satellite coverage using commercial mobile spectrum extends V2X reach into sparsely populated regions, reinforcing the resilience of emergency services.
Asia-Pacific posts the highest growth at 13.6% CAGR. Chinese provinces are activating roadside C-V2X to meet national mandates, while India's dedicated highway and port programmes integrate IoT sensors for journey-time guarantees. ASEAN megacities deploy contactless ticketing tied to national identity schemes, shortening adoption cycles for Mobility-as-a-Service. In parallel, Middle Eastern states channel Vision 2030 funds into autonomous metro lines, targeting USD 7 billion regional ITS spend by 2030. Collectively, these initiatives cement APAC as a principal volume engine for the smart transportation market.
- Siemens Corporation
- Cisco Systems Inc.
- IBM Corporation
- SAP SE
- AVEVA Group PLC
- Thales Group
- Huawei Technologies Co. Ltd.
- Alstom SA
- Kapsch TrafficCom AG
- Hitachi Ltd.
- Oracle Corporation
- Advantech Co. Ltd.
- Orange SA
- TransCore LP
- Cubic Transportation Systems
- TomTom NV
- Panasonic Holdings Corp.
- Ericsson AB
- Qualcomm Inc.
- Continental AG
- Iteris Inc.
- PTV Group
Additional Benefits:
- The market estimate (ME) sheet in Excel format
- 3 months of analyst support
TABLE OF CONTENTS
1 INTRODUCTION
- 1.1 Study Assumptions and Market Definition
- 1.2 Scope of the Study
2 RESEARCH METHODOLOGY
3 EXECUTIVE SUMMARY
4 MARKET LANDSCAPE
- 4.1 Market Overview
- 4.2 Market Drivers
- 4.2.1 Rapid urban?population growth stressing legacy road networks
- 4.2.2 Government smart-city funding and ITS mandates
- 4.2.3 Drop-in cost of AI-enabled edge sensors
- 4.2.4 Growth of MaaS subscription platforms
- 4.2.5 Transition of toll roads to blockchain-based micro-payment rails
- 4.2.6 Aviation-grade GNSS redundancy adopted for dense urban canyons
- 4.3 Market Restraints
- 4.3.1 High upfront capex for city-wide ATMS roll-outs
- 4.3.2 Lack of cross-vendor data standards for V2X
- 4.3.3 Cyber-security-compliance liabilities for public agencies
- 4.3.4 Scarcity of dedicated 5.9 GHz spectrum in megacities
- 4.4 Value / Supply-Chain Analysis
- 4.5 Regulatory Landscape
- 4.6 Technological Outlook
- 4.7 Porter's Five Forces Analysis
- 4.7.1 Bargaining Power of Suppliers
- 4.7.2 Bargaining Power of Buyers
- 4.7.3 Threat of New Entrants
- 4.7.4 Intensity of Competitive Rivalry
- 4.7.5 Threat of Substitute Products
- 4.8 Impact of Macroeconomic Trends
- 4.9 Industry Value-Chain Analysis
5 MARKET SIZE AND GROWTH FORECASTS (VALUE)
- 5.1 By Application
- 5.1.1 Traffic Management
- 5.1.2 Road Safety and Security
- 5.1.3 Parking Management
- 5.1.4 Public Transport ITS
- 5.1.5 Automotive Telematics
- 5.1.6 Freight and Logistics ITS
- 5.2 By Product Type
- 5.2.1 Advanced Traveler Information Systems (ATIS)
- 5.2.2 Advanced Transportation Management Systems (ATMS)
- 5.2.3 Advanced Transportation Pricing Systems (ATPS)
- 5.2.4 Advanced Public Transportation Systems (APTS)
- 5.2.5 Cooperative Vehicle Systems (C-ITS)
- 5.3 By Service
- 5.3.1 Deployment and Integration
- 5.3.2 Cloud and Managed Services
- 5.3.3 Professional and Consulting
- 5.4 By Transportation Mode
- 5.4.1 Roadways
- 5.4.2 Railways
- 5.4.3 Airways
- 5.4.4 Maritime
- 5.5 By Connectivity Technology
- 5.5.1 DSRC / C-V2X
- 5.5.2 5G and LTE-M
- 5.5.3 Satellite (GNSS, L-band)
- 5.6 By Geography
- 5.6.1 North America
- 5.6.1.1 United States
- 5.6.1.2 Canada
- 5.6.1.3 Mexico
- 5.6.2 South America
- 5.6.2.1 Brazil
- 5.6.2.2 Argentina
- 5.6.3 Europe
- 5.6.3.1 Germany
- 5.6.3.2 United Kingdom
- 5.6.3.3 France
- 5.6.3.4 Russia
- 5.6.3.5 Rest of Europe
- 5.6.4 APAC
- 5.6.4.1 China
- 5.6.4.2 Japan
- 5.6.4.3 India
- 5.6.4.4 Rest of APAC
- 5.6.5 Middle East and Africa
- 5.6.5.1 Saudi Arabia
- 5.6.5.2 United Arab Emirates
- 5.6.5.3 South Africa
- 5.6.5.4 Rest of Middle East and Africa
- 5.6.1 North America
6 COMPETITIVE LANDSCAPE
- 6.1 Market Concentration
- 6.2 Strategic Initiatives and Mergers and Acquisitions
- 6.3 Market Share Analysis
- 6.4 Company Profiles (includes global overview, market overview, core segments, financials, strategy, market rank/share, products and services, recent developments)
- 6.4.1 Siemens Corporation
- 6.4.2 Cisco Systems Inc.
- 6.4.3 IBM Corporation
- 6.4.4 SAP SE
- 6.4.5 AVEVA Group PLC
- 6.4.6 Thales Group
- 6.4.7 Huawei Technologies Co. Ltd.
- 6.4.8 Alstom SA
- 6.4.9 Kapsch TrafficCom AG
- 6.4.10 Hitachi Ltd.
- 6.4.11 Oracle Corporation
- 6.4.12 Advantech Co. Ltd.
- 6.4.13 Orange SA
- 6.4.14 TransCore LP
- 6.4.15 Cubic Transportation Systems
- 6.4.16 TomTom NV
- 6.4.17 Panasonic Holdings Corp.
- 6.4.18 Ericsson AB
- 6.4.19 Qualcomm Inc.
- 6.4.20 Continental AG
- 6.4.21 Iteris Inc.
- 6.4.22 PTV Group
7 MARKET OPPORTUNITIES AND FUTURE OUTLOOK
- 7.1 White-space and Unmet-Need Assessment