


|
시장보고서
상품코드
1686588
섬유 보강 콘크리트 시장 : 시장 점유율 분석, 산업 동향 및 통계, 성장 예측(2025-2030년)Fiber Reinforced Concrete - Market Share Analysis, Industry Trends & Statistics, Growth Forecasts (2025 - 2030) |
||||||
■ 보고서에 따라 최신 정보로 업데이트하여 보내드립니다. 배송일정은 문의해 주시기 바랍니다.
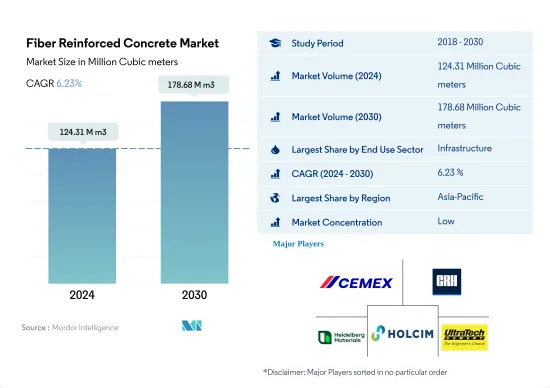
섬유 보강 콘크리트 시장 규모는 2024년에 1억 2,431만 입방미터로 평가되었고, 2030년에는 1억 7,868만 입방미터에 이를 전망이며, 예측 기간인 2024-2030년 CAGR 6.23%로 성장할 것으로 예측됩니다.

정부 투자와 PPP에 대한 새로운 관심에 힘입어 세계 인프라 및 주택 건설 분야가 섬유 보강 콘크리트 수요를 강화할 것으로 예측됩니다.
- 세계의 인플레이션 압력으로 에너지 비용 및 시멘트 등 원재료 가격이 상승했으며 2022년 세계 섬유 보강 콘크리트 시장의 수량은 2.03% 감소했습니다. 그러나 2023년에는 615만 입방미터의 성장이 평가되면서 시장은 회복 조짐을 보였습니다. 이 부활은 세계 각국의 정부가 인플레이션의 악영향에 맞서 건설 부문을 강화하기 위한 대책을 제안하고 있는 것에 기인하고 있습니다.
- 2022년에는 인프라 건설에서 세계의 철근 콘크리트 시장이 4,719만 입방미터로 압도적인 점유율을 차지했습니다. 이러한 우위성은, 인프라 강화를 향한 세계의 동향인 관민 제휴의 급증에 뒷받침된 것입니다. 이 시장은 2023년에 현저한 상승을 보였습니다. 지속 가능한 건설이 중시되고, 도로, 공항, 철도, 항만 강화 등 정부와 민간의 협력에 힘입은 커넥티비티 이니셔티브의 고조로 세계 인프라 지출은 2023년에는 2022년 대비 2조 7,000억 달러 급증한 것으로 평가되었습니다. 그 결과 시장 규모는 이 기간에 5.93% 성장한 것으로 평가됩니다.
- 시장의 주택 부문은 예측 기간 동안 CAGR 7.03%를 나타낼 것으로 예상됩니다. 이 성장을 지지하고 있는 것은 2030년까지 30억 명을 수용한다는 목표를 내걸어, 저렴한 주택 건설을 타겟으로 한 정부 투자입니다. 또한 저렴한 주택계획 및 가처분소득이 높고 구매력이 큰 인구의 급증으로 신축 주택 수요가 증가하여 주택 건설의 신규 바닥 면적은 2022년 대비 2030년에는 93억 평방피트 증가할 것으로 예상되어 섬유 보강 콘크리트 수요를 높이고 있습니다.
아시아태평양의 인프라 투자 증가는 섬유 보강 콘크리트 수요를 견인합니다.
- 2022년, 세계의 섬유 보강 콘크리트 수요는 약 2.03% 감소했습니다. 이러한 침체는 주로 주택이나 산업 및 시설의 신축 바닥 면적의 감소에 의한 것입니다. 2022년 세계 주택 신축 바닥 면적은 전년 대비 1.05% 감소했습니다. 그러나 시장은 회복되어 2023년 성장률은 2022년 대비 약 5.56%가 되었습니다.
- 2022년 점유율은 약 45.43%로 아시아태평양이 섬유 보강 콘크리트의 최대 소비국으로 부상했습니다. 이러한 급증은 인프라에 대한 왕성한 투자와 소매점 및 사무실 공간의 현저한 증가에 기인하고 있습니다. 예를 들어 인도네시아는 320억 달러라는 거액의 투자를 배경으로 2045년까지 수도를 자카르타에서 보르네오 섬으로 이전할 계획을 가지고 있습니다. 인도 상위 7개 도시의 A등급 오피스 시장은 2026년까지 10억 평방 피트라는 경이로운 규모로 확대될 예정입니다.
- 아시아태평양은 그 기세를 유지하는 자세로 섬유 보강 콘크리트의 가장 급성장하는 소비자로 부상하고 있습니다. 예측 기간 동안 CAGR은 6.86%로 견조한 성장이 예상됩니다. 이러한 급증은 특히 인프라 및 상업 건설에서 섬유 보강 콘크리트에 대한 이 지역 수요 증가로 인해 발생합니다. 예를 들어 아시아태평양의 인프라 지출은 2023년 1조 5,000억 달러에서 2030년에는 1조 7,400억 달러로 급증할 것으로 예측됩니다. 이로 인해 섬유 보강 콘크리트 수요가 크게 증가하고 2023년 대비 2030년까지 3,190만 입방미터 증가가 전망되고 있습니다.
세계의 섬유 보강 콘크리트 시장 동향
아시아태평양의 대규모 오피스 빌딩 건설 프로젝트의 급증으로 세계 상업 건축 전용 바닥 면적이 증가할 전망입니다.
- 2022년 세계 상업 건축용 신설 바닥 면적은 전년대비 0.15%의 소폭인 성장이 되었습니다. 유럽은 12.70%의 대폭적인 성장으로 두드러지고 있으며, 이는 2030년의 이산화탄소 배출 목표에 맞추어 에너지 효율이 높은 오피스 빌딩을 추진하는 움직임이 원동력이 되고 있습니다. 종업원의 사무실 복귀에 따라, 유럽 기업은 리스 계약을 재개해, 2022년에는 450만 평방 피트의 신규 사무실 건설에 박차를 가했습니다. 이 기세는 2023년에도 계속되어 세계 성장률은 4.26%로 평가되었습니다.
- COVID-19의 유행은 노동력과 자재 부족을 일으켜 상업 시설 건설 프로젝트의 취소와 지연을 초래했습니다. 그러나 봉쇄가 완화되고 건설 활동이 재개됨에 따라 2021년 세계 상업시설의 신설 바닥 면적은 11.11% 급증하고 아시아태평양이 20.98%의 성장률로 선도했습니다.
- 향후 세계 상업 시설의 신설 바닥 면적의 CAGR은 4.56%가 됩니다. 아시아태평양의 CAGR은 5.16%로 예측되며 다른 지역을 능가할 것으로 예상됩니다. 이 성장의 원동력이 되고 있는 것은 중국, 인도, 한국, 일본에서 상업 시설 건설 프로젝트의 활성화입니다. 특히 베이징, 상하이, 홍콩, 타이베이 등 중국의 주요 도시에서는 A등급의 사무실 공간 건설이 가속화되고 있습니다. 또한 인도에서는 2023-2025년 상위 7개 도시에서 약 2,325만 평방 피트에 이르는 약 60개의 쇼핑몰이 오픈할 예정입니다. 아시아태평양 전역의 이러한 노력을 합산하면 2030년까지 상업 시설의 신규 바닥 면적은 2022년 대비 15억 6,000만 평방피트 증가할 것으로 예상됩니다.
세계의 주택 부문을 뒷받침하는 저렴한 주택 계획에 대한 정부 투자 증가로 남미 주택 건설이 가장 빠르게 성장할 것으로 예상됩니다.
- 2022년 세계 주택건축의 신규 바닥 면적은 2021년 대비 약 2억 8,900만 평방피트 감소했습니다. 이는 토지 부족, 노동력 부족, 건축자재 가격의 지속 불가능한 급등으로 인한 주택 위기 때문입니다. 이 위기는 아시아태평양에 심각한 영향을 미쳤으며, 2022년 신설 바닥 면적은 2021년 대비 5.39% 감소했습니다. 그러나 2023년에는 2030년까지 30억 명을 수용할 수 있는 저렴한 주택을 새로 건설하기 위한 자금을 조달할 수 있는 정부 투자로 세계 신설 바닥 면적은 2022년 대비 3.31% 증가해 보다 밝은 전망이 기대됩니다.
- COVID-19의 유행은 경기 감속을 일으켜, 그 때문에 많은 주택 건설 프로젝트가 중지 또는 연기되어 2020년 세계의 신설 바닥 면적은 2019년에 비해 4.79% 감소했습니다. 2021년 규제가 풀리면서 주택 프로젝트에 대한 침체된 수요가 해방되자 신설 바닥 면적은 2020년 대비 11.22% 증가했으며, 유럽이 18.28%로 가장 높은 증가세를 보였고, 이어 남미가 2021년에 2020년 대비 17.36% 증가했습니다.
- 세계의 주택용 신설 바닥 면적은 예측 기간 동안 CAGR 3.81%로 성장을 지속하고, 남미가 가장 빠른 CAGR 4.05%로 발전할 것으로 예측됩니다. 2023년에 발표된 브라질의 Minha Casa Minha Vida와 같은 계획과 이니셔티브는 몇 가지 규제 변경과 함께 발표되었으며, 정부는 저소득 가구에 저렴한 주택을 제공하기 위해 19억 8,000만 달러의 투자를 계획하고 있으며, 마찬가지로 2023년에 발표된 칠레의 FOGAES와 같은 계획과 이니셔티브는 초기 투자액 5,000만 달러로 저렴한 주택을 위해 가족에게 주택담보대출을 제공하는 것을 목적으로 하고 있으며, 새로운 주택 건설을 촉진할 것으로 보입니다.
섬유 보강 콘크리트 산업 개요
섬유 보강 콘크리트 시장은 세분화되어 있으며 상위 5개 기업에서 15.94%를 차지하고 있습니다. 이 시장의 주요 기업은 CEMEX, S.A.B. de C.V., CRH, Heidelberg Materials, Holcim, UltraTech Cement Ltd 등이 있습니다.
기타 혜택
- 엑셀 형식 시장 예측(ME) 시트
- 애널리스트에 의한 3개월간 서포트
목차
제1장 주요 요약 및 주요 조사 결과
제2장 보고서 제안
제3장 서문
- 조사의 전제조건 및 시장 정의
- 조사 범위
- 조사 방법
제4장 주요 산업 동향
- 최종 용도 분야의 동향
- 상업
- 산업 및 시설
- 인프라
- 주택
- 주요 인프라 프로젝트(현재 및 발표됨)
- 규제 프레임워크
- 밸류체인 및 유통채널 분석
제5장 시장 세분화
- 최종 용도별
- 상업
- 산업 및 시설
- 인프라
- 주택
- 제품별
- 유리 섬유
- 천연 섬유
- 강 섬유
- 합성 섬유
- 기타
- 지역별
- 아시아태평양
- 국가별
- 호주
- 중국
- 인도
- 인도네시아
- 일본
- 말레이시아
- 한국
- 태국
- 베트남
- 기타 아시아태평양
- 유럽
- 국가별
- 프랑스
- 독일
- 이탈리아
- 러시아
- 스페인
- 영국
- 기타 유럽
- 중동 및 아프리카
- 국가별
- 사우디아라비아
- 아랍에미리트(UAE)
- 기타 중동 및 아프리카
- 북미
- 국가별
- 캐나다
- 멕시코
- 미국
- 남미
- 국가별
- 아르헨티나
- 브라질
- 기타 남미
- 아시아태평양
제6장 경쟁 구도
- 주요 전략 동향
- 시장 점유율 분석
- 기업 상황
- 기업 프로파일
- Argos Group
- CEMEX, SAB de CV
- CRH
- Heidelberg Materials
- Holcim
- Nuvoco Vistas Corp Ltd.
- OYAK Cement
- UltraTech Cement Ltd.
- Vicat
- Vulcan Materials Company
제7장 CEO에 대한 주요 전략적 질문
제8장 부록
- 세계 개요
- 개요
- Porter's Five Forces 분석 프레임워크(산업 매력도 분석)
- 세계의 밸류체인 분석
- 시장 역학(DROs)
- 정보원 및 참고문헌
- 도표 일람
- 주요 인사이트
- 데이터 팩
- 용어집
The Fiber Reinforced Concrete Market size is estimated at 124.31 million Cubic meters in 2024, and is expected to reach 178.68 million Cubic meters by 2030, growing at a CAGR of 6.23% during the forecast period (2024-2030).
Global infrastructure and residential construction sectors supported by government investments and renewed interest in PPPs are predicted to bolster the demand for fiber-reinforced concrete
- Global inflationary pressures, which have raised energy costs and prices of raw materials such as cement, led to a 2.03% volume decline in the global fiber-reinforced concrete market in 2022. However, in 2023, the market was poised for a rebound, with an anticipated growth of 6.15 million cubic meters. This resurgence can be attributed to governments across the world proposing measures to counter inflation's adverse effects and bolster the construction sector.
- In 2022, the global market for reinforced concrete in infrastructure construction claimed the lion's share at 47.19 million cubic meters. This dominance was fueled by a surge in private-public partnerships, a global trend aimed at bolstering infrastructure. The market was set to witness a notable uptick in 2023. With a rising emphasis on sustainable construction and heightened connectivity initiatives, such as road, airport, railway, and port enhancements, backed by government and private-public collaborations, global infrastructure spending was projected to surge by USD 2.7 trillion in 2023 compared to 2022. Consequently, the market is estimated to grow by 5.93% in volume during this period.
- The residential segment in the market studied is expected to register the fastest CAGR of 7.03% during the forecast period. This growth is underpinned by government investments targeting the construction of affordable homes, with a goal of accommodating 3 billion people by 2030. Also, affordable housing schemes and the rapidly growing population with higher disposable incomes and significant purchasing power will increase the demand for new housing units, and the new floor area for residential construction is expected to increase by 9.3 billion sq. ft in 2030 compared to 2022, raising the demand for fiber-reinforced concrete.
Rising investments in infrastructure in Asia-Pacific are likely to drive the demand for fiber-reinforced concrete
- In 2022, the global demand for fiber-reinforced concrete saw a decline of approximately 2.03%. This drop was primarily driven by reduced floor areas in residential and industrial and institutional new constructions. The global residential new floor area witnessed a 1.05% decrease in 2022 compared to the previous year. However, the market rebounded, with a growth rate of about 5.56% in 2023 over 2022.
- With a dominant share of about 45.43% in 2022, Asia-Pacific emerged as the largest consumer of fiber-reinforced concrete. This surge can be attributed to robust investments in infrastructure and a notable uptick in retail and office spaces. For instance, Indonesia has plans to shift its capital city from Jakarta to Borneo Island by 2045, backed by a hefty USD 32 billion investment. India's Grade A office market in its top seven cities is set to expand to a staggering 1 billion sq. f by 2026. With such developments, the fiber-reinforced concrete market in Asia-Pacific witnessed a substantial growth of about 59.13% by 2030 compared to 2023.
- Asia-Pacific is poised to maintain its momentum, emerging as the fastest-growing consumer of fiber-reinforced concrete. It is expected to register a robust CAGR of 6.86% during the forecast period. This surge can be attributed to the region's escalating demand for fiber-reinforced concrete, particularly in infrastructure and commercial construction. For instance, infrastructure spending in Asia-Pacific is projected to surge from USD 1.50 trillion in 2023 to USD 1.74 trillion by 2030. Thus, the demand for fiber-reinforced concrete is anticipated to witness a substantial uptick, amounting to an increase of 31.9 million cubic meters by 2030 compared to 2023.
Global Fiber Reinforced Concrete Market Trends
Asia-Pacific's surge in large-scale office building projects is set to elevate the global floor area dedicated to commercial construction
- In 2022, the global new floor area for commercial construction witnessed a modest growth of 0.15% from the previous year. Europe stood out with a significant surge of 12.70%, driven by a push for high-energy-efficient office buildings to align with its 2030 carbon emission targets. As employees returned to offices, European companies, resuming lease decisions, spurred the construction of 4.5 million square feet of new office space in 2022. This momentum is poised to persist in 2023, with a projected global growth rate of 4.26%.
- The COVID-19 pandemic caused labor and material shortages, leading to cancellations and delays in commercial construction projects. However, as lockdowns eased and construction activities resumed, the global new floor area for commercial construction surged by 11.11% in 2021, with Asia-Pacific taking the lead with a growth rate of 20.98%.
- Looking ahead, the global new floor area for commercial construction is set to achieve a CAGR of 4.56%. Asia-Pacific is anticipated to outpace other regions, with a projected CAGR of 5.16%. This growth is fueled by a flurry of commercial construction projects in China, India, South Korea, and Japan. Notably, major Chinese cities like Beijing, Shanghai, Hong Kong, and Taipei are gearing up for an uptick in Grade A office space construction. Additionally, India is set to witness the opening of approximately 60 shopping malls, spanning 23.25 million square feet, in its top seven cities between 2023 and 2025. Collectively, these endeavors across Asia-Pacific are expected to add a staggering 1.56 billion square feet to the new floor area for commercial construction by 2030, compared to 2022.
South America's estimated fastest growth in residential constructions due to increasing government investments in schemes for affordable housing to boost the global residential sector
- In 2022, the global new floor area for residential construction declined by around 289 million square feet compared to 2021. This can be attributed to the housing crisis generated due to the shortage of land, labor, and unsustainably high construction materials prices. This crisis severely impacted Asia-Pacific, where the new floor area declined 5.39% in 2022 compared to 2021. However, a more positive outlook is expected in 2023 as the global new floor area is predicted to grow by 3.31% compared to 2022, owing to government investments that can finance the construction of new affordable homes capable of accommodating 3 billion people by 2030.
- The COVID-19 pandemic caused an economic slowdown, due to which many residential construction projects got canceled or delayed, and the global new floor area declined by 4.79% in 2020 compared to 2019. As the restrictions were lifted in 2021 and pent-up demand for housing projects was released, new floor area grew 11.22% compared to 2020, with Europe having the highest growth of 18.28%, followed by South America, which rose 17.36% in 2021 compared to 2020.
- The global new floor area for residential construction is expected to register a CAGR of 3.81% during the forecast period, with South America predicted to develop at the fastest CAGR of 4.05%. Schemes and initiatives like the Minha Casa Minha Vida in Brazil announced in 2023 with a few regulatory changes, for which the government plans an investment of USD 1.98 billion to provide affordable housing units for low-income families, and the FOGAES in Chile also publicized in 2023, with an initial investment of USD 50 million, are aimed at providing mortgage loans to families for affordable housing and will encourage the construction of new residential units.
Fiber Reinforced Concrete Industry Overview
The Fiber Reinforced Concrete Market is fragmented, with the top five companies occupying 15.94%. The major players in this market are CEMEX, S.A.B. de C.V., CRH, Heidelberg Materials, Holcim and UltraTech Cement Ltd. (sorted alphabetically).
Additional Benefits:
- The market estimate (ME) sheet in Excel format
- 3 months of analyst support
TABLE OF CONTENTS
1 EXECUTIVE SUMMARY & KEY FINDINGS
2 REPORT OFFERS
3 INTRODUCTION
- 3.1 Study Assumptions & Market Definition
- 3.2 Scope of the Study
- 3.3 Research Methodology
4 KEY INDUSTRY TRENDS
- 4.1 End Use Sector Trends
- 4.1.1 Commercial
- 4.1.2 Industrial and Institutional
- 4.1.3 Infrastructure
- 4.1.4 Residential
- 4.2 Major Infrastructure Projects (current And Announced)
- 4.3 Regulatory Framework
- 4.4 Value Chain & Distribution Channel Analysis
5 MARKET SEGMENTATION (includes market size, forecasts up to 2030 and analysis of growth prospects.)
- 5.1 End Use Sector
- 5.1.1 Commercial
- 5.1.2 Industrial and Institutional
- 5.1.3 Infrastructure
- 5.1.4 Residential
- 5.2 Product
- 5.2.1 Glass Fiber
- 5.2.2 Natural Fiber
- 5.2.3 Steel Fiber
- 5.2.4 Synthetic Fiber
- 5.2.5 Other Types
- 5.3 Region
- 5.3.1 Asia-Pacific
- 5.3.1.1 By Country
- 5.3.1.1.1 Australia
- 5.3.1.1.2 China
- 5.3.1.1.3 India
- 5.3.1.1.4 Indonesia
- 5.3.1.1.5 Japan
- 5.3.1.1.6 Malaysia
- 5.3.1.1.7 South Korea
- 5.3.1.1.8 Thailand
- 5.3.1.1.9 Vietnam
- 5.3.1.1.10 Rest of Asia-Pacific
- 5.3.2 Europe
- 5.3.2.1 By Country
- 5.3.2.1.1 France
- 5.3.2.1.2 Germany
- 5.3.2.1.3 Italy
- 5.3.2.1.4 Russia
- 5.3.2.1.5 Spain
- 5.3.2.1.6 United Kingdom
- 5.3.2.1.7 Rest of Europe
- 5.3.3 Middle East and Africa
- 5.3.3.1 By Country
- 5.3.3.1.1 Saudi Arabia
- 5.3.3.1.2 United Arab Emirates
- 5.3.3.1.3 Rest of Middle East and Africa
- 5.3.4 North America
- 5.3.4.1 By Country
- 5.3.4.1.1 Canada
- 5.3.4.1.2 Mexico
- 5.3.4.1.3 United States
- 5.3.5 South America
- 5.3.5.1 By Country
- 5.3.5.1.1 Argentina
- 5.3.5.1.2 Brazil
- 5.3.5.1.3 Rest of South America
- 5.3.1 Asia-Pacific
6 COMPETITIVE LANDSCAPE
- 6.1 Key Strategic Moves
- 6.2 Market Share Analysis
- 6.3 Company Landscape
- 6.4 Company Profiles
- 6.4.1 Argos Group
- 6.4.2 CEMEX, S.A.B. de C.V.
- 6.4.3 CRH
- 6.4.4 Heidelberg Materials
- 6.4.5 Holcim
- 6.4.6 Nuvoco Vistas Corp Ltd.
- 6.4.7 OYAK Cement
- 6.4.8 UltraTech Cement Ltd.
- 6.4.9 Vicat
- 6.4.10 Vulcan Materials Company
7 KEY STRATEGIC QUESTIONS FOR CONCRETE, MORTARS AND CONSTRUCTION CHEMICALS CEOS
8 APPENDIX
- 8.1 Global Overview
- 8.1.1 Overview
- 8.1.2 Porter's Five Forces Framework (Industry Attractiveness Analysis)
- 8.1.3 Global Value Chain Analysis
- 8.1.4 Market Dynamics (DROs)
- 8.2 Sources & References
- 8.3 List of Tables & Figures
- 8.4 Primary Insights
- 8.5 Data Pack
- 8.6 Glossary of Terms


샘플 요청 목록