|
시장보고서
상품코드
1686626
바이오 비료 시장 : 시장 점유율 분석, 산업 동향 및 통계, 성장 예측(2025-2030년)Biofertilizer - Market Share Analysis, Industry Trends & Statistics, Growth Forecasts (2025 - 2030) |
||||||
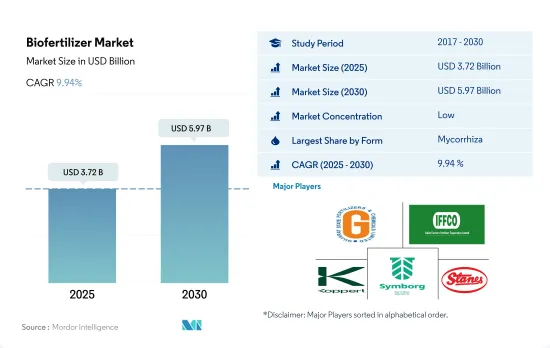
바이오 비료 시장 규모는 2025년에 37억 2,000만 달러로 추정되고, 2030년에는 59억 7,000만 달러에 이를 전망이며, 예측 기간(2025-2030년) 중 CAGR 9.94%를 나타낼 것으로 예측됩니다.

- 바이오 비료는 살아있는 미생물이며, 토양 중의 양분 이용 가능성을 동원 또는 증가시킴으로써 식물의 영양을 강화할 수 있습니다. 농업에서 바이오 비료로 사용되는 가장 흔한 미생물은 균근균, 아조스피릴람, 아조토박터, 리조비움, 인산가용화세균 등입니다.
- 이 중에서 균근균은 세계에서 가장 많이 소비되고 있는 바이오 비료입니다. 2022년에는 바이오비료 세그먼트의 36.7%를 차지했으며 시장가치는 미화 10억 4,000만 달러, 수량은 미화 17만 600톤이었습니다. 균근균은 식물 뿌리의 표면적을 늘리고 양분의 흡수를 촉진합니다.
- 근립균은 세계에서 두 번째로 많이 소비되고 있는 바이오 비료입니다. 2022년에는 바이오 비료 부문의 24.2%를 차지했습니다. 북미가 근립균 세분화를 독점하면서 같은 해 시장 점유율은 52.1%였습니다. 북미의 근립균 세분화에서는 경작 작물이 우세하여 2022년에는 62.4%를 차지했습니다. 근립균은 연작 작물의 카테고리인 콩과 작물과 공생 관계에 있습니다. 따라서 근립균 세분화에서는 연작 작물이 우위를 점하고 있습니다. 북미도 연작 작물의 재배 면적이 큽니다. 북미 연작 작물 시장의 근립균 세분화는 예측 기간 동안 10.5%의 CAGR로 추이할 것으로 예상되고 있습니다.
- 아조스피리람은 바이오 비료 부문의 16.3%를 차지합니다. 북미는 아조스피리람의 하위 부문을 지배하며 2022년에는 45.7%를 차지했습니다.
- 이와 같이 세계 농업 생물학적 제제 시장의 바이오 비료 부문은 작물의 수율과 토양의 건전성을 향상시키기 위해 지속 가능하고 환경 친화적인 솔루션을 요구하는 농가가 늘어남에 따라 향후 수년간 성장할 것으로 예상됩니다.
- 바이오 비료는 살아있는 미생물이며, 토양 중의 영양분을 동원 또는 증가시키는 것으로 식물의 영양을 강화하는 능력을 가지고 있습니다. 북미와 유럽은 세계 바이오 비료의 주요 소비국입니다.
- 북미는 2022년 세계 바이오 비료 시장의 34.5%를 차지했습니다. 이 지역의 유기농 작물 재배면적은 2017년 140만 헥타르에서 2021년 160만 헥타르로 지난 기간 동안 13.5% 증가했습니다. 이 지역의 유기농 식품 수요는 빠르게 증가하고 있으며, 2021년 북미의 유기농 식품에 대한 1인당 평균 지출액은 109.7달러입니다.
- 유럽은 2022년에 30.7%를 차지해 바이오 비료의 제2위의 소비자가 되었습니다. 유럽의 유기농업 면적은 세계 최대로, 2021년에는 650만 헥타르가 되었습니다. 유럽위원회는 2030년까지 회원국의 유기농 면적을 지역 농지 면적의 25.0%로 확대하는 행동 계획을 발표했습니다. 이것이 이 지역의 바이오 비료 시장을 더욱 견인할 것으로 예상됩니다.
- 아시아태평양은 쌀, 사탕수수, 과일, 야채 등의 유기농 작물의 주요 생산지입니다. 중국과 인도가 새로운 리더가 되고 있지만 유기농법이 농업 총 면적에서 차지하는 비중은 미미합니다. 이 지역의 유기농업 면적은 2017년부터 2021년까지 증가하고 있으며, 이 동향이 바이오 비료 시장의 성장을 촉진할 것으로 예상됩니다.
- 특히 유럽이나 북미와 같은 지역에서는 세계에서 유기농 작물 면적이 증가하고 유기품에 대한 수요가 증가하고 있기 때문에 예측 기간 동안 바이오 비료 수요를 촉진할 가능성이 있습니다.
세계의 바이오 비료 시장 동향
북미와 유럽에서는 의식이 높아지고 정부의 이니셔티브으로 유기농업 생산량이 사상 최고를 기록하고 있습니다.
- 유기농업은 지속가능한 식량 시스템에 크게 공헌하는 것으로 대두하고 있으며, 세계 187개국에서 실천되고 있습니다. 2021년 세계의 유기농 농지는 7,230만 ha로 2018-2021년 전 지역 평균 2.9% 증가했습니다. 유기경지는 1,440만 ha로 전체 유기농지의 19.9%를 차지했습니다.
- 유기농업의 최강시장은 북미와 유럽에서 세계의 유기경지의 41.0%를 차지했습니다. 2022년에는 유럽의 유기경지 면적은 650만 ha로 전체 유기경지 면적의 44.1%에 해당합니다. 북미와 유럽에서 유기농으로 재배되는 가장 중요한 작물은 사과, 딸기, 곡물, 올리브입니다.
- 아시아태평양의 신흥 국가도 유기농업운동에 참가해 국내 수요를 충족하는 신선한 유기농산물의 생산과 공급으로 자급자족하고 있습니다. 유기농업의 동향은 아시아 태평양에서 승승장구하고 있으며, 이 지역에서는 2017-2022년 유기경지 면적이 18.8% 증가했습니다. 이 지역 정부의 주요 대처도 유기농업의 확대 경향에 중요한 역할을 하고 있습니다. 예를 들면, 일본의 식량, 농업 및 농촌 기본계획은 2030년까지 유기 농가와 유기 농지의 수를 3배로 늘리는 것을 목표로 하고 있습니다.
- 유기농업의 성장의 원동력이 되고 있는 것은 토양의 건강을 촉진해, 환경에 대한 영향을 저감해, 보다 건강한 식품을 생산하는 등, 유기농업의 이점에 대한 의식 고조입니다.
유기농 식품의 1인당 지출은 주로 미국과 독일에서 관찰되지만, 이는 보다 건강하고 지속 가능한 식품에 대한 소비자 수요에 기인합니다.
- 유기농 식품 시장은 지난 몇 년간 현저한 성장을 이루었으며, 세계 매출은 2012년 708억 달러에서 2020년에는 1,206억 달러에 이르렀습니다. 유기농 식품에 대한 동향은 보다 건강하고 지속 가능한 식품의 선택지를 요구하는 소비자 수요의 고조나, 종래형 농업이 환경에 미치는 영향에 대한 의식의 고조 등, 몇가지 요인에 의해 뒷받침되고 있습니다. 세계 유기농 식품 시장은 앞으로 몇 년 동안 성장세가 계속될 것으로 예상됩니다.
- 오가닉 트레이드협회가 2021년에 실시한 조사에 따르면 같은 해 유기농 과일 및 채소 매출은 약 4.5% 증가하여 유기 매출 전체의 15%를 차지했습니다. 유기농 제품에 대한 평균 지출액으로는 북미가 시장을 독점했으며, 미국의 1인당 지출액은 2021년에 186.7달러에 달해 북미 국가 중 가장 높았습니다. 유럽도 유기농 식품 시장에서 큰 성장이 전망되고 있으며, 2021년 1인당 지출액이 가장 높은 곳은 독일로 75.6달러였습니다.
- 유기 식품 시장은 소비자의 가처분 소득이 높은 선진국이 여전히 지배적이지만, 신흥 국가에서도 성장이 예상됩니다. 예를 들어, 아시아태평양 지역에서는 노동자 계급이 증가하고 있으며, 유기농 식품을 구하기 쉽고 저렴한 가격으로 시장 확대에 기여할 가능성이 있습니다.
바이오 비료 산업 개요
바이오 비료 시장은 단편화되어 있으며 상위 5개사에서 21.14%를 차지하고 있습니다.이 시장 주요 기업은 다음과 같습니다. Gujarat State Fertilizers & Chemicals Ltd, Indian Farmers Fertiliser Cooperative Limited, Koppert Biological Systems Inc., Symborg Inc. and T.Stanes and Company Limited(알파벳순 정렬).
기타 혜택
- 엑셀 형식 시장 예측(ME) 시트
- 3개월의 애널리스트 서포트
목차
제1장 주요 요약 및 주요 조사 결과
제2장 보고서 제안
제3장 서문
- 조사 전제조건 및 시장 정의
- 조사 범위
- 조사 방법
제4장 주요 산업 동향
- 유기 재배 면적
- 1인당 유기농 제품에 대한 지출
- 규제 프레임워크
- 아르헨티나
- 호주
- 브라질
- 캐나다
- 중국
- 이집트
- 프랑스
- 독일
- 인도
- 인도네시아
- 이란
- 이탈리아
- 일본
- 멕시코
- 네덜란드
- 나이지리아
- 필리핀
- 러시아
- 남아프리카
- 스페인
- 태국
- 튀르키예
- 영국
- 미국
- 베트남
- 밸류체인 및 유통채널 분석
제5장 시장 세분화
- 형태별
- 아조스피리람
- 아조토박터
- 균근균
- 인산 가용균
- 근립균
- 기타 바이오 비료
- 작물 유형별
- 환금작물
- 원예작물
- 밭작물
- 지역별
- 아프리카
- 국가별
- 이집트
- 나이지리아
- 남아프리카
- 기타 아프리카
- 아시아태평양
- 국가별
- 호주
- 중국
- 인도
- 인도네시아
- 일본
- 필리핀
- 태국
- 베트남
- 기타 아시아태평양
- 유럽
- 국가별
- 프랑스
- 독일
- 이탈리아
- 네덜란드
- 러시아
- 스페인
- 튀르키예
- 영국
- 기타 유럽
- 중동
- 국가별
- 이란
- 사우디아라비아
- 기타 중동
- 북미
- 국가별
- 캐나다
- 멕시코
- 미국
- 기타 북미
- 남미
- 국가별
- 아르헨티나
- 브라질
- 기타 남미
- 아프리카
제6장 경쟁 구도
- 주요 전략 동향
- 시장 점유율 분석
- 기업 상황
- 기업 프로파일
- Andermatt Group AG
- Atlantica Agricola
- Binzhou Jingyang Biological Fertilizer Co. Ltd
- Biostadt India Limited
- Ficosterra
- Gujarat State Fertilizers & Chemicals Ltd
- Indian Farmers Fertiliser Cooperative Limited
- Indogulf BioAg LLC(Biotech Division of Indogulf Company)
- IPL Biologicals Limited
- Kiwa Bio-Tech
- Koppert Biological Systems Inc.
- Microbial Biological Fertilizers International
- Sustane Natural Fertilizer Inc.
- Symborg Inc.
- T.Stanes and Company Limited
제7장 CEO에 대한 주요 전략적 질문
제8장 부록
- 세계 개요
- 개요
- Porter's Five Forces 분석 프레임워크
- 세계의 밸류체인 분석
- 시장 역학(DROs)
- 정보원 및 참고문헌
- 도표 일람
- 주요 인사이트
- 데이터 팩
- 용어집
The Biofertilizer Market size is estimated at 3.72 billion USD in 2025, and is expected to reach 5.97 billion USD by 2030, growing at a CAGR of 9.94% during the forecast period (2025-2030).
- Biofertilizers are living microorganisms that can enhance plant nutrition by either mobilizing or increasing nutrient availability in soils. The most common microorganisms used as biofertilizers in agriculture include mycorrhiza, Azospirillum, Azotobacter, Rhizobium, and phosphate-solubilizing bacteria.
- Among these, mycorrhiza is the most consumed biofertilizer globally. It accounted for 36.7% of the biofertilizer segment in 2022, with a market value of USD 1.04 billion and a volume of 170.6 thousand metric tons. Mycorrhiza increases the root surface area of plants, thus enhancing their nutrient uptake.
- Rhizobium is the second most consumed biofertilizer globally. It accounted for 24.2% of the biofertilizer segment in 2022. North America dominated the rhizobium sub-segment with a market share of 52.1% in the same year. Row crops dominated the rhizobium sub-segment in North America, accounting for 62.4% in 2022. Rhizobium has a symbiotic association with leguminous crops, a category of row crops. Thus, row crops dominated the rhizobium sub-segment. North America also has a large cultivation area of row crops. The rhizobium sub-segment in the North American row crops market is anticipated to record a CAGR of 10.5% during the forecast period.
- Azospirillum accounted for 16.3% of the biofertilizer segment. North America dominated the Azospirillum sub-segment, accounting for 45.7% in 2022.
- Thus, the biofertilizer segment of the global agricultural biologicals market is expected to grow in the coming years as more farmers seek sustainable and eco-friendly solutions to improve crop yields and soil health.
- Biofertilizers are living microorganisms that have the ability to enhance plant nutrition by either mobilizing or increasing nutrient availability in soils. North America and Europe are the major consumers of biofertilizers in the world.
- North America accounted for 34.5% of the global biofertilizer market in 2022. The area under cultivation of organic crops in the region increased by 13.5% during the historical period, from 1.4 million hectares in 2017 to 1.6 million hectares in 2021. The demand for organic food in the region is growing rapidly, with an average per capita spending on organic food products in North America at USD 109.7 in 2021.
- The European region accounted for 30.7% in 2022 and stood as the second-largest consumer of biofertilizers. Europe had the largest area under organic farming in the world, with 6.5 million hectares in 2021. The European Commission has unveiled an action plan to increase the organic area in the member countries to occupy 25.0% of the region's agricultural land area by 2030. This factor is further expected to drive the market for biofertilizers in the region.
- The Asia-Pacific region is a leading producer of organic crops such as rice, sugarcane, and fruits and vegetables. China and India are emerging leaders, although organic farming only accounts for a small portion of their total agricultural area. The organic farming area in the region grew from 2017 to 2021, and this trend is expected to drive growth in the biofertilizer market.
- The increasing organic crop area and increasing demand for organic commodities across the world, particularly in regions like Europe and North America, may drive the demand for biofertilizers during the forecast period.
Global Biofertilizer Market Trends
Organic production is at an all-time high in North America and Europe, due to the increasing awareness and Government initiatives.
- Organic agriculture has emerged as a significant contributor to sustainable food systems, with 187 countries practicing it globally. As of 2021, there was 72.3 million ha of organic agricultural land worldwide, with an average increase of 2.9% across all regions from 2018 to 2021. Organic arable land accounted for 14.4 million ha, representing 19.9% of the total organic agricultural land.
- The strongest markets for organic farming are North America and Europe, accounting for 41.0% of the global organic arable land. In 2022, Europe had 6.5 million ha of organic arable land, equivalent to 44.1% of the overall organic arable agricultural area. The most significant crops grown organically in North America and Europe are apples, strawberries, cereals, and olives.
- Developing countries in Asia-Pacific are also joining the organic agriculture movement and becoming self-sufficient in producing and providing fresh organic produce to meet their domestic demand. The trend of organic farming is gaining momentum in Asia-Pacific, with the region recording an 18.8% increase in organic arable land from 2017 to 2022. The major initiatives by governments in the region also play a vital role in the growing trend of organic farming. For example, Japan's Basic Plan for Food, Agriculture, and Rural Areas aims to triple the number of organic farmers and lands by 2030.
- The growth of organic agriculture is driven by the rising awareness of the benefits of organic farming, such as promoting soil health, reducing environmental impacts, and producing healthier food.
Per capita spending of organic food majorly observed in United States and Germany, attributed to the consumer demand for healthier and sustainable food
- The organic food market experienced significant growth in the past few years, with global sales reaching USD 120.6 billion in 2020, up from USD 70.8 billion in 2012. The trend toward organic food is being driven by several factors, such as increasing consumer demand for healthier, more sustainable food options and a growing awareness of the environmental impact of conventional agriculture. The global organic food market is expected to continue its growth trend over the coming years.
- According to a survey conducted by the Organic Trade Association in 2021, sales of organic fruits and vegetables increased by around 4.5% in the same year, accounting for 15% of the overall organic sales. North America dominates the market in terms of average spending on organic products, with per capita spending in the United States reaching USD 186.7 in 2021, the highest among all North American countries. Europe is also expected to experience significant growth in the organic food market, with Germany accounting for the highest per capita spending of USD 75.6 in 2021.
- While the organic food market is still dominated by developed countries with high consumer disposable incomes, it is also expected to grow in developing nations. For example, the increasing number of working-class people in the Asia-Pacific region may contribute to the market's expansion due to the growing availability and affordability of organic food products.
Biofertilizer Industry Overview
The Biofertilizer Market is fragmented, with the top five companies occupying 21.14%. The major players in this market are Gujarat State Fertilizers & Chemicals Ltd, Indian Farmers Fertiliser Cooperative Limited, Koppert Biological Systems Inc., Symborg Inc. and T.Stanes and Company Limited (sorted alphabetically).
Additional Benefits:
- The market estimate (ME) sheet in Excel format
- 3 months of analyst support
TABLE OF CONTENTS
1 EXECUTIVE SUMMARY & KEY FINDINGS
2 REPORT OFFERS
3 INTRODUCTION
- 3.1 Study Assumptions & Market Definition
- 3.2 Scope of the Study
- 3.3 Research Methodology
4 KEY INDUSTRY TRENDS
- 4.1 Area Under Organic Cultivation
- 4.2 Per Capita Spending On Organic Products
- 4.3 Regulatory Framework
- 4.3.1 Argentina
- 4.3.2 Australia
- 4.3.3 Brazil
- 4.3.4 Canada
- 4.3.5 China
- 4.3.6 Egypt
- 4.3.7 France
- 4.3.8 Germany
- 4.3.9 India
- 4.3.10 Indonesia
- 4.3.11 Iran
- 4.3.12 Italy
- 4.3.13 Japan
- 4.3.14 Mexico
- 4.3.15 Netherlands
- 4.3.16 Nigeria
- 4.3.17 Philippines
- 4.3.18 Russia
- 4.3.19 South Africa
- 4.3.20 Spain
- 4.3.21 Thailand
- 4.3.22 Turkey
- 4.3.23 United Kingdom
- 4.3.24 United States
- 4.3.25 Vietnam
- 4.4 Value Chain & Distribution Channel Analysis
5 MARKET SEGMENTATION (includes market size in Value in USD and Volume, Forecasts up to 2030 and analysis of growth prospects)
- 5.1 Form
- 5.1.1 Azospirillum
- 5.1.2 Azotobacter
- 5.1.3 Mycorrhiza
- 5.1.4 Phosphate Solubilizing Bacteria
- 5.1.5 Rhizobium
- 5.1.6 Other Biofertilizers
- 5.2 Crop Type
- 5.2.1 Cash Crops
- 5.2.2 Horticultural Crops
- 5.2.3 Row Crops
- 5.3 Region
- 5.3.1 Africa
- 5.3.1.1 By Country
- 5.3.1.1.1 Egypt
- 5.3.1.1.2 Nigeria
- 5.3.1.1.3 South Africa
- 5.3.1.1.4 Rest of Africa
- 5.3.2 Asia-Pacific
- 5.3.2.1 By Country
- 5.3.2.1.1 Australia
- 5.3.2.1.2 China
- 5.3.2.1.3 India
- 5.3.2.1.4 Indonesia
- 5.3.2.1.5 Japan
- 5.3.2.1.6 Philippines
- 5.3.2.1.7 Thailand
- 5.3.2.1.8 Vietnam
- 5.3.2.1.9 Rest of Asia-Pacific
- 5.3.3 Europe
- 5.3.3.1 By Country
- 5.3.3.1.1 France
- 5.3.3.1.2 Germany
- 5.3.3.1.3 Italy
- 5.3.3.1.4 Netherlands
- 5.3.3.1.5 Russia
- 5.3.3.1.6 Spain
- 5.3.3.1.7 Turkey
- 5.3.3.1.8 United Kingdom
- 5.3.3.1.9 Rest of Europe
- 5.3.4 Middle East
- 5.3.4.1 By Country
- 5.3.4.1.1 Iran
- 5.3.4.1.2 Saudi Arabia
- 5.3.4.1.3 Rest of Middle East
- 5.3.5 North America
- 5.3.5.1 By Country
- 5.3.5.1.1 Canada
- 5.3.5.1.2 Mexico
- 5.3.5.1.3 United States
- 5.3.5.1.4 Rest of North America
- 5.3.6 South America
- 5.3.6.1 By Country
- 5.3.6.1.1 Argentina
- 5.3.6.1.2 Brazil
- 5.3.6.1.3 Rest of South America
- 5.3.1 Africa
6 COMPETITIVE LANDSCAPE
- 6.1 Key Strategic Moves
- 6.2 Market Share Analysis
- 6.3 Company Landscape
- 6.4 Company Profiles (includes Global Level Overview, Market Level Overview, Core Business Segments, Financials, Headcount, Key Information, Market Rank, Market Share, Products and Services, and Analysis of Recent Developments).
- 6.4.1 Andermatt Group AG
- 6.4.2 Atlantica Agricola
- 6.4.3 Binzhou Jingyang Biological Fertilizer Co. Ltd
- 6.4.4 Biostadt India Limited
- 6.4.5 Ficosterra
- 6.4.6 Gujarat State Fertilizers & Chemicals Ltd
- 6.4.7 Indian Farmers Fertiliser Cooperative Limited
- 6.4.8 Indogulf BioAg LLC (Biotech Division of Indogulf Company)
- 6.4.9 IPL Biologicals Limited
- 6.4.10 Kiwa Bio-Tech
- 6.4.11 Koppert Biological Systems Inc.
- 6.4.12 Microbial Biological Fertilizers International
- 6.4.13 Sustane Natural Fertilizer Inc.
- 6.4.14 Symborg Inc.
- 6.4.15 T.Stanes and Company Limited
7 KEY STRATEGIC QUESTIONS FOR AGRICULTURAL BIOLOGICALS CEOS
8 APPENDIX
- 8.1 Global Overview
- 8.1.1 Overview
- 8.1.2 Porter's Five Forces Framework
- 8.1.3 Global Value Chain Analysis
- 8.1.4 Market Dynamics (DROs)
- 8.2 Sources & References
- 8.3 List of Tables & Figures
- 8.4 Primary Insights
- 8.5 Data Pack
- 8.6 Glossary of Terms