


|
시장보고서
상품코드
1687075
천연섬유 강화 복합재료 시장 : 시장 점유율 분석, 산업 동향, 성장 예측(2025-2030년)Natural Fiber Reinforced Composites - Market Share Analysis, Industry Trends & Statistics, Growth Forecasts (2025 - 2030) |
||||||
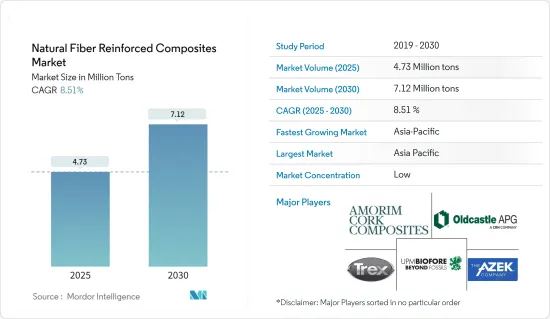
천연섬유 강화 복합재료 시장 규모는 2025년 473만 톤으로 추정되고, 예측 기간인 2025-2030년 CAGR 8.51%로 성장할 전망이며, 2030년에는 712만 톤에 달할 것으로 예측됩니다.

중기적으로는 바이오 복합재료 수요 증가와 세계 자동차 산업의 성장과 같은 요인이 2024-2029년 천연섬유 강화 복합재료 시장을 견인할 것으로 보입니다.
주요 하이라이트
- 그러나, 수분의 흡착, 가공 온도의 제한, 대부분의 폴리머 매트릭스와의 비상용성, 외부 환경에 노출되는 것에 의한 열화의 문제 등이 시장 성장 억제요인이 될 것 같습니다.
- 건축 및 건설 산업에서 인기의 고조는 시장에 새로운 기회를 가져올 것으로 예상됩니다.
- 아시아태평양이 시장을 독점해 2024-2029년 CAGR이 가장 높아질 것으로 예상됩니다.
천연섬유 강화 복합재료 시장 동향
건설산업이 시장을 독점할 전망
- 건축 재료 산업에서는 친환경 재료가 항상 요구되고 있습니다. 천연섬유 강화 폴리머를 베이스로 한 복합재료는 그 수많은 이점으로부터, 토목 건축 용도로 점점 사용되고 있습니다.
- 건축 및 건설산업에 있어서 복합재료는 매우 중요한 역할을 담당하고 있습니다. 산업용 지주, 탱크, 롱스팬 지붕 구조, 고층 빌딩, 경량 도어, 창문, 가구, 경량 빌딩, 교량 부품 및 교량 시스템 세트는 모두 복합 재료를 채택하고 있습니다. 복합 재료는 장기적인 지속 가능성을 달성하기 위해 건설 산업에서 점점 더 필수적이 되고 있습니다.
- 건설 부문에서는 최근 몇 년동안 대규모 투자가 이루어졌습니다. Oxford Economics에 따르면 세계 건설 산업은 2020-2030년 4 조 5,000억 달러(42%)로 성장할 전망이며, 15조 2,000억 달러에 이를 것으로 예상됩니다. 또, 중국, 인도, 미국, 인도네시아는, 2020-2030년 건설에서 세계 성장의 58.3%를 차지할 것으로 예상되고 있습니다.
- 게다가 건설 부문은 중국의 지속적인 경제 발전과 천연섬유 강화 복합재료 제품 수요에 크게 공헌하고 있습니다. 중국은 건설 메가 붐에 들끓고 있습니다. 게다가 주택, 도시 및 농촌 개발부의 예측에 따르면 중국의 건설 부문은 2025년까지 GDP의 6%를 유지할 것으로 예상되고 있습니다.
- 건설 부문은 중국의 지속적인 경제발전의 주역입니다. 중국 국가통계국에 따르면 건설 생산액은 2021년 29조 3,000억 위안(4조2,000억 달러)에서 2022년 31조 2,000억 위안(4조 5,000억 달러)으로 증가했습니다. 중국은 2030년까지 건축물에 13조 달러 가까이를 투자할 것으로 예상되고 있어 천연섬유 강화 복합재료에 밝은 전망이 되고 있습니다.
- 북미에서는 미국이 건설산업에서 큰 점유율을 차지하고 있습니다. 미국 외, 캐나다와 멕시코도 건설 부문에 투자에 크게 공헌하고 있습니다. 미국 인구조사국 데이터에 따르면 미국의 공공주택 건설 연간 금액은 2022년 91억 5,000만 달러로 평가되었으며, 2017년 67억 4,000만 달러와 비교해 35.7% 증가했습니다.
- 마찬가지로 유로통계에 따르면 2023년 건설업의 연간 평균 생산액은 2022년에 비해 유로권에서는 0.2% 증가, 유럽연합에서는 0.1% 증가했습니다. 건설업의 연간 생산량이 가장 많이 증가한 것은 루마니아(30.7% 증가), 폴란드(18.9% 증가), 벨기에(10.7% 증가)였습니다.
- 따라서, 전술한 동향은 2024-2029년 건설 분야에서 천연섬유 강화 복합재료의 성장에 영향을 미칠 것으로 예측됩니다.
아시아태평양이 시장을 독점할 전망
- 아시아태평양이 세계 시장을 독점할 것으로 예상됩니다. 중국, 인도, 일본 등의 나라에서 건설 활동이 활발해지고 있기 때문에, 이 지역에서는 천연섬유 강화 복합 재료의 사용량이 증가하고 있습니다.
- 주택, 도시 및 농촌개발성에 따르면 중국의 건설 부문은 2025년까지 GDP의 6%를 유지할 것으로 예상되고 있습니다. 이에 따라 중국 정부는 2022년 1월 건설 부문을 보다 지속 가능하고 품질 주도의 것으로 만들기 위한 5개년 계획을 발표했습니다.
- 마찬가지로, 천연섬유 강화 복합재료의 일렉트로닉스 산업에 대한 용도가 급증하고 있는 것도, 이 나라의 산업 성장을 지지할 것으로 보입니다. India Brand Equity Foundation(IBEF)에 따르면 인도의 전자기기 제조업은 2025년까지 5,200억 달러에 이를 것으로 예상됩니다.
- 또한 자동차는 천연섬유 강화 복합재료의 주요 소비자 중 하나입니다. 인도의 자동차 산업은 기술 진보와 거시 경제 확대의 양면에서 중요한 역할을 하고 있기 때문에 인도 경제의 실적을 나타내는 중요한 지표가 되고 있습니다.
- 또한 인도 정부는 2030년까지 전기자동차(EV) 보급률 30%를 목표로 하는 '(하이브리드 차와) 전기 자동차의 신속한 도입과 제조(Faster Adoption and Manufacturing of(Hybrid and) Electric Vehicles)' 계획을 통해서, 전기자동차(EV)의 도입을 장려해, 일부 부문에서는 의무화하는 것으로, 기세를 만들어 내고 있습니다. 이 계획은 EV에 대한 수요 인센티브를 창출하고 도시 중심부에 충전 기술과 스테이션 배치를 지원하는 것입니다. 정부는 2030년까지 인도에서 판매되는 상용차의 70%, 자가용의 30%, 버스의 40%, 이륜차와 삼륜차의 80%를 전기차로 만든다는 목표를 세우고 있습니다.
- 따라서 다양한 정부에 의한 새로운 시책과 투자가 2024-2029년 다른 아시아태평양의 천연섬유 강화 복합재료 시장 수요를 끌어올릴 것으로 예상됩니다.
천연섬유 강화 복합재료 산업 개요
천연섬유 강화 복합재료 시장은 세분화되어 있습니다. 주요 진출기업에는 Trex Company Inc., The AZEK Company Inc., Oldcastle APG Inc., UPM, Amorim Cork Composites SA 등이 있습니다.(순부동)
기타 혜택
- 엑셀 형식 시장 예측(ME) 시트
- 3개월간의 애널리스트 서포트
목차
제1장 서론
- 조사의 전제조건
- 조사 범위
제2장 조사 방법
제3장 주요 요약
제4장 시장 역학
- 성장 촉진요인
- 바이오 복합재료 수요 증가
- 세계 자동차 산업의 성장
- 억제요인
- 수분 흡착, 가공 온도 제한, 대부분의 폴리머 매트릭스와의 비상용성
- 외부 환경에 대한 노출에 의한 열화 문제
- 산업 밸류체인 분석
- Porter's Five Forces 분석
- 공급기업의 협상력
- 구매자의 협상력
- 신규 참가업체의 위협
- 대체품의 위협
- 경쟁도
제5장 시장 세분화
- 섬유별
- 목재 섬유 복합재료
- 비목재 섬유 복합재료
- 면
- 아마
- 케나프
- 대마
- 기타 비 목재 섬유 복합재료(황마, 사이잘 대마, 아바카, 코어, 파인애플, 바나나)
- 폴리머별
- 열경화성 수지
- 열가소성 플라스틱
- 폴리에틸렌
- 폴리프로필렌
- 폴리염화비닐
- 기타 열가소성 플라스틱(폴리카보네이트, 폴리아미드, 폴리부틸렌테레프탈레이트(PBT))
- 최종 사용자 산업별
- 항공우주
- 자동차
- 해양
- 건축 및 건설
- 전기 및 전자
- 스포츠
- 기타 최종 사용자 산업(전력 산업(풍력 터빈), 의료 등)
- 지역별
- 아시아태평양
- 중국
- 인도
- 일본
- 한국
- 말레이시아
- 태국
- 인도네시아
- 베트남
- 기타 아시아태평양
- 북미
- 미국
- 캐나다
- 멕시코
- 유럽
- 독일
- 영국
- 프랑스
- 이탈리아
- 스페인
- 북유럽 국가
- 튀르키예
- 러시아
- 기타 유럽
- 남미
- 브라질
- 아르헨티나
- 콜롬비아
- 기타 남미
- 중동 및 아프리카
- 사우디아라비아
- 카타르
- 아랍에미리트(UAE)
- 나이지리아
- 이집트
- 남아프리카
- 기타 중동 및 아프리카
- 아시아태평양
제6장 경쟁 구도
- M&A, 합작사업, 제휴 및 협정
- 시장 랭킹 분석
- 주요 기업의 전략
- 기업 프로파일
- Amorim Cork Composites SA
- Beologic
- BPREG Composites
- Fiberon
- FKuR
- Flexform Technologies
- Green Dot Bioplastics
- GreenGran BN
- JELU-WERK J. Ehrler GmbH & Co. KG
- Oldcastle APG
- TECNARO GmbH
- The AZEK Company Inc.
- Trex Company Inc.
- UFP Technologies Inc.
- UPM
- Wuhu Haoxuan Wood Plastic Composite Co. Ltd
제7장 시장 기회 및 향후 동향
- 건축 및 건설 산업에서 인기 고조
The Natural Fiber Reinforced Composites Market size is estimated at 4.73 million tons in 2025, and is expected to reach 7.12 million tons by 2030, at a CAGR of 8.51% during the forecast period (2025-2030).
In the medium term, factors such as the increasing demand for bio-based composites and the growth of the global automotive industry are likely to drive the natural fiber-reinforced composites market between 2024 and 2029.
Key Highlights
- However, moisture adsorption, restricted processing temperature, incompatibility with most polymer matrices, and degradation issues due to exposure to the external environment are likely to act as restraints for the market.
- Nevertheless, increasing popularity in the building and construction industry is expected to provide new opportunities for the market.
- Asia-Pacific is expected to dominate the market and is likely to witness the highest CAGR from 2024 to 2029.
Natural Fiber Reinforced Composites Market Trends
The Construction Industry is Expected to Dominate the Market
- There is always a continuous requirement for eco-friendly materials in the building materials industry. Natural fiber-reinforced polymer-based composites are increasingly used in civil engineering construction applications due to their numerous advantages.
- In the building and construction industry, composite materials are extremely significant. Industrial supports, tanks, long-span roof structures, high-rise buildings and lightweight doors, windows, furnishings, lightweight buildings, bridge components, and complete bridge systems have all employed composite materials. Composite materials are becoming increasingly essential in the construction industry to achieve long-term sustainability.
- The construction sector has witnessed major investments in recent years. According to Oxford Economics, the global construction industry is expected to grow by USD 4.5 trillion, or 42%, between 2020 and 2030 to reach USD 15.2 trillion. Also, China, India, the United States, and Indonesia are expected to account for 58.3% of global growth in construction between 2020 and 2030.
- Additionally, the construction sector is a key contributor to China's continued economic development and demand for natural fiber-reinforced composite products. China is amid a construction mega-boom. Moreover, as per the forecast given by the Ministry of Housing and Urban-Rural Development, the Chinese construction sector is expected to maintain a 6% share of the country's GDP going into 2025.
- The construction sector is a key player in China's continued economic development. According to the National Bureau of Statistics of China, the value of construction output accounted for CNY 31.2 trillion (USD 4.5 trillion) in 2022, up from CNY 29.3 trillion (USD 4.2 trillion) in 2021. China is expected to spend nearly USD 13 trillion on buildings by 2030, creating a positive outlook for natural fiber-reinforced composites.
- In North America, the United States has a major share in the construction industry. Besides the United States, Canada and Mexico contribute significantly to investments in the construction sector. According to the United States Census Bureau Data, the annual value of public residential construction in the United States was valued at USD 9.15 billion in 2022, an increase of 35.7% compared to USD 6.74 billion in 2017.
- Similarly, as per the Eurostat, the annual average production in construction for 2023, compared to 2022, increased by 0.2% in the euro area and by 0.1% in the European Union. The highest annual increases in construction production were recorded in Romania (+30.7%), Poland (+18.9%), and Belgium (+10.7%).
- Hence, the aforementioned trends are projected to influence the growth of natural fiber-reinforced composites in the construction sector between 2024 and 2029.
Asia-Pacific is Expected to Dominate the Market
- Asia-Pacific is expected to dominate the global market. With growing construction activities in countries such as China, India, and Japan, the usage of natural fiber-reinforced composites is increasing in the region.
- As per the Ministry of Housing and Urban-Rural Development, the Chinese construction sector is expected to maintain a 6% share of the country's GDP going into 2025. With the given forecasts, the Chinese government unveiled a five-year plan in January 2022 to make the construction sector more sustainable and quality-driven.
- Similarly, the surging application of natural fiber-reinforced composites in the electronics industry is likely to support the country's industry growth. According to the India Brand Equity Foundation (IBEF), the Indian electronics manufacturing industry is expected to reach USD 520 billion by 2025.
- Furthermore, automotive is among the major consumers of natural fiber-reinforced composites. The automotive industry in India is an important indicator of the Indian economic performance, as this sector plays a vital role in both technological advancements and macroeconomic expansion.
- Additionally, the Indian government has created momentum through its Faster Adoption and Manufacturing of (Hybrid and) Electric Vehicles schemes that encourage, and in some segments, mandate the adoption of electric vehicles (EV), intending to reach 30% EV penetration by 2030. The scheme creates demand incentives for EVs and supports the deployment of charging technologies and stations in urban centers. The government has set a target of 70% of all commercial cars, 30% of private cars, 40% of buses, and 80% of two-wheelers and three-wheelers sold in India by 2030 to be electric.
- Hence, the new policies and investments made by different governments are expected to boost the demand for the natural fiber-reinforced composites market in the rest of Asia-Pacific between 2024 and 2029.
Natural Fiber Reinforced Composites Industry Overview
The natural fiber reinforced composites market is fragmented in nature. Major players (not in any particular order) include Trex Company Inc., The AZEK Company Inc., Oldcastle APG Inc., UPM, and Amorim Cork Composites SA.
Additional Benefits:
- The market estimate (ME) sheet in Excel format
- 3 months of analyst support
TABLE OF CONTENTS
1 INTRODUCTION
- 1.1 Study Assumptions
- 1.2 Scope of the Study
2 RESEARCH METHODOLOGY
3 EXECUTIVE SUMMARY
4 MARKET DYNAMICS
- 4.1 Drivers
- 4.1.1 Increasing Demand for Bio-based Composites
- 4.1.2 Growth in the Automotive Industry Worldwide
- 4.2 Restraints
- 4.2.1 Moisture Adsorption, Restricted Processing Temperature, and Incompatibility with Most of the Polymer Matrices
- 4.2.2 Degradation Issue Due to Exposure to the External Environment
- 4.3 Industry Value Chain Analysis
- 4.4 Porter's Five Forces Analysis
- 4.4.1 Bargaining Power of Suppliers
- 4.4.2 Bargaining Power of Buyers
- 4.4.3 Threat of New Entrants
- 4.4.4 Threat of Substitute Products and Services
- 4.4.5 Degree of Competition
5 MARKET SEGMENTATION (Market Size in Volume)
- 5.1 Fiber
- 5.1.1 Wood Fiber Composites
- 5.1.2 Non-wood Fiber Composites
- 5.1.2.1 Cotton
- 5.1.2.2 Flax
- 5.1.2.3 Kenaf
- 5.1.2.4 Hemp
- 5.1.2.5 Other Non-wood Fiber Composites (Jute, Sisal, Abaca, Coir, Pineapple, and Banana)
- 5.2 Polymer
- 5.2.1 Thermosets
- 5.2.2 Thermoplastics
- 5.2.2.1 Polyethylene
- 5.2.2.2 Polypropylene
- 5.2.2.3 Poly Vinyl Chloride
- 5.2.2.4 Other Thermoplastics (Polycarbonate, Polyamide, and Polybutylene Terephthalate (PBT))
- 5.3 End-user Industry
- 5.3.1 Aerospace
- 5.3.2 Automotive
- 5.3.3 Marine
- 5.3.4 Building and Construction
- 5.3.5 Electrical and Electronics
- 5.3.6 Sports
- 5.3.7 Other End-user Industries (Power Industry (Wind Turbines), Medical, etc.)
- 5.4 Geography
- 5.4.1 Asia-Pacific
- 5.4.1.1 China
- 5.4.1.2 India
- 5.4.1.3 Japan
- 5.4.1.4 South Korea
- 5.4.1.5 Malaysia
- 5.4.1.6 Thailand
- 5.4.1.7 Indonesia
- 5.4.1.8 Vietnam
- 5.4.1.9 Rest of Asia-Pacific
- 5.4.2 North America
- 5.4.2.1 United States
- 5.4.2.2 Canada
- 5.4.2.3 Mexico
- 5.4.3 Europe
- 5.4.3.1 Germany
- 5.4.3.2 United Kingdom
- 5.4.3.3 France
- 5.4.3.4 Italy
- 5.4.3.5 Spain
- 5.4.3.6 Nordic Countries
- 5.4.3.7 Turkey
- 5.4.3.8 Russia
- 5.4.3.9 Rest of Europe
- 5.4.4 South America
- 5.4.4.1 Brazil
- 5.4.4.2 Argentina
- 5.4.4.3 Colombia
- 5.4.4.4 Rest of South America
- 5.4.5 Middle East and Africa
- 5.4.5.1 Saudi Arabia
- 5.4.5.2 Qatar
- 5.4.5.3 United Arab Emirates
- 5.4.5.4 Nigeria
- 5.4.5.5 Egypt
- 5.4.5.6 South Africa
- 5.4.5.7 Rest of Middle East and Africa
- 5.4.1 Asia-Pacific
6 COMPETITIVE LANDSCAPE
- 6.1 Mergers and Acquisitions, Joint Ventures, Collaborations, and Agreements
- 6.2 Market Ranking Analysis
- 6.3 Strategies Adopted by Leading Players
- 6.4 Company Profiles
- 6.4.1 Amorim Cork Composites SA
- 6.4.2 Beologic
- 6.4.3 BPREG Composites
- 6.4.4 Fiberon
- 6.4.5 FKuR
- 6.4.6 Flexform Technologies
- 6.4.7 Green Dot Bioplastics
- 6.4.8 GreenGran BN
- 6.4.9 JELU-WERK J. Ehrler GmbH & Co. KG
- 6.4.10 Oldcastle APG
- 6.4.11 TECNARO GmbH
- 6.4.12 The AZEK Company Inc.
- 6.4.13 Trex Company Inc.
- 6.4.14 UFP Technologies Inc.
- 6.4.15 UPM
- 6.4.16 Wuhu Haoxuan Wood Plastic Composite Co. Ltd
7 MARKET OPPORTUNITIES AND FUTURE TRENDS
- 7.1 Increasing Popularity in the Building and Construction Industry
