|
시장보고서
상품코드
1687088
유럽의 데이터센터 : 시장 점유율 분석, 산업 동향 및 통계, 성장 예측(2025-2030년)Europe Data Center - Market Share Analysis, Industry Trends & Statistics, Growth Forecasts (2025 - 2030) |
||||||
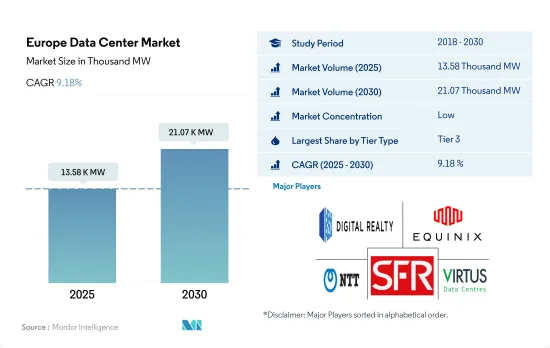
유럽의 데이터센터 시장 규모는 2025년에 1만 3,580kW로 추정되고, 2030년에는 2만 1,070kW에 이를 것으로 예측되며, CAGR 9.18%로 성장할 것으로 예측됩니다.
또한 2025년에는 181억 830만 달러의 코로케이션 수익이 예상되고, 2030년에는 350억 3,370만 달러에 이를 것으로 예측되며, 예측 기간(2025-2030년)의 CAGR은 14.11%를 나타낼 전망입니다.
티어 3 데이터 센터는 2023년 규모 면에서 과반수 점유율을 차지했으며, 예측 기간 내내 지배적일 것으로 예상
- 티어 3 부문은 그 특징의 주요 장점으로 인해 현재 유럽 지역에서 대다수의 점유율을 차지하고 있습니다. 이 계층은 높은 중복성 수준과 전력 및 냉각을 위한 여러 경로를 갖추고 있습니다. 이러한 데이터센터의 가동 시간은 약 99.982%로, 연간 다운타임이 1.6시간에 불과합니다. 엣지 및 클라우드 연결의 채택이 증가함에 따라 이 부문의 성장이 촉진될 것으로 예상됩니다.
- 영국은 영국에서 가장 많은 티어 3 데이터 센터를 보유하고 있으며, 슬라우와 그레이터 런던이 가장 큰 비중을 차지하고 있습니다. 다른 주요 위치는 프랑스, 독일, 아일랜드 및 기타 국가입니다. 더블린은 아일랜드에서 티어 3 데이터센터 시설의 98% 이상을 보유한 유일한 지역으로, 북더블린과 남더블린이 주요 점유율을 차지하고 있습니다.
- 티어 4 부문은 예측 기간 동안 15.51%의 가장 높은 CAGR을 기록할 것으로 예상됩니다. 예를 들어, 전통적인 FLAP 시장을 벗어난 티어 2 대도시 시장은 낮은 초기 출발점에서 가장 빠른 용량 증가를 보일 것으로 예상됩니다.
- 티어 1 및 2 부문은 오늘날 전체 트래픽의 70% 이상이 서버 간에 이동하기 때문에 가장 낮은 성장률을 보일 것으로 예상됩니다.
FLAP-D의 메트로 시장(프랑크푸르트, 런던/슬로우, 암스테르담, 파리, 더블린 등)의 디지털화 도입으로 시장 수요 증가
- 가장 큰 데이터센터 시장은 프랑크푸르트, 런던/슬로우, 암스테르담, 파리, 더블린 등 FLAP-D 메트로 시장에 해당합니다. 2022년 8월, 그레이터 런던 당국은 더 나은 전력 관리 규정을 통해 웨스트 런던의 전력 위기를 해결하고 완화하기 위해 데이터센터 개발 신청 절차를 변경할 계획을 발표했습니다.
- 런던의 토지 가격은 평방 피트당 약 150달러입니다. 예를 들어, 암스테르담은 FLAP-D 데이터 센터 시장에서 시설 건설을 위한 토지 가격이 평방 피트당 38달러로 더 낮습니다.
- 재생 에너지 측면에서 FLAP-D 시장에서 재생 에너지는 주로 태양열, 풍력, 수력, 해양 및 파력 에너지, 바이오 에너지에서 생산됩니다.
- FLAP-D 데이터 센터 허브는 토지 가용성과 숙련된 인력이 부족하여 신흥 지역으로부터 위협을 받고 있습니다. 이탈리아, 폴란드, 벨기에, 스웨덴과 같은 국가는 향후 성장세를 보일 것으로 예상됩니다. 스웨덴의 데이터센터 시장은 해저 케이블 연결과 관련하여 북유럽 지역에서 가장 잘 연결된 곳 중 하나입니다.
유럽의 데이터센터 시장 동향
소셜 미디어 보급률과 함께 OTT 구독 및 모바일 게임 사용 증가로 데이터센터 시장 확대
- 2025년까지 유럽에서는 스마트폰이 전체 연결의 약 85%를 차지할 것으로 예상됩니다. 스마트폰과 모바일 게임의 OTT 구독 증가로 인해 평균 데이터량이 증가함에 따라 라이브 스트리밍 게임과 비디오 콘텐츠를 위한 데이터 처리 및 저장 시설에 대한 수요가 더욱 증가하고 있습니다.
- 유럽 국가에서 OTT 서비스의 지속적인 증가 추세로 인해 스마트폰 당 데이터 트래픽이 증가하고 있습니다. 스위스의 소셜 미디어 사용자 수는 2021-2022년에 걸쳐 44만명 증가해, 6.2%의 성장을 나타내고 있습니다.
- 코로나19 팬데믹 이후 2021년에는 이 지역의 원격 근무 문화로 인해 스마트폰으로 전환하는 사용자가 늘어나면서 데이터 소비량이 크게 증가했습니다. 인터넷 교환 사업자인 DE-CIX를 통해 교환되는 데이터는 2020년 32엑사바이트에서 2021년 38엑사바이트 이상으로 데이터 처리량이 증가했다고 보고했습니다.
현금 없는 거래와 함께 유럽 사용자의 App Store 및 Google Play 지출 증가로 데이터센터 수요 증가
- 2021년에 모바일 기술과 서비스는 유럽 GDP의 약 4.6%를 창출했으며, 이는 7,450억 유로 이상의 경제적 가치에 기여했습니다. 유럽에서 스마트폰의 평균 수명은 3년이며, 연간 판매량은 약 2억 1,100만 대에 달합니다.
- 2021년 유럽에서는 4억 7,400만 명의 개인이 모바일 서비스에 가입했습니다. 2025년에는 이 숫자가 4억 8,000만 명으로 증가할 것으로 예상됩니다. 지역 사업자의 3분의 2 이상이 5G 네트워크를 구축했으며 대부분의 유럽 국가가 상용 5G 서비스를 구현했습니다. 2021년 한 해 동안 유럽 사용자들은 App Store 및 Google Play에서 183억 달러를 지출했습니다. 인앱 구매, 구독, 프리미엄 앱에 대한 고객 지출을 기준으로 한 이 예측치는 2020년 대비 연간 총 수입이 22.8% 증가한 수치입니다.
- 스위스의 인터넷 보급률은 2016년 89%에서 2021년 96%로 증가했으며, 동시에 스마트폰 사용자 수는 2016년 690만 명에서 2021년 790만 명으로 증가했습니다. 스위스에서 더 많은 사람들이 현금 없는 거래를 사용하고 있습니다. 스위스 국민의 35%만이 여전히 현금을 결제 수단으로 선호하고 있으며, 이는 사람들이 점점 더 현금 없는 거래를 선택하고 있고 나머지는 카드나 앱으로 결제하는 것을 선호하고 있음을 나타냅니다.
유럽의 데이터센터 산업 개요
유럽 데이터 센터 시장은 세분화되어 있으며 상위 5개 기업이 28.90%를 점유하고 있습니다. 이 시장의 주요 기업은 Digital Realty Trust Inc., Equinix Inc.입니다.
기타 혜택
- 엑셀 형식 시장 예측(ME) 시트
- 3개월간의 애널리스트 지원
목차
제1장 주요 요약과 주요 조사 결과
제2장 보고서 제안
제3장 소개
- 조사의 전제조건과 시장 정의
- 조사 범위
- 조사 방법
제4장 시장 전망
- IT 부하 용량
- 바닥 공간 증가
- 코로케이션 수입
- 설치된 랙 수
- 랙 공간 활용률
- 해저 케이블
제5장 주요 산업 동향
- 스마트폰 사용자수
- 스마트폰 1대당 데이터 트래픽
- 모바일 데이터 속도
- 광대역 데이터 속도
- 광섬유 접속 네트워크
- 규제 프레임워크
- 오스트리아
- 벨기에
- 덴마크
- 프랑스
- 독일
- 아일랜드
- 이탈리아
- 네덜란드
- 노르웨이
- 폴란드
- 러시아
- 스페인
- 스웨덴
- 스위스
- 영국
- 밸류체인과 유통채널 분석
제6장 시장 세분화
- 데이터센터의 규모
- 대규모
- 초대규모
- 중규모
- 메가 규모
- 소규모
- 티어 유형
- 티어 1 및 2
- 티어 3
- 티어 4
- 흡수
- 비이용
- 이용
- 코로케이션 유형별
- 하이퍼스케일
- 소매
- 도매
- 최종 사용자별
- BFSI
- 클라우드
- 전자상거래
- 정부
- 제조
- 미디어 및 엔터테인먼트
- 통신
- 기타
- 국가명
- 프랑스
- 독일
- 아일랜드
- 네덜란드
- 노르웨이
- 스페인
- 스위스
- 영국
- 기타 유럽
제7장 경쟁 구도
- 시장 점유율 분석
- 기업 상황
- 기업 프로파일
- CyrusOne Inc.
- Data4
- Digital Realty Trust Inc.
- Equinix Inc.
- Global Switch Holdings Limited
- Leaseweb Global BV
- NTT Ltd
- SOCIETE FRANCAISE DU RADIOTELEPHONE-SFR
- Stack Infrastructure Inc.
- Telehouse(KDDI Corporation)
- Vantage Data Centers LLC
- Virtus Data Centres Properties Ltd(STT GDC)
제8장 CEO에 대한 주요 전략적 질문
제9장 부록
- 세계 개요
- 개요
- Five Forces 분석 프레임워크
- 세계의 밸류체인 분석
- 세계 시장 규모와 DRO
- 출처 및 참고문헌
- 도표 목록
- 주요 인사이트
- 데이터 팩
- 용어집
The Europe Data Center Market size is estimated at 13.58 thousand MW in 2025, and is expected to reach 21.07 thousand MW by 2030, growing at a CAGR of 9.18%. Further, the market is expected to generate colocation revenue of USD 18,108.3 Million in 2025 and is projected to reach USD 35,033.7 Million by 2030, growing at a CAGR of 14.11% during the forecast period (2025-2030).

Tier 3 data center accounted for majority share in terms of volume in 2023, and is expected to dominate through out the forecasted period
- The tier 3 segment currently has a majority of share in the European region due to the major advantage of its features. These tiers have a high redundancy level and multiple paths for power and cooling. These data centers have an uptime of around 99.982%, translating into a downtime of 1.6 hours per year. The increasing adoption of edge and cloud connectivity is expected to boost the segment's growth.
- The United Kingdom hosts the maximum number of tier 3 data centers in the country, with Slough and Greater London holding a major share. The other major locations are France, Germany, Ireland, and other countries. Dublin is the only region that hosts more than 98% of the tier 3 data center facilities in Ireland, with North and South Dublin holding a major share. The tier 3 segment is expected to grow from 7,979.69 MW in 2023 to 12,110.18 MW in 2029, with a CAGR of 7.20%.
- The tier 4 segment is expected to record the highest CAGR of 15.51% during the forecast period. Various developed countries are focusing on adopting Tier 4 certifications to get the advantage of complete fault tolerance and redundancy for every component. Thus, even the developing regions are adopting the tier 4 zone. For instance, the tier 2 metro markets, outside the traditional FLAP markets, are set to see the fastest capacity growth from a low initial starting point. In particular, the Barcelona, Milan, and Rome metro markets are expected to triple the amount of data center power over the next four years.
- Tier 1 & 2 types showcase the least majority growth as more than 70% of all traffic today moves from server to server. Modern applications require significantly more data to travel within a data center at faster speeds and are more particular about latency.
Adoption of digitization in FLAP-D metro markets (including Frankfurt, London/Slough, Amsterdam, Paris, and Dublin) increases the market demand
- The largest data center markets are covered by FLAP-D metro markets (including Frankfurt, London/Slough, Amsterdam, Paris, and Dublin). With the increasing adoption of digital services and power management, these countries are expanding their colocation facilities. In August 2022, the Greater London Authority announced plans to change the application process for data center development to tackle and ease the West London power crisis with better electricity management regulations.
- The land price in London is around USD 150 per sq. ft. The higher land cost in London is expected to shift investments to other cities in the industry with lower land prices. For instance, Amsterdam has a lower land price for building facilities in the FLAP-D data center market, which is USD 38 per sq. ft. The Spanish market has many third-party DC projects under construction, with facilities being developed in Madrid and Barcelona.
- In terms of renewable energy, in the FLAP-D market, renewable energy is majorly produced from solar, wind, hydroelectricity, marine and wave energy, and bioenergy. For instance, in April 2022, the French government announced a strategy for renewable energy innovation projects as per its 2030 national investment plan, with an investment of over USD 1 billion.
- As the FLAP-D data center hubs observe a lack of land availability and skilled workforce, they are under threat from emerging regions. Countries like Italy, Poland, Belgium, and Sweden are expected to showcase growth in the future. Sweden's data center market is one of the most connected locations in the Nordic region regarding subsea cable connectivity. The country has adopted the district heating concept for data centers.
Europe Data Center Market Trends
Increasing usage of OTT subscriptions and mobile gaming along with social media penetration increases the data center market
- By 2025, smartphones are expected to account for nearly 85% of connections in Europe. Western Europe is home to some of the world's biggest consumers of mobile data, while Central and Eastern Europe lag behind the global average. In 2021, in Western European, the traffic from mobile devices reached 4,189,615 terabytes per month. The growing average data volume due to rising OTT subscriptions for smartphones and mobile gaming is further driving the demand for data processing and storage facilities for live-streaming games and video content. The Danish market saw an 11.8% growth in total consumer spending on video in 2021 compared to 2020. The Danish video market represented a value of more than DKK 4,591 million (EUR 607.8 million) in 2021.
- The ongoing trend of OTT services is increasing data traffic per smartphone in European countries. For instance, in Denmark, OTT subscriptions reached 2.1 million in 2016 to 5.7 million in 2021. The number of social media users in Switzerland was 7.54 million, increasing by 440,000 between 2021 and 2022, indicating a 6.2% growth. Factors such as increased data consumption, time spent on smartphones, and growth of digitalization across all end users are leading to the rise in data traffic per smartphone.
- A major increase in data consumption was observed in 2021 after the COVID-19 pandemic, with more users switching to smartphones due to the remote working culture in the region. The data exchanged through the internet exchange operator, DE-CIX, reported an increase in data throughput from 32 exabytes in 2020 to more than 38 exabytes in 2021. Such statistics suggest the significant growth of data traffic per smartphone in the region.
Increasing spending by European users on the App Store and Google Play along with cashless transactions increases the Data Center demand
- In 2021, mobile technologies and services generated around 4.6% of the GDP in Europe, a contribution that amounted to more than EUR 745 billion of the economic value. The average lifespan of a smartphone in Europe is three years, with annual sales of almost 211 million units.
- In Europe, 474 million individuals were subscribers to mobile services in 2021. By 2025, this number is projected to increase to 480 million. Over two-thirds of regional operators have built 5G networks, and most European nations have implemented commercial 5G services. There may be 311 million 5G connections in Europe by 2025, representing a 44% adoption rate. The year 2021 witnessed USD 18.3 billion in spending by European users on the App Store and Google Play. Based on customer spending for in-app purchases, subscriptions, and premium apps, this prediction represented a 22.8% rise in yearly gross income from 2020. European spending accounted for approximately 14% of global mobile app revenue in 2021, which reached USD 131.6 billion.
- The internet penetration in Switzerland increased from 89% in 2016 to 96% in 2021, while at the same time, the number of smartphone users increased from 6.9 million in 2016 to 7.9 million in 2021. Owing to such extensive use, digital payment services were promoted, and their application increased due to the COVID-19 pandemic. More people in Switzerland are using cashless transactions. Only 35% of Swiss citizens still prefer cash as a form of payment, indicating that people are increasingly choosing cashless transactions, while the rest favor using a card or an app to pay. Such factors indicate the rising use of smartphones in the European market, resulting in a constant increase in data and necessitating a growing amount of storage space.
Europe Data Center Industry Overview
The Europe Data Center Market is fragmented, with the top five companies occupying 28.90%. The major players in this market are Digital Realty Trust Inc., Equinix Inc., NTT Ltd, SOCIETE FRANCAISE DU RADIOTELEPHONE - SFR and Virtus Data Centres Properties Ltd (STT GDC) (sorted alphabetically).
Additional Benefits:
- The market estimate (ME) sheet in Excel format
- 3 months of analyst support
TABLE OF CONTENTS
1 EXECUTIVE SUMMARY & KEY FINDINGS
2 REPORT OFFERS
3 INTRODUCTION
- 3.1 Study Assumptions & Market Definition
- 3.2 Scope of the Study
- 3.3 Research Methodology
4 MARKET OUTLOOK
- 4.1 It Load Capacity
- 4.2 Raised Floor Space
- 4.3 Colocation Revenue
- 4.4 Installed Racks
- 4.5 Rack Space Utilization
- 4.6 Submarine Cable
5 Key Industry Trends
- 5.1 Smartphone Users
- 5.2 Data Traffic Per Smartphone
- 5.3 Mobile Data Speed
- 5.4 Broadband Data Speed
- 5.5 Fiber Connectivity Network
- 5.6 Regulatory Framework
- 5.6.1 Austria
- 5.6.2 Belgium
- 5.6.3 Denmark
- 5.6.4 France
- 5.6.5 Germany
- 5.6.6 Ireland
- 5.6.7 Italy
- 5.6.8 Netherlands
- 5.6.9 Norway
- 5.6.10 Poland
- 5.6.11 Russia
- 5.6.12 Spain
- 5.6.13 Sweden
- 5.6.14 Switzerland
- 5.6.15 United Kingdom
- 5.7 Value Chain & Distribution Channel Analysis
6 MARKET SEGMENTATION (INCLUDES MARKET SIZE IN VOLUME, FORECASTS UP TO 2030 AND ANALYSIS OF GROWTH PROSPECTS)
- 6.1 Data Center Size
- 6.1.1 Large
- 6.1.2 Massive
- 6.1.3 Medium
- 6.1.4 Mega
- 6.1.5 Small
- 6.2 Tier Type
- 6.2.1 Tier 1 and 2
- 6.2.2 Tier 3
- 6.2.3 Tier 4
- 6.3 Absorption
- 6.3.1 Non-Utilized
- 6.3.2 Utilized
- 6.3.2.1 By Colocation Type
- 6.3.2.1.1 Hyperscale
- 6.3.2.1.2 Retail
- 6.3.2.1.3 Wholesale
- 6.3.2.2 By End User
- 6.3.2.2.1 BFSI
- 6.3.2.2.2 Cloud
- 6.3.2.2.3 E-Commerce
- 6.3.2.2.4 Government
- 6.3.2.2.5 Manufacturing
- 6.3.2.2.6 Media & Entertainment
- 6.3.2.2.7 Telecom
- 6.3.2.2.8 Other End User
- 6.4 Country
- 6.4.1 France
- 6.4.2 Germany
- 6.4.3 Ireland
- 6.4.4 Netherlands
- 6.4.5 Norway
- 6.4.6 Spain
- 6.4.7 Switzerland
- 6.4.8 United Kingdom
- 6.4.9 Rest of Europe
7 COMPETITIVE LANDSCAPE
- 7.1 Market Share Analysis
- 7.2 Company Landscape
- 7.3 Company Profiles (includes Global Level Overview, Market Level Overview, Core Business Segments, Financials, Headcount, Key Information, Market Rank, Market Share, Products and Services, and Analysis of Recent Developments).
- 7.3.1 CyrusOne Inc.
- 7.3.2 Data4
- 7.3.3 Digital Realty Trust Inc.
- 7.3.4 Equinix Inc.
- 7.3.5 Global Switch Holdings Limited
- 7.3.6 Leaseweb Global BV
- 7.3.7 NTT Ltd
- 7.3.8 SOCIETE FRANCAISE DU RADIOTELEPHONE - SFR
- 7.3.9 Stack Infrastructure Inc.
- 7.3.10 Telehouse (KDDI Corporation)
- 7.3.11 Vantage Data Centers LLC
- 7.3.12 Virtus Data Centres Properties Ltd (STT GDC)
- 7.4 LIST OF COMPANIES STUDIED
8 KEY STRATEGIC QUESTIONS FOR DATA CENTER CEOS
9 APPENDIX
- 9.1 Global Overview
- 9.1.1 Overview
- 9.1.2 Porter's Five Forces Framework
- 9.1.3 Global Value Chain Analysis
- 9.1.4 Global Market Size and DROs
- 9.2 Sources & References
- 9.3 List of Tables & Figures
- 9.4 Primary Insights
- 9.5 Data Pack
- 9.6 Glossary of Terms