


|
시장보고서
상품코드
1687123
유럽의 생물촉진제 시장 : 시장 점유율 분석, 산업 동향 및 통계, 성장 예측(2025-2030년)Europe Biostimulants - Market Share Analysis, Industry Trends & Statistics, Growth Forecasts (2025 - 2030) |
||||||
■ 보고서에 따라 최신 정보로 업데이트하여 보내드립니다. 배송일정은 문의해 주시기 바랍니다.
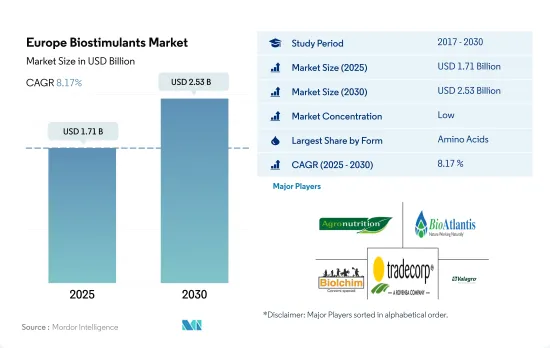
유럽의 생물촉진제 시장 규모는 2025년 17억 1,000만 달러로 추정되고, 2030년 25억 3,000만 달러에 이를 것으로 예측되며, 예측 기간인 2025-2030년 CAGR 8.17%로 성장할 것으로 예측됩니다.
- 생물촉진제는 식물의 성장과 개발을 개선하는 데 사용되는 물질과 미생물을 의미합니다. 유럽에서는 생물촉진제 시장이 2023-2030년 53.3%로 추정되는 큰 성장을 이룰 것으로 예측되고 있습니다. 휴민산, 풀보산, 아미노산, 단백질 가수분해물, 해초 추출물 및 기타 식물 및 동물 유래의 생물촉진제는 유럽에서 가장 일반적으로 사용되는 생물촉진제입니다.
- 아미노산은 유럽의 생물자극제 시장에서 가장 큰 시장 점유율을 차지하며, 2022년에는 56.7%를 차지했습니다. 이것은 식물의 건강과 스트레스 내성을 강화하는 능력과 식물을 중금속으로부터 보호하고 미량 영양소의 이동성과 흡수에 기여하는 킬레이트 효과에 기인합니다.
- 생물촉진제의 엽면살포는 쿠티클라와 표피세포를 통한 중엽세포에 의한 흡수에 의해 효과를 발휘합니다. 토양에서 공급되면 뿌리 표피 세포에서 흡수되어 목부를 통해 재분배됩니다.
- 연작 작물용 생물촉진제 시장이 압도적이며, 2022년에는 78.1%의 점유율을 차지하였고, 2023-2029년 62.0%의 성장이 전망됩니다. 이는 연작작물 재배 면적이 크고 2022년에는 이 지역 유기농 총 재배면적의 82.3%를 차지했기 때문입니다.
- 생물학적 및 생물학적 스트레스에 대한 작물의 내성을 강화하고, 영양흡수를 개선하며, 유기와 비유기농장 모두에서 적용된다는 생물촉진제의 이점에 대한 농업 종사자 의식의 고조가 2023-2029년 사이에 시장을 견인할 것으로 예상됩니다.
- 유럽의 생물촉진제 시장은 프랑스가 지배적이었고, 2022년 시장 점유율은 18.0%였습니다. 프랑스의 농업 종사자는 집약적인 화학 투입의 대체로서 생물촉진제를 채용하고 있어 농업에서의 화학품 사용을 삭감한다고 하는 공공 시책의 목적에 합치하고 있습니다.
- 이탈리아는 2위 시장 규모이며, 가장 빠르게 성장하고 있습니다. 2023-2029년 CAGR 7.0%로 성장이 예측되고 있습니다. 이탈리아에서는 유기농업의 도입률이 높고 농지의 15.0%가 유기농업에 사용되고 있는 것이 시장성장에 기여하고 있습니다. 독일은 시장점유율 12.4%로 제3위 시장이며, 규제기관에 의한 명확한 규제 형성이 시장을 더욱 강화할 가능성이 있습니다.
- 규제기관에 의한 명확한 규제의 형성은 이 나라에서의 생물촉진제 시장의 추가 강화에 도움이 될 수 있습니다. 2020년 5월 유럽위원회의 Farms to Fork 전략은 오가닉은 유럽 그린딜의 식품 야욕을 달성하기 위한 주요 분야라고 말했습니다. 이 전략은 또 유기식품 시장은 앞으로도 계속될 것이며 따라서 유기농업을 더욱 추진할 필요가 있다고 보고 있습니다. EU는 유기농업을 장려하고 생태계의 안전성을 높이기 위해 엄격한 기준을 수립하고 있으며, 바이오스티뮬란트 시장 확대에 기여하고 있습니다.
- 화학적으로 생산된 농약이나 비료가 인간의 건강에 미치는 악영향에 대한 사람들의 의식이 높아짐에 따라, 생물촉진제는 보다 널리 채용되게 되어 있습니다. 또, 생물촉진제는 독성이 없고 토양을 오염시키지 않기 때문에, 유럽에서의 채용이 확대되고 있습니다.
유럽의 생물촉진제 시장 동향
유럽의 녹색 거래는 이 지역 전체에서 유기농 재배 증가에 크게 기여하고 있습니다.
- 유럽 국가에서는 유기농업의 추진이 진행되고 있으며, 유기농업의 토지 면적은 지난 10년간 크게 증가했습니다. 2021년 3월 유럽위원회는 2030년까지 농지의 25%를 유기농으로 만든다는 유럽 그린딜 목표를 달성하기 위한 유기 행동 계획을 발표했습니다. 오스트리아, 이탈리아, 스페인, 독일은 유럽의 주요 국가 중 하나입니다. 2022년 현재 이탈리아는 농업 면적의 15.0%를 유기농법으로 재배하고 있으며, 이는 EU 평균(7.5%)보다 높습니다.
- 2021년에는 유럽연합(EU)의 유기농지가 1,470만ha가 되었습니다. 농업 생산 면적은, 경지 작물(주로 곡물, 근채류, 신선 야채), 영속적인 초지, 영속적인 작물(과수 및 베리류, 올리브밭, 포도밭)의 3개의 주요 이용 타입으로 나눌 수 있습니다. 2021년 유기경지 면적은 650만ha로 EU 전체 유기농지 면적의 46%였습니다.
- EU의 곡류, 지방종자, 단백질 작물, 콩류의 유기 재배 면적은 2017-2021년 32.6% 증가하여 160만 ha 이상에 달했습니다. 다년생 작물의 생산면적은 130만 ha로 2020년에는 유기농 재배지의 15%를 차지했습니다. 올리브, 포도, 아몬드, 감귤류는 이 그룹에 속하는 작물의 몇 가지 예입니다. 2022년 스페인, 이탈리아, 그리스가 유기농 올리브의 주요 생산국으로 각각 19만 7,000ha, 17만 9,000ha, 4만 7,000ha를 생산하고 있습니다. 올리브도 포도도 국내외에서 수요가 있는 특산품으로 가공할 수 있기 때문에 유럽의 농업에 있어서 매우 중요합니다. 이 지역의 유기농 면적 증가 동향은 유럽의 유기농 분야를 더욱 강화할 것으로 예상됩니다.
이 지역의 유기 제품에 대한 수요 증가 및 1인당 지출 증가
- 유럽의 소비자는 천연 재료와 제법으로 만들어진 상품을 더 많이 구입하고 있습니다. 유기농 식품이 EU의 농업 생산에서 차지하는 비중은 아주 미미하게 더 이상 틈새 부문이 아닙니다. 유럽연합(EU)은 유기농 상품 단일 시장으로는 국제적으로 두 번째로 크고, 1인당 연간 평균 지출액은 74.8달러입니다. 유럽의 1인당 유기농 식품에 대한 지출은 지난 10년간 두 배로 증가했습니다. 2020년에는 스위스와 덴마크의 소비자가 유기농 식품에 가장 많이 지출했습니다(각각 1인당 494.09달러와 453.90달러).
- 독일은 유럽 최대의 유기농 식품 시장으로 미국에 이어 세계 2위 시장 규모를 자랑하며, 2021년 시장 규모는 63억 달러, 1인당 소비액은 75.6달러였습니다. 이 나라는 세계 유기농 식품 수요의 10.0%를 차지하고 2021-2026년 2.7%의 CAGR로 추이할 것으로 추정되고 있습니다.
- 프랑스의 유기농 식품 시장은 강력한 성장을 보였으며, 2021년 소매 매출은 12.6% 증가했습니다. Global Organic Trade에 따르면, 이 나라의 1인당 유기농 식품에 대한 지출은 2021년에 88.8달러였습니다. 2018년 Agence BIO/Spirit Insight Barometer가 기록한 바와 같이 프랑스인의 88%가 유기농 제품을 소비하고 있습니다. 건강, 환경, 동물 복지의 보호가 프랑스에서 유기농 식품을 소비하는 주요 이유입니다. 유기농 시장은 스페인, 네덜란드, 스웨덴을 포함한 다른 몇몇 국가에서도 유기농 스토어의 개점과 함께 성장하기 시작하고 있습니다. 유기농 식품 매출이 늘어난 것은 코로나19 대유행 이후 소비자들이 건강 문제에 관심을 갖고 기존 방식으로 재배된 식품의 악영향을 알게 되면서부터였습니다.
유럽의 생물촉진제 산업 개요
유럽의 생물촉진제 시장은 세분화되어 있으며 상위 5개 기업에서 5.76%를 차지하고 있습니다. 이 시장의 주요 기업은 Agronutrition, BioAtlantis Ltd, Biolchim SPA, Trade Corporation International, Valagro 등입니다.
기타 혜택
- 엑셀 형식 시장 예측(ME) 시트
- 3개월의 애널리스트 서포트
목차
제1장 주요 요약 및 주요 조사 결과
제2장 보고서 제안
제3장 서문
- 조사의 전제조건 및 시장 정의
- 조사 범위
- 조사 방법
제4장 주요 산업 동향
- 유기 재배 면적
- 1인당 유기농 제품에 대한 지출
- 규제 프레임워크
- 프랑스
- 독일
- 이탈리아
- 네덜란드
- 러시아
- 스페인
- 튀르키예
- 영국
- 밸류체인 및 유통채널 분석
제5장 시장 세분화
- 형태별
- 아미노산
- 풀보산
- 후민산
- 단백질 가수분해물
- 해초 추출물
- 기타 생물촉진제
- 작물 유형별
- 환금작물
- 원예작물
- 밭작물
- 국가별
- 프랑스
- 독일
- 이탈리아
- 네덜란드
- 러시아
- 스페인
- 튀르키예
- 영국
- 기타 유럽
제6장 경쟁 구도
- 주요 전략 동향
- 시장 점유율 분석
- 기업 상황
- 기업 프로파일
- AGLUKON Spezialduenger GmbH & Co.
- Agronutrition
- Atlantica Agricola
- BioAtlantis Ltd
- Biolchim SPA
- Bionema
- Ficosterra
- Green Has Italia SpA
- Trade Corporation International
- Valagro
제7장 CEO에 대한 주요 전략적 질문
제8장 부록
- 세계 개요
- 개요
- Porter's Five Forces 분석 프레임워크
- 세계의 밸류체인 분석
- 시장 역학(DROs)
- 정보원 및 참고문헌
- 도표 일람
- 주요 인사이트
- 데이터 팩
- 용어집
The Europe Biostimulants Market size is estimated at 1.71 billion USD in 2025, and is expected to reach 2.53 billion USD by 2030, growing at a CAGR of 8.17% during the forecast period (2025-2030).
- Biostimulants refer to substances and microorganisms utilized to improve plant growth and development. In Europe, the biostimulant market is projected to experience significant growth, estimated at 53.3%, between 2023 and 2029 Humic acid, fulvic acid, amino acids, protein hydrolysates, seaweed extracts, and other biostimulants, such as plant and animal derivatives, are Europe's most commonly used biostimulants.
- Amino acids hold the largest market share in the European biostimulant market, accounting for 56.7% in 2022. This is attributed to their ability to enhance plant health and tolerance to stress and their chelating effects that protect plants from heavy metals and contribute to micronutrient mobility and acquisition.
- Foliar application of biostimulants is effective through absorption by mesophyll cells via the cuticle and epidermal cells. When supplied via soil, absorption occurs through root epidermal cells and is redistributed via the xylem.
- The biostimulant market for row crops is dominant, holding a share of 78.1% in 2022, and is expected to grow by 62.0% between 2023-2029. This is due to the significant area under cultivation for row crops, occupying 82.3% of the total organic crop area in the region in 2022.
- The growing awareness of the benefits of biostimulants among farmers in enhancing crop resistance to biotic and abiotic stress, improving nutrient absorption, and their application in both organic and non-organic farms are expected to drive the market between 2023-2029.
- The biostimulants market in Europe is dominated by France, which held an 18.0% market share in 2022. French farmers are adopting biostimulants as an alternative to intensive chemical inputs, aligning with public policy objectives to reduce chemical use in agriculture.
- Italy is the second-largest and the fastest-growing market. It is projected to have a 7.0% CAGR between 2023 and 2029. Italy's high adoption of organic farming, with 15.0% of agricultural land under organic farming, is contributing to the market growth. Germany is the third-largest market, with a 12.4% market share, and the formation of clear regulations by regulatory bodies may further strengthen the market.
- The formation of clear regulations by the regulatory bodies may further help in strengthening the biostimulants market in the country. In May 2020, the European Commission's Farms to Fork Strategy stated that organic is a key sector to achieve the European Green Deal's food ambitions. The strategy also stated that the market for organic food is set to continue and, therefore, organic farming needs to be further promoted. The EU has developed strict standards to encourage organic farming and advance ecological safety, contributing to the growth of the biostimulants market.
- Biostimulants are becoming more widely adopted as people become more aware of the negative effects of chemically produced pesticides and fertilizers on human health. Biostimulants are also non-toxic and do not contaminate the soil, further contributing to their growing adoption throughout Europe.
Europe Biostimulants Market Trends
European Green Deal is majorly contributing for increasing organic cultivation across the region
- European countries are increasingly promoting organic farming, and the amount of land under organic farming has significantly increased over the last ten years. In March 2021, the European Commission launched an organic action plan to achieve the European Green Deal target of reaching 25% of agricultural land under organic farming by 2030. Austria, Italy, Spain, and Germany are among the leading countries in the European region. As of 2022, Italy has 15.0% of the agriculture area under organic farming, which is higher than the average of the European Union (7.5%).
- In 2021, there were 14.7 million ha of organic land in the European Union (EU). The agricultural production area is divided into three main types of use: arable land crops (mainly cereals, root crops, and fresh vegetables), permanent grassland, and permanent crops (fruit trees and berries, olive groves, and vineyards). The area of organic arable land was 6.5 million ha in 2021, 46% of the EU's total organic agricultural area.
- The organic areas of cereals, oilseeds, protein crops, and pulses in the EU increased by 32.6% between 2017 and 2021, amounting to more than 1.6 million ha. With 1.3 million ha in production, perennial crops accounted for 15% of the organic land in 2020. Olives, grapes, almonds, and citrus fruits are a few examples of crops in this group. As of 2022, Spain, Italy, and Greece are major growers of organic olive trees, with 197,000, 179,000, and 47,000 ha in production, respectively. Both olives and grapes are crucial for Europe's agricultural industry because they can be turned into specialty products that are in demand locally and internationally. The increasing trend in organic acreage in the region is expected to strengthen the organic sector in Europe further.
Growing demand and rising the per capita spending on organic products in the region
- Consumers in Europe are purchasing more goods that are made using natural materials and methods. Even though organic food only makes up a small fraction of the EU's agricultural production, it is no longer a niche sector. The European Union represents the second-largest single market for organic goods internationally, with an average per capita spending of USD 74.8 annually. Europe's per capita spending on organic food doubled in the last decade. In 2020, Swiss and Danish consumers spent the most on organic food (USD 494.09 and USD 453.90 per capita, respectively).
- Germany is the largest organic food market in the European region and the second-largest market in the world after the United States, accounting for a market size of USD 6.3 billion in 2021, with a per capita consumption of USD 75.6. The country accounted for 10.0% of the global organic food demand and is further estimated to register a CAGR of 2.7% between 2021 and 2026.
- The organic food market in France witnessed strong growth, with a 12.6% rise in retail sales in 2021. According to Global Organic Trade, the country's per capita spending on organic food was USD 88.8 in 2021. In 2018, as recorded by the Agence BIO/Spirit Insight Barometer, 88% of French people consumed organic products. The preservation of health, environment, and animal welfare are the primary justifications for consuming organic foods in France. The organic market has begun to grow in several other nations, including Spain, the Netherlands, and Sweden, with the opening of organic stores. The growth in organic sales was triggered post-COVID-19 pandemic, with consumers paying more attention to health issues and knowing the negative effects of conventionally grown food.
Europe Biostimulants Industry Overview
The Europe Biostimulants Market is fragmented, with the top five companies occupying 5.76%. The major players in this market are Agronutrition, BioAtlantis Ltd, Biolchim SPA, Trade Corporation International and Valagro (sorted alphabetically).
Additional Benefits:
- The market estimate (ME) sheet in Excel format
- 3 months of analyst support
TABLE OF CONTENTS
1 EXECUTIVE SUMMARY & KEY FINDINGS
2 REPORT OFFERS
3 INTRODUCTION
- 3.1 Study Assumptions & Market Definition
- 3.2 Scope of the Study
- 3.3 Research Methodology
4 KEY INDUSTRY TRENDS
- 4.1 Area Under Organic Cultivation
- 4.2 Per Capita Spending On Organic Products
- 4.3 Regulatory Framework
- 4.3.1 France
- 4.3.2 Germany
- 4.3.3 Italy
- 4.3.4 Netherlands
- 4.3.5 Russia
- 4.3.6 Spain
- 4.3.7 Turkey
- 4.3.8 United Kingdom
- 4.4 Value Chain & Distribution Channel Analysis
5 MARKET SEGMENTATION (includes market size in Value in USD and Volume, Forecasts up to 2030 and analysis of growth prospects)
- 5.1 Form
- 5.1.1 Amino Acids
- 5.1.2 Fulvic Acid
- 5.1.3 Humic Acid
- 5.1.4 Protein Hydrolysates
- 5.1.5 Seaweed Extracts
- 5.1.6 Other Biostimulants
- 5.2 Crop Type
- 5.2.1 Cash Crops
- 5.2.2 Horticultural Crops
- 5.2.3 Row Crops
- 5.3 Country
- 5.3.1 France
- 5.3.2 Germany
- 5.3.3 Italy
- 5.3.4 Netherlands
- 5.3.5 Russia
- 5.3.6 Spain
- 5.3.7 Turkey
- 5.3.8 United Kingdom
- 5.3.9 Rest of Europe
6 COMPETITIVE LANDSCAPE
- 6.1 Key Strategic Moves
- 6.2 Market Share Analysis
- 6.3 Company Landscape
- 6.4 Company Profiles (includes Global Level Overview, Market Level Overview, Core Business Segments, Financials, Headcount, Key Information, Market Rank, Market Share, Products and Services, and Analysis of Recent Developments).
- 6.4.1 AGLUKON Spezialduenger GmbH & Co.
- 6.4.2 Agronutrition
- 6.4.3 Atlantica Agricola
- 6.4.4 BioAtlantis Ltd
- 6.4.5 Biolchim SPA
- 6.4.6 Bionema
- 6.4.7 Ficosterra
- 6.4.8 Green Has Italia S.p.A
- 6.4.9 Trade Corporation International
- 6.4.10 Valagro
7 KEY STRATEGIC QUESTIONS FOR AGRICULTURAL BIOLOGICALS CEOS
8 APPENDIX
- 8.1 Global Overview
- 8.1.1 Overview
- 8.1.2 Porter's Five Forces Framework
- 8.1.3 Global Value Chain Analysis
- 8.1.4 Market Dynamics (DROs)
- 8.2 Sources & References
- 8.3 List of Tables & Figures
- 8.4 Primary Insights
- 8.5 Data Pack
- 8.6 Glossary of Terms


샘플 요청 목록