|
시장보고서
상품코드
1851538
활성탄 : 시장 점유율 분석, 산업 동향, 통계, 성장 예측(2025-2030년)Activated Carbon - Market Share Analysis, Industry Trends & Statistics, Growth Forecasts (2025 - 2030) |
||||||
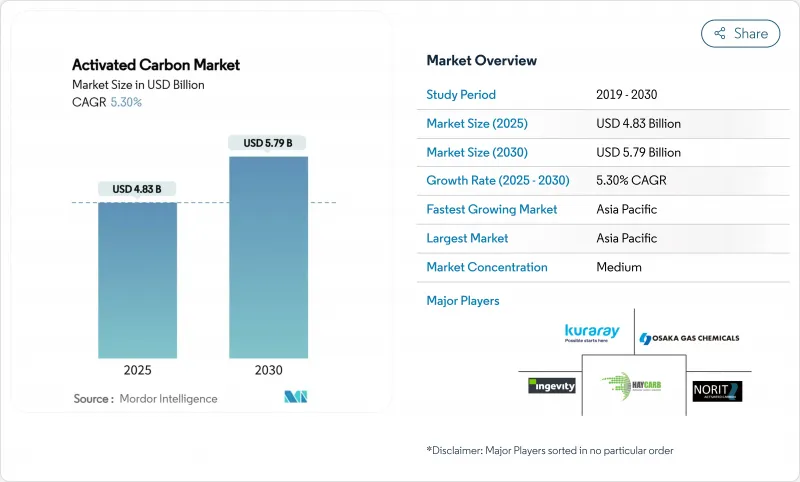
활성탄 시장 규모는 2025년에 48억 3,000만 달러로 추정되고, 2030년에는 57억 9,000만 달러에 이를 것으로 예상되며, 예측 기간(2025-2030년)의 CAGR은 5.30%를 나타낼 전망입니다.
엄격한 수질 규제, 아시아태평양의 급속한 산업화, 제약, 광업, 고도 공기 여과 공정에서 특수 등급 수요 증가가 성장을 가속합니다. 야자 껍질 원료는 여전히 고성능 등급의 고급 원료이지만 공급의 희박과 석탄 가격의 변동은 수직 통합과 대체 전구체 탐구에 박차를 가하고 있습니다. 특히 미국 환경보호청(EPA)의 2024년 PFAS 식수수 기준에서는 입상활성탄(GAC)이 이용 가능한 최상의 기술(Best Available Technology)로 지정되었습니다. 동시에, 분말상 활성탄(PAC)은 석탄화력발전의 수은 배출 억제에 매우 중요하며, 목질계 탄소는 지속가능한 생산의 돌파구에 의해 투자를 모으고 있습니다. 원재료의 확실성을 확보하고, 재활성화 능력에 투자하고, 디지털 감시 서비스를 번들할 수 있는 제조업체는 향후의 계약을 획득하기 위해 최적의 입장에 있습니다.
세계의 활성탄 시장 동향과 인사이트
식수의 PFAS 규정 준수 규정
미국 EPA의 2024년 4월 전국 1차 식수 규제는 6유형의 PFAS 화합물에 상한을 설정하고, GAC를 이용 가능한 최선의 기술로서 정식으로 리스트업하며, 모든 미국의 공공 수도 시스템에 2027년에 모니터링을 개시해, 2029년까지 완전하게 준수할 것을 의무화했습니다. 이러한 의무화로 인해 PFOA와 PFOS의 제거 효율은 99%를 나타내, 활성탄 시스템의 연간 시장 규모는 15억 5,000만 달러에 달할 것으로 예상되고 있습니다. PFAS와 미량오염물질의 역치 강화에 대비하는 유럽의 전력회사는 이러한 사양의 복제를 시작하고 있어 미국과 일본공급업체에 수출 창구를 만들고 있습니다. 시스템 리노베이션은 종종 GAC 매체, 스테인레스 스틸 접촉기, 현장에서 재활성화 서비스 계약을 통합하고 여러 년간의 교환량을 고정하는 경우가 많습니다. 신속한 재활성화 킬른과 디지털 침대 수명 분석을 갖춘 공급업체는 입찰 평가 시 경쟁 우위를 확보할 수 있습니다.
석탄 화력 발전의 대기 오염 방지
북미에서는 현재 55GW를 넘는 발전 용량에 해당하는 135개 이상의 플랜트가 90% 이상의 수은 포획을 달성하는 분말 탄소 분사 시스템을 도입하고 있습니다. EPA의 2024년 5월 기술 검토는 허용되는 수은 및 미립자 물질의 규제 값을 더욱 좁히고 습식 스크러버 업그레이드에 투자하지 않으려는 소유자에게 PAC가 가장 저렴한 비용의 리노베이션이 될 것입니다. 중국의 규제 당국도 배기 가스 규제를 재구성하고 있으며 소형 보일러를 위한 흡착 기반 솔루션을 가속화하고 있습니다. 높은 분사 온도와 가혹한 점화 손실 역치에 맞춘 분말 배합은 공급 부족에 빠지기 때문에 기공의 폐색에 강한 미국산 코코넛 쉘 PAC 등급의 프리미엄 가격이 가능하게 되었습니다.
코코넛 껍질의 원료 공급 중단
열대 국가들은 세계 코코넛 껍질 숯의 80% 이상을 공급하고 있지만, 필리핀 사이클론에 의한 수확 후퇴로 인해 2024년 동안 원료 공급이 감소했습니다. Carbon Activated Corporation과 같은 생산자는 수직 통합을 가속화하고 스리랑카에 두 번째 차 공장을 개설하면서 중국의 쉘 차 수출업체와 오버플로 공급 계약을 맺었습니다. 예기치 않은 상황에 대비하여 활엽수 칩과 팜 핵 껍질을 사용하는 것도 검토되고 있지만, 이러한 대체품으로는 기공 분포가 넓어져 PFAS나 귀금속 이온의 제거 효율이 저하되는 경우가 많습니다.
부문 분석
야자 껍질 제품은 2024년 활성탄 시장의 36.5%를 차지하며, PFAS 흡착과 금 담지 작업이 뛰어난 미세 기공 분포를 반영했습니다. 99%를 초과하는 경도는 역세척 시의 단편화를 최소화하고 지자체 필터의 바닥 수명을 연장합니다. 그러나 아시아태평양의 공장 확장은 쉘 챠를 둘러싸고 치열한 경쟁을 펼치고 2024년 날씨 불순은 단독 조달 취약성을 부각시켰습니다.
지속 가능한 산림 인증 제도와 높은 요오드가를 초래하는 열분해의 개량을 배경으로 CAGR이 5.8%를 나타낼 전망입니다. 석탄 시스템은 미세 기공의 부피가 그다지 중요하지 않은 배기 가스 및 용매 회수 용도에서 여전히 비용 효율적입니다. 유망하지만, 슬러지와 톱밥 유래의 탄화물에 관한 학술적 연구는 아직 파일럿 스케일이며, 주류의 생산자는 기존 전구물질에 의존하고 있습니다.
과립 제품은 재활성화 능력과 충전 침대에서 일관된 헤드 손실 성능으로 인해 2024년에는 압도적인 50%의 점유율을 차지했고, 2030년까지의 CAGR은 6.33%로 가장 높을 것으로 예측됩니다. 압출/펠릿화 탄소는 용매 증기 흡착, 압축 공기 건조, 자동차 캐니스터 등 저압력 손실과 높은 파쇄 강도가 가장 중요한 용도에 대응합니다. 혁신적인 기상법 GAC 장치는 전기 히터를 사용하여 현장에서 침대를 재생하는 온도 스윙 흡착을 통합합니다.
파우더 등급은 재사용성이 낮고 수시간 이내에 탁한 수원을 처리할 수 있는 재해 구조용 물 팩으로 대표되는 대로 신속하게 공급되는 고표면적 제품이 필요한 시장에서 점유율을 획득하고 있습니다. 펠렛화 제품은 현재 바이오가스 정화로 축발을 옮기고 있으며, 유럽의 매립지 가스 처리업체는 황화수소 제거용 황함침 첨가제를 주입한 펠릿을 조달하고 있습니다. 장기적으로 환경 폐기 규칙과 탄소 실적 회계는 경제성이 재생가능한 GAC 시스템으로 더욱 기울어져 활성탄 시장 성장에 기여할 가능성이 커질 수 있습니다.
지역 분석
아시아태평양은 2024년의 수익 점유율에서 63%를 차지했고 2030년까지의 CAGR은 6.11%를 나타낼 것으로 예상되어 활성탄 시장 확대의 중심적 존재가 되고 있습니다. 중국은 야자 껍질, 석탄, 톱밥을 국내 수도 사업과 수출 시장에 맞춘 광범위한 탄소로 변환하는 수직 통합 플랜트로 지역 생산을 지원합니다. 인도의 Jal Jeevan 미션은 농촌 지역에서 보편적인 물 사용을 목표로 비소와 불소 제거를위한 GAC 필터를 규정하는 입찰 서류를 발행합니다.
북미는 규제의 확실성과 1인당 소비량이 많습니다. 2024년 EPA PFAS 규정만으로도 10년 말까지 GAC 수요가 두 배로 늘어났습니다. 유럽은 규모는 작지만 기술적으로 정교한 시장입니다. 케임브리지 대학의 조사에서는 에너지 투입량을 억제하면서 공기 중의 CO2를 직접 흡착하는 전기 목탄 스폰지가 개발되어 기후 완화 용도로의 장래의 다양화를 시사하고 있습니다.
남미와 중동에서는 채굴과 가스처리에 사용되는 탄소의 채용이 급속히 진행되고 있습니다. 칠레의 금 채굴업체는 CIL 회로에 코코넛 쉘 카본을 지정하고, 카타르의 LNG 제조업체는 저온 분리 전의 엄격한 수은 사양의 오염 제한을 충족시키기 위해 펠릿화 탄소를 채택합니다.
기타 혜택 :
- 엑셀 형식 시장 예측(ME) 시트
- 3개월간의 애널리스트 지원
목차
제1장 서론
- 조사 전제조건과 시장 정의
- 조사 범위
제2장 조사 방법
제3장 주요 요약
제4장 시장 상황
- 시장 개요
- 시장 성장 촉진요인
- 미국에서의 수처리 용도가 엄격한 환경규제에의 대응
- 대기 오염 방지(특히 수은 제거)의 주목도 증가
- 높아지는 정수 수요
- 금 채굴과 금속 회수
- 농업과 농약으로부터의 높은 수요
- 시장 성장 억제요인
- 야자 껍질 원료공급 체인 혼란
- 석탄계 PAC 제조업체의 이폭을 좁히는 소성탄 가격의 상승
- 순환형 비즈니스 모델을 제한하는 재가동 공장의 높은 자본 집약도
- 밸류체인 분석
- Porter's Five Forces
- 공급기업의 협상력
- 구매자의 협상력
- 신규 참가업체의 위협
- 대체품의 위협
- 경쟁도
제5장 시장 규모와 성장 예측
- 원재료별
- 석탄 베이스
- 코코넛 껍질 베이스
- 목재 베이스
- 기타 원료(이탄, 갈탄 등)
- 형태별
- 분말 활성탄(PAC)
- 과립 활성탄(GAC)
- 압출/펠릿 활성탄(EAC)
- 용도별
- 탈색 처리
- 설탕 생산
- 농축 처리
- 용매 회수
- PFAS 흡착 처리
- 음용수 처리
- 기타 용도
- 최종 사용자 업계별
- 수처리
- 산업 가공
- 헬스케어
- 식음료
- 자동차
- 기타 최종 사용자 업계
- 지역별
- 아시아태평양
- 중국
- 인도
- 일본
- 한국
- 기타 아시아태평양
- 북미
- 미국
- 캐나다
- 멕시코
- 유럽
- 독일
- 영국
- 프랑스
- 이탈리아
- 스페인
- 기타 유럽
- 남미
- 브라질
- 아르헨티나
- 기타 남미
- 중동 및 아프리카
- 사우디아라비아
- 남아프리카
- 기타 중동 및 아프리카
- 아시아태평양
제6장 경쟁 구도
- 시장 집중도
- 전략적 동향
- 시장 점유율 분석
- 기업 프로파일
- Albemarle Corporation
- Arq, Inc.
- Carbon Activated Corporation
- CarboTech
- CPL
- Donau Carbon GmbH
- HAYCARB PLC
- Ingevity
- KALPAKA CHEMICALS
- KURARAY CO., LTD.
- MICBAC INDIA
- Nanping Yuanli Active Carbon Company
- Norit
- Osaka Gas Chemicals Co., Ltd
- Rotocarb
- Silcarbon Aktivkohle GmbH
- Suneeta Carbons
제7장 시장 기회와 향후 전망
KTH 25.11.21The Activated Carbon Market size is estimated at USD 4.83 billion in 2025, and is expected to reach USD 5.79 billion by 2030, at a CAGR of 5.30% during the forecast period (2025-2030).
Stringent water-quality rules, rapid industrialization in Asia-Pacific, and rising demand for specialty grades in pharmaceutical, mining, and advanced air-filtration processes propel growth. Coconut-shell feedstock remains the premium raw material for high-performance grades, yet tightening supply and volatile coal prices are spurring vertical integration and exploration of alternative precursors. Regulatory momentum anchors long-term demand for granular products, most notably the U.S. EPA's 2024 PFAS drinking-water standard naming granular activated carbon (GAC) as Best Available Technology. Simultaneously, powdered activated carbon (PAC) is pivotal in mercury-emission control for coal-fired utilities, while wood-based carbons attract investment through sustainable production breakthroughs. Manufacturers able to secure raw-material certainty, invest in reactivation capacity, and bundle digital monitoring services are best positioned to capture upcoming contracts.
Global Activated Carbon Market Trends and Insights
PFAS-Compliance Regulations for Drinking Water
The U.S. EPA's April 2024 National Primary Drinking Water Regulation capped six PFAS compounds and formally lists GAC as Best Available Technology, compelling all U.S. public water systems to start monitoring in 2027 and fully comply by 2029. The mandate next brings a projected USD 1.55 billion annual market for activated carbon systems, supported by validated removal efficiencies surpassing 99% for PFOA and PFOS. European utilities preparing for tighter PFAS and micro-pollutant thresholds have begun replicating these specifications, creating an export window for U.S. and Japanese suppliers. System retrofits frequently integrate GAC media, stainless-steel contactors, and on-site reactivation service contracts, locking in multi-year replacement volumes. Suppliers with rapid-turnaround reactivation kilns and digital bed-life analytics gain competitive headroom during bid evaluations.
Air-Pollution Control for Coal-Fired Utilities
More than 135 North American plants, representing over 55 GW of capacity, currently deploy powdered-carbon injection systems that achieve more than 90% mercury capture. The EPA's May 2024 technology review further narrows allowable mercury and particulate limits, making PAC the lowest-cost retrofit for owners unwilling to invest in wet-scrubber upgrades. Chinese regulators are also reshaping flue-gas norms, accelerating adsorption-based solutions for smaller boilers. Powder formulations tailored for elevated injection temperatures and strict loss-on-ignition thresholds are in short supply, enabling premium pricing for U.S. coconut-shell PAC grades that resist pore blocking.
Feedstock Supply Disruption for Coconut Shells
Tropical nations supply more than 80% of global coconut-shell char, and harvest setbacks caused by cyclones in the Philippines cut feedstock availability during 2024. Producers such as Carbon Activated Corporation accelerated vertical integration, opening a second char plant in Sri Lanka while lining up overflow supply agreements with Chinese shell-char exporters. Contingency plans involve qualifying hardwood chips and palm-kernel shells, yet such alternatives often produce broader pore distributions that reduce removal efficiency for PFAS and precious-metal ions.
Other drivers and restraints analyzed in the detailed report include:
- Expanding Water-Purification Demand in Emerging Economies
- Gold Mining and Metal-Recovery Requirements
- Volatile Kiln-grade Coal Pricing
For complete list of drivers and restraints, kindly check the Table Of Contents.
Segment Analysis
Coconut-shell products captured 36.5% of the activated carbon market in 2024, reflecting superior micropore distributions that excel at PFAS adsorption and gold-loading tasks. Hardness values exceeding 99% minimize fragmentation during backwashing, extending bed life in municipal filters. Asia-Pacific mill expansions, however, compete fiercely for shell char, and 2024 weather disruptions spotlighted the vulnerability of single-source procurement.
Wood-based carbons are the fastest-advancing alternative, rising at a 5.8% CAGR on the back of certified sustainable forestry programs and pyrolysis improvements that yield high iodine numbers. Coal-based variants remain cost-effective for flue-gas and solvent-recovery duties where tight micropore volume is less critical. Although promising, academic work on sludge- and sawdust-derived carbons is still at pilot scale, leaving mainstream producers dependent on legacy precursors.
Granular products held a commanding 50% share in 2024 and are forecast to record the highest 6.33% CAGR through 2030, thanks to their reactivation capability and consistent head-loss performance in packed beds. Extruded/pelletized carbons address applications such as solvent vapor adsorption, compressed-air drying, and automotive canisters where low pressure drop and high crush strength are paramount. GAC design considerations focus on uniform particle size to reduce channeling, while innovative vapor-phase GAC units integrate temperature swing adsorption that regenerates beds in situ with electric heaters.
Powdered grades, although less reusable, capture share in markets requiring high surface-area products delivered rapidly, illustrated by disaster-relief water packs capable of treating turbid sources within hours. Pelletized offerings are now pivoting toward biogas purification, with European landfill-gas operators procuring pellets infused with sulfur-impregnated additives for hydrogen-sulfide removal. Long-term, environmental disposal rules and carbon-footprint accounting may tilt economics further toward regenerable GAC systems, strengthening their outsized contribution to activated carbon market growth.
The Activated Carbon Market Report Segments the Industry by Raw Material (Coal-Based, Coconut-Shell-Based, and More), Form (Powdered Activated Carbon (PAC), Granular Activated Carbon (GAC), and Extruded/Pelletised Activated Carbon (EAC)), Application (Decolorization Treatment, Sugar Production, and More), End-User Industry (Water Treatment, Industrial Processing, and More), and Geography (Asia-Pacific, North America, and More).
Geography Analysis
Asia-Pacific held a dominant 63% revenue share in 2024 and is forecast to grow at a leading 6.11% CAGR to 2030, reinforcing its centrality to activated carbon market expansion. China anchors regional production with vertically integrated plants that convert coconut shells, coal, and sawdust into a broad portfolio of carbons tailored for domestic water utilities and export markets. India's Jal Jeevan mission, targeting universal rural-water access, is issuing tender documents that stipulate GAC filters for arsenic and fluoride removal, thereby opening procurement to both local mills and Japanese-owned subsidiaries.
North America is buoyed by regulatory certainty and high per-capita consumption. The 2024 EPA PFAS rule alone could double GAC demand by the end of the decade. Europe commands a smaller yet technologically sophisticated market. Research at the University of Cambridge yielded an electrified charcoal sponge that adsorbs CO2 directly from air with reduced energy input, hinting at future diversification into climate-mitigation applications.
South America and the Middle East, though accounting for modest volume, record rapid adoption of carbons for mining and gas-processing duties. Chilean gold miners specify coconut-shell carbons for CIL circuits, while Qatari LNG producers deploy pelletized carbons to meet stringent mercury spec contamination limits prior to cryogenic separation.
- Albemarle Corporation
- Arq, Inc.
- Carbon Activated Corporation
- CarboTech
- CPL
- Donau Carbon GmbH
- HAYCARB PLC
- Ingevity
- KALPAKA CHEMICALS
- KURARAY CO., LTD.
- MICBAC INDIA
- Nanping Yuanli Active Carbon Company
- Norit
- Osaka Gas Chemicals Co., Ltd
- Rotocarb
- Silcarbon Aktivkohle GmbH
- Suneeta Carbons
Additional Benefits:
- The market estimate (ME) sheet in Excel format
- 3 months of analyst support
TABLE OF CONTENTS
1 Introduction
- 1.1 Study Assumptions and Market Definition
- 1.2 Scope of the Study
2 Research Methodology
3 Executive Summary
4 Market Landscape
- 4.1 Market Overview
- 4.2 Market Drivers
- 4.2.1 Conformance to Stringent Environmental Regulations in Water Treatment Applications in the United States
- 4.2.2 Augmenting Prominence for Air Pollution Control (Especially Mercury Removal)
- 4.2.3 Growing Water Purification Demand
- 4.2.4 Gold Mining and Metal Recovery
- 4.2.5 High demand from Agriculture and Agrochemicals
- 4.3 Market Restraints
- 4.3.1 Supply-chain disruption of coconut shell feedstock
- 4.3.2 Escalating kiln-grade coal prices narrowing margins for coal-based PAC makers
- 4.3.3 High capital intensity of reactivation plants limiting circular business models
- 4.4 Value Chain Analysis
- 4.5 Porter's Five Forces
- 4.5.1 Bargaining Power of Suppliers
- 4.5.2 Bargaining Power of Buyers
- 4.5.3 Threat of New Entrants
- 4.5.4 Threat of Substitutes
- 4.5.5 Degree of Competition
5 Market Size and Growth Forecasts (Value and Volume)
- 5.1 By Raw Material
- 5.1.1 Coal-Based
- 5.1.2 Coconut-Shell-Based
- 5.1.3 Wood-Based
- 5.1.4 Other Raw Materials (Peat, Lignite, etc.)
- 5.2 By Form
- 5.2.1 Powdered Activated Carbon (PAC)
- 5.2.2 Granular Activated Carbon (GAC)
- 5.2.3 Extruded / Pelletised Activated Carbon (EAC)
- 5.3 By Application
- 5.3.1 Decolorization Treatment
- 5.3.2 Sugar Production
- 5.3.3 Concentration Treatment
- 5.3.4 Solvent Recovery
- 5.3.5 PFAS Adsorption Treatment
- 5.3.6 Drinking Water Treatment
- 5.3.7 Other Applications
- 5.4 By End-user Industry
- 5.4.1 Water Treatment
- 5.4.2 Industrial Processing
- 5.4.3 Healthcare
- 5.4.4 Food and Beverage
- 5.4.5 Automotive
- 5.4.6 Other End-user Industry
- 5.5 By Geography
- 5.5.1 Asia-Pacific
- 5.5.1.1 China
- 5.5.1.2 India
- 5.5.1.3 Japan
- 5.5.1.4 South Korea
- 5.5.1.5 Rest of Asia-Pacific
- 5.5.2 North America
- 5.5.2.1 United States
- 5.5.2.2 Canada
- 5.5.2.3 Mexico
- 5.5.3 Europe
- 5.5.3.1 Germany
- 5.5.3.2 United Kingdom
- 5.5.3.3 France
- 5.5.3.4 Italy
- 5.5.3.5 Spain
- 5.5.3.6 Rest of Europe
- 5.5.4 South America
- 5.5.4.1 Brazil
- 5.5.4.2 Argentina
- 5.5.4.3 Rest of South America
- 5.5.5 Middle-East and Africa
- 5.5.5.1 Saudi Arabia
- 5.5.5.2 South Africa
- 5.5.5.3 Rest of Middle-East and Africa
- 5.5.1 Asia-Pacific
6 Competitive Landscape
- 6.1 Market Concentration
- 6.2 Strategic Moves
- 6.3 Market Share Analysis
- 6.4 Company Profiles (includes Global-level Overview, Market-level Overview, Core Segments, Financials as available, Strategic Information, Market Rank/Share, Products and Services, and Recent Developments)
- 6.4.1 Albemarle Corporation
- 6.4.2 Arq, Inc.
- 6.4.3 Carbon Activated Corporation
- 6.4.4 CarboTech
- 6.4.5 CPL
- 6.4.6 Donau Carbon GmbH
- 6.4.7 HAYCARB PLC
- 6.4.8 Ingevity
- 6.4.9 KALPAKA CHEMICALS
- 6.4.10 KURARAY CO., LTD.
- 6.4.11 MICBAC INDIA
- 6.4.12 Nanping Yuanli Active Carbon Company
- 6.4.13 Norit
- 6.4.14 Osaka Gas Chemicals Co., Ltd
- 6.4.15 Rotocarb
- 6.4.16 Silcarbon Aktivkohle GmbH
- 6.4.17 Suneeta Carbons
7 Market Opportunities and Future Outlook
- 7.1 White-space and Unmet-need Assessment
- 7.2 Rising Research Activities Research to Develop Bio-based Plastics