|
시장보고서
상품코드
1910446
레디믹스 콘크리트 : 시장 점유율 분석, 업계 동향 및 통계, 성장 예측(2026-2031년)Ready Mix Concrete - Market Share Analysis, Industry Trends & Statistics, Growth Forecasts (2026 - 2031) |
||||||
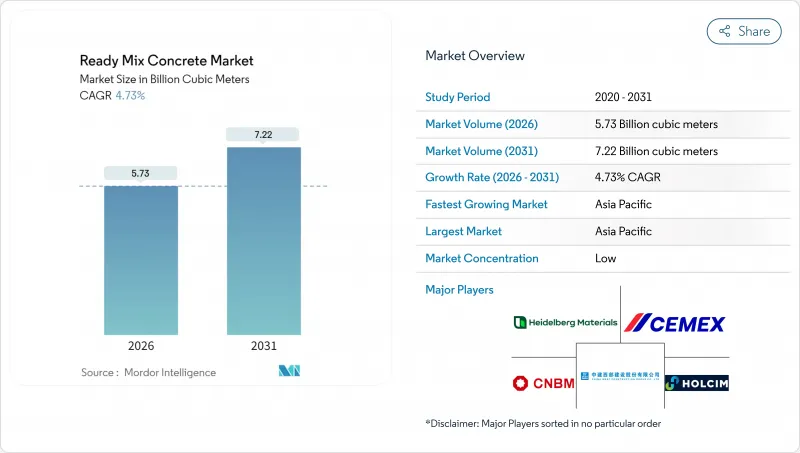
레디믹스 콘크리트 시장은 2025년에 54억 7,000만 입방미터로 평가되었고, 2026년 57억 3,000만 입방미터에서 2031년까지 72억 2,000만 입방미터에 이를 것으로 예측됩니다.
예측 기간(2026-2031년)의 CAGR은 4.73%를 나타낼 것으로 예상됩니다.
아시아태평양과 북미의 견조한 공공 부문 파이프라인이 이 수량 성장을 지원하고 있습니다. 한편, 디지털 배차 플랫폼과 텔레매틱스 기술은 차량 생산성 향상, 배송 편차 감소, 공급업체의 이익률 강화에 기여하고 있습니다. 인프라 지출에 정부가 컴플라이언스 요건을 부과하기 때문에 클링커를 시멘트 보조재로 대체하는 저탄소 배합 설계가 주목을 받고 있습니다. 2019년 이후의 원재료 가격 상승으로 생산자의 이익폭은 축소되었지만, 골재와 시멘트에 소급 통합(백워드 통합)을 실시하고 실시간 품질 감시를 도입하는 공급업체는 보다 건전한 수익을 유지하고 있습니다. 동시에, 퀴크리트 서밋(Quikrete-Summit)과 CRH의 지역 자산 인수와 같은 합병은 규모의 경제와 지리적 밀도가 레디믹스 콘크리트 시장에서 여전히 중요한 요소임을 보여줍니다.
세계의 레디믹스 콘크리트 시장 동향과 인사이트
급속한 도시화와 주택 수요
인도, 인도네시아, 베트남의 급속한 도시 인구 증가는 여전히 대규모 주택 공급 부족을 유발하고 있습니다. 개발자는 강도 균일성, 진화하는 건축 기준에의 적합성, 프로젝트 사이클의 단축화 등, 오프사이트 배치 콘크리트를 선호하여 채용하고 있습니다. 중국 부동산 부문에는 과도한 공급이 있지만 공장 건설과 물류 허브는 여전히 상당한 양의 콘크리트를 소비하고 있으며 지역 변동을 완화하고 있습니다. 이러한 요인들이 결합되어 레디믹스 콘크리트 시장 수요 증가는 향후 10년간 지속될 것으로 전망됩니다.
정부의 대규모 인프라 계획
여러 해에 걸친 예산의 확약으로 생산자는 생산 능력의 증강을 승인할 수 있는 전망을 얻을 수 있습니다. 미국은 2024년 교통 인프라 건설에 2,140억 달러를 할당했으며 인도의 국가 인프라 계획은 고속도로에서 재생에너지 발전까지 7,400건의 프로젝트를 다루었습니다. 인도네시아와 호주에서도 유사한 계획이 장기적인 수요를 확보하고 있으며 주택 시장 침체기간에도 플랜트 가동률이 손익 분기점 이상을 유지할 수 있도록 보장하고 있습니다.
원재료 가격의 변동성
2019년 이후 시멘트 가격은 38%, 골재는 31% 상승하여 계약 구조에 따른 전가 지연으로 마진이 압박되고 있습니다. 지정학적 에너지 충격과 트럭 부족은 비용의 불확실성을 증폭시키고, 생산자는 조달 대상의 다양화와 지수 연동 가격의 도입을 강요받고 있습니다. 그러나 고객은 고정가격계약을 요구하는 경향이 강해지고, 리스크가 공급측에 전가됨으로써 레디믹스 콘크리트 시장의 성장이 억제되고 있습니다.
부문 분석
2025년 운송용 혼합 콘크리트는 레디믹스 콘크리트 시장의 72.65%를 차지했습니다. 이것은 대규모 트럭 차량군, 확립된 주문 시스템, 경쟁력 있는 납품 비용에 의해 지원됩니다. 한편, 현장 혼합 콘크리트는 수량적으로는 매우 일부이지만, 건설업자가 장거리 운송이나 현장 타설 시간 제약에 직면하는 가운데, 5.66%의 연평균 복합 성장률(CAGR)로 확대가 전망됩니다. 교통 정체로 인해 일정에 여유가 없어지는 라틴아메리카의 도시 지역에서는 채용이 증가하고 있습니다. 댐이나 원자력 프로젝트 등, 피크시의 균일성이 요구되는 안건에서는 중앙 혼합 콘크리트가 여전히 선호됩니다만, 그 점유율이 약간 상승하는 것은 지역의 메가 프로젝트가 입찰 단계에 들어갔을 경우에 한정됩니다.
레디믹스 콘크리트 시장 규모는 최대 3시간 슬럼프를 유지하는 성능 혼화제의 보급으로 2030년까지 확대될 것으로 전망됩니다. 생산자는 레디믹스·수송 혼합 양 대응의 듀얼 드럼 플랜트에 투자해, 다운타임을 최소한으로 억제하면서 변화하는 수요에 대응하고 있습니다.
레디믹스 콘크리트 시장 보고서는 제품 유형(중앙 믹싱, 수축 믹싱, 트랜짓 믹싱), 최종 용도 분야(상업, 산업, 공공시설, 인프라, 주택), 지역(아시아태평양, 북미, 유럽, 남미, 중동 및 아프리카)별로 분류됩니다. 시장 예측은 수량(입방미터)으로 제공됩니다.
지역별 분석
아시아태평양은 2025년에 76.55%의 점유율로 레디믹스 콘크리트 시장을 견인해 2031년까지 연평균 복합 성장률(CAGR) 5.06%를 나타낼 것으로 전망됩니다. 인도의 1조 4,000억 달러 규모의 국가 인프라 계획에는 고속도로, 전용 화물 회랑, 5,000만 호의 저가 주택이 포함되어 있으며 수년간 수요 전망이 확보되고 있습니다. 인도네시아의 4,120억 달러 규모의 교통망 정비 계획, 베트남의 제조업 붐, 중국의 유틸리티 지출의 계속이, 본토의 주택 섹터의 연조를 상쇄하고 있습니다. 높은 생산량 제조업체는 델리 뭄바이 고속도로 등 경제 회랑을 따라 추가 플랜트를 설치하여 운송 거리 단축과 탄소 목표 달성을 도모하고 있습니다.
북미에서는 연방 자금에 의한 교량 건설, 항만 준설, 전기자동차 충전 회랑 정비가 진행되어 안정된 성장이 예상됩니다. 미국은 2023년에 약 4억 입방 야드(640억 달러)를 투입하고, 2025-2026년에는 중단자리 수량 증가가 전망됩니다. 캐나다에서는 도시 교통이 추진되고, 멕시코에서는 니어 쇼어링의 파도가 국경을 따라 공업 단지 개발을 촉진하고 있습니다.
유럽에서는 에너지 충격에 의해 2024년의 생산량은 감소했습니다만, 개수 공사나 육상 풍력 발전 플랫폼을 중심으로 한 정책 자극책이 베이스라인 수요를 지지하고 있습니다. CBAM(EU 지역 내 배출량 거래 제도) 하에서의 탄소 가격 상승은 낮은 클링커 혼합 콘크리트로의 전환을 가속화하고 건설 업계 전체의 축소에도 불구하고 환경면에서 차별화된 공급업체가 점유율을 확대할 수 있게 합니다. 동유럽시장에서는 EU의 결속기금을 활용하여 철도와 폐수처리시설의 업그레이드가 진행되고 있어 장기적인 톤수 잠재력을 높이고 레디믹스 콘크리트 시장에 지역 전체에서 새로운 기세를 가져오고 있습니다.
기타 혜택 :
- 엑셀 형식 시장 예측(ME) 시트
- 애널리스트 지원(3개월간)
자주 묻는 질문
목차
제1장 서론
- 조사 전제조건 및 시장 정의
- 조사 범위
제2장 조사 방법
제3장 주요 요약
제4장 시장 상황
- 시장 개요
- 시장 성장 촉진요인
- 급속한 도시화와 주택 수요
- 정부에 의한 대규모 인프라 계획
- 품질관리된 오프사이트 배치에의 선호
- 환경면으로부터의 재료 효율화의 추진
- 디지털 배차와 텔레매틱스에 의한 배송의 최적화
- 시장 성장 억제요인
- 원재료 가격의 변동성
- 짧은 작업 가능 기간/물류 위험
- 현장 설치형 용적식 믹서의 보급
- 밸류체인 분석
- Porter's Five Forces
- 공급기업의 협상력
- 구매자의 협상력
- 대체품의 위협
- 신규 참가업체의 위협
- 경쟁 기업 간 경쟁 관계
제5장 시장 규모와 성장 예측
- 제품 유형별
- 중앙 믹스
- 수축 믹스
- 트랜짓 믹스
- 최종 용도별
- 상업
- 산업 및 기관
- 인프라
- 주택
- 지역별
- 아시아태평양
- 중국
- 인도
- 일본
- 한국
- 호주
- 인도네시아
- 베트남
- 기타 아시아태평양
- 북미
- 미국
- 캐나다
- 멕시코
- 유럽
- 독일
- 프랑스
- 영국
- 이탈리아
- 스페인
- 러시아
- 기타 유럽
- 남미
- 브라질
- 아르헨티나
- 기타 남미
- 중동 및 아프리카
- 사우디아라비아
- 아랍에미리트(UAE)
- 기타 중동 및 아프리카
- 아시아태평양
제6장 경쟁 구도
- 시장 집중도
- 전략적 동향
- 시장 점유율(%)/랭킹 분석
- 기업 프로파일
- 아다니 그룹
- BBMG Corporation
- Boral Limited
- Buzzi SpA
- CEMEX SAB de CV
- China National Building Material Group Corporation
- China West Construction Group
- CRH
- Foshan Huijiang Concrete Co., Ltd.
- Heidelberg Materials
- Holcim
- Martin Marietta Materials
- OYAK Cimento
- SAMPYO Group
- Titan Cement
- UltraTech Cement Ltd.
- Vicat SA
- Votorantim Cimentos
제7장 시장 기회와 향후 전망
제8장 CEO를 위한 주요 전략적 과제
KTH 26.01.22The Ready Mix Concrete Market was valued at 5.47 billion cubic meters in 2025 and estimated to grow from 5.73 billion cubic meters in 2026 to reach 7.22 billion cubic meters by 2031, at a CAGR of 4.73% during the forecast period (2026-2031).

Robust public-sector pipelines in Asia-Pacific and North America underpin this volume growth, while digital dispatch platforms and telematics improve fleet productivity, lower delivery variability, and strengthen supplier margins. Low-carbon mix designs that replace clinker with supplementary cementitious materials gain traction because governments attach compliance requirements to infrastructure spending. Raw-material price spikes since 2019 have narrowed producer spreads, yet suppliers that backward-integrate into aggregates and cement-and adopt real-time quality monitoring-sustain healthier earnings. At the same time, mergers such as Quikrete-Summit and CRH's regional asset buys indicate that scale economies and geographic density remain critical levers in the ready mix concrete market.
Global Ready Mix Concrete Market Trends and Insights
Rapid Urbanization and Housing Demand
Fast-growing urban populations in India, Indonesia, and Vietnam continue to translate into large housing backlogs. Developers favor off-site batched concrete for its strength uniformity, compliance with evolving building codes, and shorter project cycles. Despite an overhang in China's property segment, factory construction and logistics hubs still consume sizeable volumes, cushioning regional volatility. Combined, these forces extend the demand runway for the ready mix concrete market well into the next decade.
Government Mega-Infrastructure Pipelines
Multi-year budget commitments provide visibility that allows producers to green-light capacity additions. The United States allocated USD 214 billion for transportation construction in 2024, while India's National Infrastructure Pipeline covers 7,400 projects ranging from highways to renewable power. Similar agendas in Indonesia and Australia lock in long-cycle demand, ensuring that plant utilizations remain above breakeven even during residential downturns.
Raw-Material Price Volatility
Cement prices have risen 38% and aggregates 31% since 2019, squeezing spreads when contract structures delay pass-through. Geopolitical energy shocks and trucking shortages amplify cost unpredictability, compelling producers to diversify sourcing and adopt index-linked pricing. Customers, however, increasingly demand fixed-price contracts, transferring risk back to suppliers and tempering growth in the ready mix concrete market.
Other drivers and restraints analyzed in the detailed report include:
- Preference for Quality-Controlled Off-Site Batching
- Environmental Push for Material Efficiency
- Short Workable Life and Logistics Risk
For complete list of drivers and restraints, kindly check the Table Of Contents.
Segment Analysis
Transit mixed concrete accounted for 72.65% of the ready mix concrete market in 2025, supported by vast truck fleets, established orders, and competitive delivered costs. Shrink mixed concrete, while only a fraction of volume, is projected to post a 5.66% CAGR as builders tackle longer transport distances and tighter on-site pouring windows. Adoption is rising in Latin American metros where traffic congestion narrows scheduling buffers. Central mixed concrete remains preferred for dams and nuclear projects that specify peak uniformity, though its share inches forward only when regional megaprojects come to tender.
The ready mix concrete market size attributed to shrink mixed solutions is expected to grow by 2030, supported by performance admixtures that maintain slump for up to three hours. Producers invest in dual-purpose drum plants capable of both shrink and transit mixes to serve evolving demand with minimal downtime.
The Ready Mix Concrete Market Report is Segmented by Product Type (Central Mixed, Shrink Mixed, and Transit Mixed), End-Use Sector (Commercial, Industrial and Institutional, Infrastructure, and Residential), and Geography (Asia-Pacific, North America, Europe, South America, and Middle-East and Africa). The Market Forecasts are Provided in Terms of Volume (Cubic Meters).
Geography Analysis
Asia-Pacific dominates the ready mix concrete market with 76.55% share in 2025 and a forecast 5.06% CAGR to 2031. India's USD 1.4 trillion National Infrastructure Pipeline encompasses highways, dedicated freight corridors, and 50 million affordable homes, ensuring multi-year demand visibility. Indonesia's USD 412 billion connectivity blueprint, Vietnam's manufacturing boom, and continued Chinese public-works spending offset softness in the mainland residential sector. High-volume producers install additional plants along economic corridors such as the Delhi-Mumbai Expressway to cut haulage distances and meet carbon targets.
North America contributes stable growth as federal funding lines disburse for bridges, port dredging, and electric vehicle charging corridors. The United States poured roughly 400 million yd3 (USD 64 billion) in 2023 and expects mid-single-digit volume increases in 2025-2026. Canada advances urban transit, while Mexico's near-shoring wave fuels industrial parks along the border.
Europe's energy shock trimmed 2024 output, yet policy stimuli centered on renovation and on-shore wind platforms sustain baseline demand. Carbon price escalation under CBAM accelerates the migration to low-clinker mixes, allowing environmentally differentiated suppliers to expand shares despite broader construction contraction. Eastern European markets tap EU cohesion funds for rail and wastewater upgrades, lifting long-term tonnage potential and giving the ready mix concrete market renewed momentum region-wide.
- Adani Group
- BBMG Corporation
- Boral Limited
- Buzzi S.p.A
- CEMEX SAB de CV
- China National Building Material Group Corporation
- China West Construction Group
- CRH
- Foshan Huijiang Concrete Co., Ltd.
- Heidelberg Materials
- Holcim
- Martin Marietta Materials
- OYAK Cimento
- SAMPYO Group
- Titan Cement
- UltraTech Cement Ltd.
- Vicat SA
- Votorantim Cimentos
Additional Benefits:
- The market estimate (ME) sheet in Excel format
- 3 months of analyst support
TABLE OF CONTENTS
1 Introduction
- 1.1 Study Assumptions and Market Definition
- 1.2 Scope of the Study
2 Research Methodology
3 Executive Summary
4 Market Landscape
- 4.1 Market Overview
- 4.2 Market Drivers
- 4.2.1 Rapid urbanization and housing demand
- 4.2.2 Government mega-infrastructure pipelines
- 4.2.3 Preference for quality-controlled off-site batching
- 4.2.4 Environmental push for material efficiency
- 4.2.5 Digital dispatch and telematics optimise delivery
- 4.3 Market Restraints
- 4.3.1 Raw-material price volatility
- 4.3.2 Short workable life/logistics risk
- 4.3.3 Proliferation of on-site volumetric mixers
- 4.4 Value Chain Analysis
- 4.5 Porter's Five Forces
- 4.5.1 Bargaining Power of Suppliers
- 4.5.2 Bargaining Power of Buyers
- 4.5.3 Threat of Substitutes
- 4.5.4 Threat of New Entrants
- 4.5.5 Competitive Rivalry
5 Market Size and Growth Forecasts (Volume)
- 5.1 By Product Type
- 5.1.1 Central Mixed
- 5.1.2 Shrink Mixed
- 5.1.3 Transit Mixed
- 5.2 By End-use Sector
- 5.2.1 Commercial
- 5.2.2 Industrial and Institutional
- 5.2.3 Infrastructure
- 5.2.4 Residential
- 5.3 By Geography
- 5.3.1 Asia-Pacific
- 5.3.1.1 China
- 5.3.1.2 India
- 5.3.1.3 Japan
- 5.3.1.4 South Korea
- 5.3.1.5 Australia
- 5.3.1.6 Indonesia
- 5.3.1.7 Vietnam
- 5.3.1.8 Rest of Asia-Pacific
- 5.3.2 North America
- 5.3.2.1 United States
- 5.3.2.2 Canada
- 5.3.2.3 Mexico
- 5.3.3 Europe
- 5.3.3.1 Germany
- 5.3.3.2 France
- 5.3.3.3 United Kingdom
- 5.3.3.4 Italy
- 5.3.3.5 Spain
- 5.3.3.6 Russia
- 5.3.3.7 Rest of Europe
- 5.3.4 South America
- 5.3.4.1 Brazil
- 5.3.4.2 Argentina
- 5.3.4.3 Rest of South America
- 5.3.5 Middle-East and Africa
- 5.3.5.1 Saudi Arabia
- 5.3.5.2 United Arab Emirates
- 5.3.5.3 Rest of Middle-East and Africa
- 5.3.1 Asia-Pacific
6 Competitive Landscape
- 6.1 Market Concentration
- 6.2 Strategic Moves
- 6.3 Market Share (%)/Ranking Analysis
- 6.4 Company Profiles (includes Global level Overview, Market level overview, Core Segments, Financials as available, Strategic Information, Market Rank/Share, Products and Services, Recent Developments)
- 6.4.1 Adani Group
- 6.4.2 BBMG Corporation
- 6.4.3 Boral Limited
- 6.4.4 Buzzi S.p.A
- 6.4.5 CEMEX SAB de CV
- 6.4.6 China National Building Material Group Corporation
- 6.4.7 China West Construction Group
- 6.4.8 CRH
- 6.4.9 Foshan Huijiang Concrete Co., Ltd.
- 6.4.10 Heidelberg Materials
- 6.4.11 Holcim
- 6.4.12 Martin Marietta Materials
- 6.4.13 OYAK Cimento
- 6.4.14 SAMPYO Group
- 6.4.15 Titan Cement
- 6.4.16 UltraTech Cement Ltd.
- 6.4.17 Vicat SA
- 6.4.18 Votorantim Cimentos
7 Market Opportunities and Future Outlook
- 7.1 White-space and Unmet-Need Assessment