|
시장보고서
상품코드
1851699
부유식 해상 풍력발전 시장 : 시장 점유율 분석, 산업 동향, 통계, 성장 예측(2025-2030년)Floating Offshore Wind Power - Market Share Analysis, Industry Trends & Statistics, Growth Forecasts (2025 - 2030) |
||||||
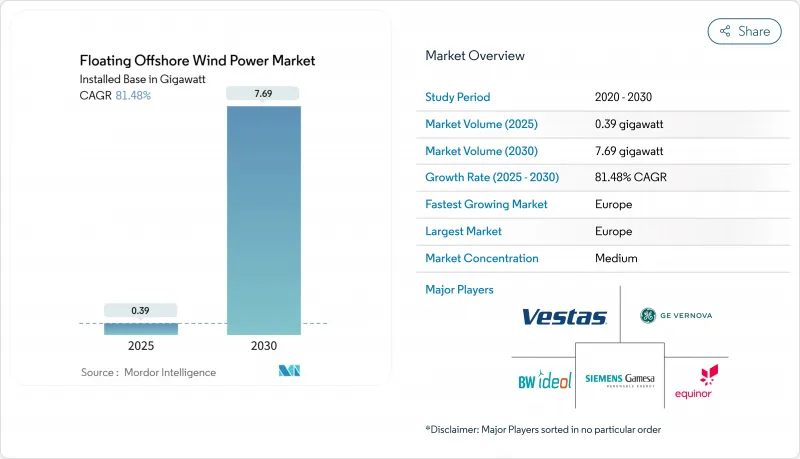
부유식 해상 풍력발전 시장 규모는 2025년 0.39기가와트로 추정되고, 2030년에는 7.69기가와트로 확대될 전망이며, 예측 기간(2025-2030년) CAGR 81.48%로 성장할 것으로 예측됩니다.
이 확대는 세계 해상풍력자원의 80%를 차지하는 수심이 깊은 곳을 이용할 수 있게 된 것을 반영합니다. 한편, 급속한 비용 절감으로 2030년까지 평준화 에너지 비용은 50-100유로/MWh에 달할 것으로 보입니다. 부유식 해상 풍력발전 시장이 상업 단계에 들어가면서 기존의 고정저식 프로젝트를 중심으로 구축된 공급망은 해안에서 조립되어 수심 1,000m를 넘는 심해까지 예견할 수 있는 반잠수식과 수퍼부이식 플랫폼에 대응할 수 있도록 재구축되고 있습니다. 지역 정책도 기세를 늘리고 있습니다. 수익을 안정시키는 유럽의 차금 결제 계약(CfD) 개혁, 미국의 '부유식 해상 풍력발전', 한일의 리스 경매가 자본을 파내고, 멕시코만의 석유 및 가스 플랫폼 전환이 분야 횡단적인 시너지 효과를 부조로 하고 있습니다. 이러한 힘과 잉여 전력을 흡수하는 새로운 수소 코로케이션 스킴이 조합됨으로써, 부유식 해상 풍력발전 시장은 지난 10년에 급증하고 있습니다.
세계의 부유식 해상 풍력발전 시장 동향 및 인사이트
미국 및 APAC의 딥워터존에서 임대 계약 증가
미국 해양 에너지 관리국은 2025년까지 여러 차례 매각을 준비하고, 2035년까지 15GW의 부유식 해상 풍력발전 용량을 목표로 하고 있습니다. 연방 정부의 '부유식 해상 풍력발전 샷'은 이러한 임대와 70%의 비용 절감을 목표로 하는 연구개발을 결합한 것입니다. 아시아태평양에서는 한국의 180만kW 입찰과 일본의 미국 비용 절감 이니셔티브 참여가 양국간 파트너십을 통한 244만kW의 세계 파이프라인 구축을 강조하고 있습니다. 발전 사업자들은 이러한 수주를 실증 발전에서 복수 GW 어레이로의 발판으로 여겨 항만의 개수, 케이블 공장, 설치용 선박에 대한 조기 투자를 촉구하고 있습니다. 따라서 환태평양 전역에서 정책이 계속됨에 따라 부유식 해상 풍력발전 시장이 연간 기가와트 규모 증가에 접근함과 동시에 사업화 가능한 수익원이 확보되게 됩니다.
터빈의 15-20MW급으로의 급속한 사이즈 업에 의한 LCOE 저감
6-10MW를 기준으로 한 터빈을 15-20MW로 함으로써 메가와트당 기초 수가 최대 40% 삭감되어 강재와 계류 사용량이 직접 감소합니다. 스페인의 애틀랜틱 사이트 조사에 따르면 15MW 터빈은 유리한 조건 하에서 LCOE를 100 유로/MWh로 낮출 수 있습니다. 지멘스 가메사와 베스타스와 같은 제조업체들은 선행자 이익을 보장하기 위해 프로토타입 스케줄을 앞두고 있는 반면, 항만 소유자는 120m의 블레이드를 다루기 위해 부두를 길게 하고 크래들 구조를 강화하고 있습니다. 차세대형 WTIV 중 1,200톤을 넘는 나셀을 탑재할 수 있는 것은 단 한 줌으로, 용선료가 급등하기 때문에 개발회사는 수년전의 능력을 확정하지 않을 수 없게 됩니다. 전반적으로, 터빈의 스케일 업은 국가의 비용 절감 목표를 달성하고 부유식 해상 풍력발전 시장의 급성장을 유지하는 데 매우 중요합니다.
WTIV와 FIV의 선박 부족이 일당을 45만 달러 이상으로 촉진
14메가와트 이상의 터빈을 취급할 수 있는 배는 세계에서 10척 밖에 없고, 3열 세미서브머시블의 선체 섹션을 매달 수 있는 배는 더 적습니다. 일당은 이미 45만 달러를 돌파해, 2022년 수준의 약 2배가 되고, 주문북에 의하면, 건조 갭은 2028년까지 계속됩니다. 아시아태평양은 외국 선체를 제한하는 선원 운송 규칙에 따라 추가 장애물에 직면하고 있습니다. 즉, 일본과 한국의 프로젝트는 국내에서 WTIV를 건조하거나 비용이 많이 드는 동원 항해를 흡수해야 한다는 것입니다. 개발자는 현재 전력 구매 계약에 선박 이용 가능 조항을 통합하여 선박 프레임이 확보될 때까지 최종 투자 결정을 지연시켰습니다. 이 병목은 전문 조선소로의 자본 유입이 가속되지 않는 한, 부유식 해상 풍력발전 시장의 근접 설치가 삭감될 위험이 있습니다.
부문 분석
30m-60m의 트랜지셔널 존이 2024년 설치량의 55%를 차지하였고, 부유식 해상 풍력발전 시장 규모는 약 131MW입니다. 이러한 위치에서 고정 바닥 공급망의 일부를 재사용하기 위해 개발자는 계류, SCADA, O&M 전략을 적당한 비용으로 검증할 수 있습니다. 이 부문의 인기는 스코틀랜드의 킨카딘과 프랑스의 지중해 시연 시험에서 분명하며, 2024년 가동률은 모두 92%를 넘어섰습니다. 그러나 수심 60m 이상의 심해 발전은 과도적인 장소에 비해 연간 발전량을 최대 25% 향상시키는 강력한 풍황에 밀려 급속히 규모를 확대하고 있습니다. 터빈 정격 출력이 15MW를 초과하면 수심이 깊어지므로 시각적 반대도 줄어듭니다.
심해 프로젝트는 CAGR 88%로 성장을 지속하고, 2030년까지 부유식 해상 풍력발전 시장 점유율을 40%강까지 끌어올릴 것으로 예측되고 있습니다. 노르웨이의 Utsira-Nord 구역과 캘리포니아의 Morro Bay 구역은 연속적인 1GW 블록이 어레이 레이아웃을 어떻게 간소화하고 공유 수출 코리도를 가능하게 하는지를 보여줍니다. 석유 및 가스 메이저는 해양 리스크를 경감하는 해저의 전문 지식을 제공해, 선급 협회는 25년을 넘는 설계 피로 계수를 성문화하고 있습니다. 얕은 물(30m 미만)의 카테고리는 해저 조건이나 생태적 제약에 의해 고정식 모노파일이 실현 불가능한 연구개발 프로토타입에 한정되어 있습니다. 이윽고 동적 케이블 성능과 부유 구조의 중복성에 대한 신뢰가 높아지고 투자가 100m를 넘는 수심으로 결정적으로 기울어 부유식 해상 풍력발전 산업의 심해 항로가 강화될 것으로 예측됩니다.
WindFloat나 VolturnUS와 같은 모듈식으로 제조할 수 있어 기존의 도크에서 발사할 수 있는 설계에 힘입어 반잠수식 선체가 2024년 부유식 해상 풍력발전 시장에서 57%의 점유율을 차지했습니다. 흡수가 얕기 때문에 대규모 준설을 하지 않고 예항 작업을 실시할 수 있어 조선소에 제약이 있는 국가에게 있어서 중요한 이점이 됩니다. 계류 스프레드는 표준 체인과 폴리 에스테르 로프를 사용하여 맞춤형 하드웨어를 최소화합니다. 이 접근법은 5° 이하의 피치 모션에서 안정성을 보장하고 드라이브 트레인의 부하가 6-10MW 터빈의 보증 범위 내에 들어갈 수 있도록 합니다. 개발자는 노르웨이 피요르드에서 카나리아 제도에 이르기까지 전개 가능한 플랫폼의 적응성을 높이 평가합니다.
2024년 발전 용량의 31%를 차지한 Sperbuy 컨셉은 세미서브에 비해 MW당 재료 사용량이 최대 15% 감소하기 때문에 84%의 연평균 복합 성장률(CAGR) 궤도를 그립니다. 하이윈드 탐펜 길이 107m의 기둥은 북해의 스콜 하에서 97%의 가동률을 확인했습니다. 향후 개량형에서는 제작 공수를 삭감하는 슬립 포밍 기술이 계획되어 있어 콘크리트와 스틸의 하이브리드 스파는 추가 설비 투자 삭감을 약속합니다. 텐션 레그 플랫폼은 180m에 육박하는 터빈 나셀의 높이에 매력적인 히브 억제 특성을 제공하지만 앵커 파일의 정밀도가 비용을 상승시킵니다. 바지와 하이브리드의 형태는 여전히 틈새 시장이지만, 일본의 3MW 히키나다 발전소는 평화로운 해역에서 낮은 프리 보드 선체를 어떻게 받아들일 수 있는지 보여줍니다. 현재, 부유식 해상 풍력발전 시장 리스크를 평가하는 금융 기관에 있어서, 세미 서브가 참고 설계가 되고 있지만, 대량 생산에 의해 가장 융자하기 쉬운 선택 사항이 명확해질 때까지, 선체 유형 간의 경쟁은 계속될 것으로 예측됩니다.
부유식 해상 풍력발전 시장 보고서는 수심별(얕은 물, 과도기, 심해), 부유식 플랫폼 유형별(세미서브, 수퍼부이, 기타), 터빈 용량별(5MW 미만, 5-10MW, 기타), 프랙션 스테이지별(프리 상업 파일럿, 상업 유틸리티 스케일, 하이브리드 Wind-To-X), 지역별(북미, 유럽, 아시아태평양, 남미, 중동 및 아프리카)로 분류됩니다.
지역별 분석
유럽은 2024년 부유식 해상 풍력발전 시장 규모가 220MW에 육박했으며, 세계 전개의 92%라는 압도적인 점유율을 유지했습니다. 노르웨이, 스코틀랜드, 포르투갈의 성숙한 엔지니어링 클러스터가 이 리드를 지원하는 반면, 영국의 50GW 해상 풍력발전의 야망은 2030년까지 그 중 5GW를 부유식으로 할 필요가 있어 전도의 파이프라인을 지원하고 있습니다. 1억 6,000만 파운드의 부유식 해상 풍력 제조 투자 계획과 같은 국가의 보조금은 블레이드, 타워 및 계류 플랜트에 설비 투자를 유도하고 납기를 단축하고 있습니다. 노르웨이의 하이윈드 탐펜은 이미 석유 플랫폼의 전기화에 의해 CO2 삭감을 구체적으로 시연하고 있으며, 정부와 국민의 찬동을 확고히 하고 있습니다. 프랑스는 포스 쉬르메르와 포르토 라 누벨에 위치한 현지 제조 야드를 우대하는 지중해 입찰로 추종하여 지역 산업 실적를 확대하고 있습니다.
아시아태평양은 섬나라가 대륙붕 폭이 최소인 수심이 깊은 곳을 찾고 있기 때문에 CAGR 156%로 성장을 지속하고, 가장 급성장하고 있는 지역입니다. 일본의 2030년도까지 570만kW, 2040년도까지 4500만kW라는 목표는 부유식 기초에 크게 의존하고 있습니다. 해저 조사에서는 풍속 10m/s 이상의 이론상 자원이 424만kW인 것이 확인되고 있습니다. 한국의 울산 인근에서 180만kW의 조달 라운드는 체인, 석션 앵커, 중량물 운반선을 포함한 특수 공급 기반에 불을 붙일 것을 약속합니다. 대만은 타이중항 자유무역구 내의 세제우대조치를 활용하여 블레이드와 나셀의 비중국 대체품으로 자국을 자리잡고 있습니다. 중국 자체는 고정식 저면 풍력발전을 지배하고 있지만 광동성에서 절강성에 이르는 지방 당국은 해안의 부하센터를 다양화하기 위해 수심 80m를 넘는 부유식 풍력발전 코리도의 카탈로그를 작성하고 있습니다.
북미에서는 바이덴 해리스 정권이 30GW의 해상 풍력과 15GW의 부유식 풍력을 목표로 내걸고 있습니다. 캘리포니아의 몰로베이와 훔볼트의 두 가지 리스존에는 550만 가구분의 전력을 공급할 수 있는 용량이 있지만, 북대서양 세미 고래를 위한 멸종위기종 보호법에 의해 태평양 연안의 넓은 범위에서의 허가 사이클이 길어졌습니다. 멕시코만의 온화한 해황과 밀집한 브라운필드 인프라는 석유 메이저가 잭업 리그를 임시 용접 스테이션으로 재사용하고 있기 때문에 매력적인 조기 진입 후보지가 되고 있습니다. 캐나다는 이 분야의 진출을 감시하면서도 국가 할당량을 결정하기 전에 터빈의 착빙 조사를 기다리고 있습니다. 한편, 멕시코는 바하반도에서 부유식 풍력발전과 기존의 가스 봉우리 피에이커를 결합하기 위한 정책적 인센티브를 모색하고 있습니다. 2027년 이후 부유식 해상 풍력발전 시장은 크게 확대될 예정입니다.
기타 혜택 :
- 엑셀 형식 시장 예측(ME) 시트
- 3개월간의 애널리스트 서포트
목차
제1장 서론
- 조사의 전제조건 및 시장 정의
- 조사 범위
제2장 조사 방법
제3장 주요 요약
제4장 시장 상황
- 시장 개요
- 시장 성장 촉진요인
- 미국과 APAC의 심해광구에서 리스 계약 증가
- 터빈의 15-20MW급으로의 급속한 대형화로 LCOE 저감
- 석유 및 가스 플랫폼의 전환이 멕시코만 공급망 해방
- EU와 영국의 CfD 개혁이 벵커빌리티 상승
- 코로케이션 수요를 창출하는 국가 수소 로드맵
- 아시아의 케이블선 건조가 설치 스케줄 단축
- 시장 성장 억제요인
- WTIV와 FIV의 선박 부족이 일당 45만 달러 이상을 견인
- 수심 50-100m 파일럿에서 고전압 다이나믹 케이블의 결함
- 캘리포니아의 ESA(환경보호국) 라이트 웨일의 제약이 BOEM 허가 지연 초래
- 스폿 강재 가격의 난고하(1톤당 950달러 미만)가 플로터 야드 혼란 초래
- 공급망 분석
- 규제 및 기술적 전망
- 주요 프로젝트 정보
- 주요 기존 프로젝트
- 향후 프로젝트
- 최근 동향
- Porter's Five Forces
- 공급기업의 협상력
- 구매자의 협상력
- 신규 참가업체의 위협
- 대체품의 위협
- 경쟁 기업 간 경쟁 관계
- 투자 분석
제5장 시장 규모 및 성장 예측
- 수심별
- 얕은 물(30m 이하)
- 과도기(30-60m)
- 심해(60m 이상)
- 부유식 플랫폼 유형별
- 세미 서브 머시블
- 수퍼부이
- 텐션 레그 플랫폼(TLP)
- 바지선 및 하이브리드의 개념
- 터빈 용량 정격별
- 5MW 미만
- 5-10 MW
- 11-15 MW
- 15MW 이상
- 용도 스테이지별
- 프리커머셜 파일럿
- 상용 유틸리티 스케일
- 하이브리드 풍력 발전(수소, 해수 담수화)
- 지역별
- 북미
- 미국
- 기타 북미
- 유럽
- 프랑스
- 영국
- 스페인
- 북유럽 국가
- 이탈리아
- 기타 유럽
- 아시아태평양
- 중국
- 일본
- 한국
- 기타 아시아태평양
- 남미
- 브라질
- 아르헨티나
- 기타 남미
- 중동 및 아프리카
- 아랍에미리트(UAE)
- 사우디아라비아
- 남아프리카
- 기타 중동 및 아프리카
- 북미
제6장 경쟁 구도
- 시장 집중도
- 전략적 움직임(M&A, 파트너십, PPA)
- 시장 점유율 분석(주요 기업의 시장 순위 및 점유율)
- 기업 프로파일
- Siemens Gamesa Renewable Energy SA
- Vestas Wind Systems A/S
- GE Vernova(GE Renewable Energy)
- BW Ideol AS
- Equinor ASA
- Orsted A/S
- Principle Power Inc.
- Aker Solutions ASA
- Hexicon AB
- TotalEnergies SE
- Shell plc
- Ocean Winds(EDPR/ENGIE)
- Copenhagen Infrastructure Partners
- RWE AG
- Marubeni Corporation
- MingYang Smart Energy
- Goldwind Science & Technology
- Gazelle Wind Power Ltd.
제7장 시장 기회 및 향후 전망
AJY 25.11.24The Floating Offshore Wind Power Market size in terms of installed base is expected to grow from 0.39 gigawatt in 2025 to 7.69 gigawatt by 2030, at a CAGR of 81.48% during the forecast period (2025-2030).

This expansion reflects the sector's ability to tap deeper-water sites that hold 80% of global offshore wind resources, while rapid cost compression is pushing the Levelized Cost of Energy toward €50-100/MWh by 2030 . As the floating offshore wind market enters a commercial phase, supply chains built around conventional fixed-bottom projects are being re-tooled to handle Semi-Submersible and Spar-Buoy platforms that can be assembled quayside and towed to depths exceeding 1,000 m. Developers are also pivoting to turbines above 15 MW to spread foundation and installation costs over larger generation envelopes. Regional policy adds momentum: Europe's revenue-stabilizing Contracts for Difference (CfD) reforms, the United States' "Floating Offshore Wind Shot," and Japan-Korea lease auctions are unlocking capital, while oil-and-gas platform conversions in the Gulf of Mexico highlight cross-sector synergies. These forces, combined with emerging hydrogen co-location schemes that soak up surplus power, position the floating offshore wind market for steep scale-up this decade.
Global Floating Offshore Wind Power Market Trends and Insights
Growing Lease Awards in U.S. & APAC Deep-Water Zones
A surge of deep-water lease auctions is reshaping the floating offshore wind market, with the U.S. Bureau of Ocean Energy Management preparing multiple sales through 2025 and targeting 15 GW of floating capacity by 2035. The federal "Floating Offshore Wind Shot" couples these leases with R&D aimed at 70% cost cuts. In Asia-Pacific, South Korea's 1.8 GW tender and Japan's entry into the U.S. cost-reduction initiative underscore how bilateral partnerships are building a 244 GW global pipeline. Developers see these awards as stepping-stones from demonstration to multi-GW arrays, prompting early investments in port upgrades, cable factories, and installation vessels. Therefore, policy continuity across the Pacific Rim is locking in bankable revenue streams while pushing the floating offshore wind market closer to gigawatt-scale annual additions.
Rapid Turbine Upsizing to 15-20 MW Class Reducing LCOE
Moving from a 6-10 MW baseline to 15-20 MW turbines cuts per-megawatt foundation counts by up to 40%, directly lowering steel and mooring use. Research on Spanish Atlantic sites finds that 15 MW machines can drive LCOE to 100 €/MWh in favorable conditions. Manufacturers such as Siemens Gamesa and Vestas have accelerated prototyping schedules to secure early-mover advantage, while port owners lengthen quays and reinforce cradle structures to handle 120-m blades. The upsizing wave also reshuffles vessel demand: only a handful of next-generation WTIVs can install nacelles weighing over 1,200 t, creating new charter-rate spikes that force developers to lock in capacity years ahead. Overall, turbine scale-up is pivotal to meeting national cost-reduction targets and sustaining the blistering growth of the floating offshore wind market.
WTIV & FIV Vessel Shortage Driving Day Rates Above USD 450k
Only 10 vessels worldwide can handle turbines above 14 MW, and fewer still can lift 3-column Semi-Submersible hull sections. Day rates have already breached USD 450,000, about double 2022 levels, and order books show a construction gap extending into 2028. Asia-Pacific faces extra hurdles from cabotage rules restricting foreign hulls, meaning Japanese and Korean projects must either build domestic WTIVs or absorb costly mobilization voyages. Developers now embed vessel-availability clauses into Power Purchase Agreements, delaying Final Investment Decisions until tonnage slots are secured. This bottleneck risks trimming close-in floating offshore wind market installations unless capital flows into specialized shipyards accelerate.
Other drivers and restraints analyzed in the detailed report include:
- Oil & Gas Platform Conversions Unlocking Gulf of Mexico Supply Chain
- EU & UK CfD Reform Boosting Bankability
- High-Voltage Dynamic Cable Failures in 50-100 m Depth Pilots
For complete list of drivers and restraints, kindly check the Table Of Contents.
Segment Analysis
Transitional zones between 30 m and 60 m accounted for 55% of 2024 installations, equating to a floating offshore wind market size of roughly 131 MW. These locations reuse portions of fixed-bottom supply chains, allowing developers to validate moorings, SCADA, and O&M strategies at modest cost. The segment's popularity is evident in Scotland's Kincardine and France's Mediterranean demonstrators, which collectively logged availability above 92% in 2024. Yet the deep-water segment (above 60 m) is scaling fast, lifted by stronger wind profiles that raise annual energy output by up to 25 % versus transitional sites. As turbine ratings pass 15 MW, deeper waters also reduce visual-impact opposition, a factor especially potent in tourism-heavy coastlines.
Deep-water projects are forecast to post an 88% CAGR, lifting their floating offshore wind market share to just over 40% by 2030. Norway's Utsira-Nord and California's Morro Bay zones illustrate how contiguous 1-GW blocks streamline array layouts and enable shared export corridors. Oil-and-gas majors bring subsea expertise that mitigates met-ocean risks, while classification societies have codified design fatigue factors exceeding 25 years. The shallow (<30 m) category remains confined to R&D prototypes where seabed conditions or ecological constraints make fixed monopiles unviable. Over time, increasing confidence in dynamic cable performance and floater structural redundancy is expected to tilt investment decisively toward water depths beyond 100 m, reinforcing the deep-water pathway for the floating offshore wind industry.
Semi-Submersible hulls dominated with 57% share of the floating offshore wind market in 2024, buoyed by designs such as WindFloat and VolturnUS that can be fabricated in modular sections and launched via existing docks. Their shallow draft facilitates tow-out operations without extensive dredging, a key advantage for shipyard-constrained nations. Mooring spreads use standard chain and polyester rope, minimizing bespoke hardware. The approach reliably delivers stability with pitch motions below 5°, ensuring drivetrain loads stay within warranty envelopes for 6-10 MW turbines. Developers value the platform's adaptability, enabling deployment from Norwegian fjords to the Canary Islands.
Spar-Buoy concepts, although accounting for 31% of 2024 capacity, are on an 84% CAGR trajectory as material usage per MW drops by up to 15% compared with Semi-Subs. Hywind Tampen's 107-m-long columns verified operational uptimes of 97% under North Sea squalls. Future variants plan slip-forming techniques that lower fabrication man-hours, while hybrid concrete-steel spars promise further capex savings. Tension-Leg Platforms offer heave suppression traits attractive for turbine nacelle heights approaching 180 m, but anchor-pile precision raises costs. Barge and hybrid formats remain niche, yet Japan's 3 MW Hibiki-nada plant shows how calm-sea locales can host low-freeboard hulls. Competition among hull types will continue until mass production clarifies the most bankable option, though Semi-Subs currently act as the reference design for lenders appraising floating offshore wind market risk.
The Floating Offshore Wind Market Report is Segmented by Water Depth (Shallow, Transitional and Deep), Floating Platform Type (Semi-Submersible, Spar-Buoy, and Others), Turbine Capacity Rating (Below 5 MW, 5 To 10 MW, and Others), Application Stage (Pre-Commercial Pilot, Commercial Utility-Scale, and Hybrid Wind-To-X), and by Geography (North America, Europe, Asia-Pacific, South America, and Middle East and Africa).
Geography Analysis
Europe maintained a commanding 92% share of global deployments in 2024, with a floating offshore wind market size close to 220 MW. Mature engineering clusters in Norway, Scotland, and Portugal underpin this lead, while the UK's 50 GW total offshore wind ambition-5 GW of which must be floating by 2030-anchors forward pipelines. State-backed grants like the GBP 160 million Floating Offshore Wind Manufacturing Investment Scheme funnel capex toward blade, tower, and mooring plants, shortening delivery times. Norway's Hywind Tampen has already demonstrated concrete CO2 savings by electrifying petroleum platforms, solidifying government and public buy-in. France is following with Mediterranean tenders that favor local fabrication yards in Fos-sur-Mer and Port-la-Nouvelle, expanding regional industrial footprints.
Asia-Pacific is the fastest-growing theatre, registering a 156% CAGR as island nations seek deeper-water options where continental shelf widths are minimal. Japan's target of 5.7 GW by fiscal 2030 and 45 GW by 2040 relies heavily on floating foundations; its seabed surveys identify 424 GW of theoretical resource above 10 m/s wind speeds. South Korea's 1.8 GW procurement round near Ulsan promises to ignite a specialized supply base encompassing chains, suction anchors, and heavy-lift barges. Taiwan positions itself as a non-China alternative for blades and nacelles, leveraging tax incentives inside its Port of Taichung free-trade zone. China itself dominates fixed-bottom additions, but provincial authorities from Guangdong to Zhejiang are cataloguing floating wind corridors exceeding 80 m depths to diversify coastal load centers.
North America ramps up under the Biden-Harris Administration's 30 GW offshore wind and 15 GW floating targets. California's twin lease zones at Morro Bay and Humboldt could host enough capacity to power 5.5 million households, but Endangered Species Act safeguards for the North Atlantic right whale prolong permitting cycles along the broader Pacific Coast. The Gulf of Mexico's milder sea states and dense brownfield infrastructure make it an attractive early-mover candidate, with oil majors repurposing jack-up rigs as temporary welding stations. Canada monitors the sector's advance yet waits for turbine icing studies before setting national quotas, while Mexico explores policy incentives to couple floating wind with existing gas-fired peakers on the Baja Peninsula. Collectively, North American projects account for more than 40 GW of auctioned potential, a base that will materially widen the floating offshore wind market after 2027.
- Siemens Gamesa Renewable Energy SA
- Vestas Wind Systems A/S
- GE Vernova (GE Renewable Energy)
- BW Ideol AS
- Equinor ASA
- Orsted A/S
- Principle Power Inc.
- Aker Solutions ASA
- Hexicon AB
- TotalEnergies SE
- Shell plc
- Ocean Winds (EDPR/ENGIE)
- Copenhagen Infrastructure Partners
- RWE AG
- Marubeni Corporation
- MingYang Smart Energy
- Goldwind Science & Technology
- Gazelle Wind Power Ltd.
Additional Benefits:
- The market estimate (ME) sheet in Excel format
- 3 months of analyst support
TABLE OF CONTENTS
1 Introduction
- 1.1 Study Assumptions & Market Definition
- 1.2 Scope of the Study
2 Research Methodology
3 Executive Summary
4 Market Landscape
- 4.1 Market Overview
- 4.2 Market Drivers
- 4.2.1 Growing Lease Awards in U.S. & APAC Deep-Water Zones
- 4.2.2 Rapid Turbine Upsizing to 15-20 MW Class Reducing LCOE
- 4.2.3 Oil & Gas Platform Conversions Unlocking Gulf of Mexico Supply Chain
- 4.2.4 EU & UK CfD Reform Boosting Bankability
- 4.2.5 National Hydrogen Roadmaps Creating Co-location Demand
- 4.2.6 Asian Cable-Vessel Build-out Shortening Installation Schedules
- 4.3 Market Restraints
- 4.3.1 WTIV & FIV Vessel Shortage Driving Day-rates > US$450k
- 4.3.2 High-Voltage Dynamic Cable Failures in 50-100 m Depth Pilots
- 4.3.3 California ESA Right-Whale Constraints Slowing BOEM Permits
- 4.3.4 Spot Steel Price Volatility (> US$950/t) Disrupting Floater Yards
- 4.4 Supply-Chain Analysis
- 4.5 Regulatory & Technological Outlook
- 4.6 Key Projects Information
- 4.6.1 Major Existing Projects
- 4.6.2 Upcoming Projects
- 4.7 Recent Trends & Developments
- 4.8 Porter's Five Forces
- 4.8.1 Bargaining Power of Suppliers
- 4.8.2 Bargaining Power of Buyers
- 4.8.3 Threat of New Entrants
- 4.8.4 Threat of Substitutes
- 4.8.5 Competitive Rivalry
- 4.9 Investment Analysis
5 Market Size & Growth Forecasts
- 5.1 By Water Depth
- 5.1.1 Shallow (Below 30 m)
- 5.1.2 Transitional (30 to 60 m)
- 5.1.3 Deep (Above 60 m)
- 5.2 By Floating Platform Type
- 5.2.1 Semi-Submersible
- 5.2.2 Spar-Buoy
- 5.2.3 Tension-Leg Platform (TLP)
- 5.2.4 Barge and Hybrid Concepts
- 5.3 By Turbine Capacity Rating
- 5.3.1 Below 5 MW
- 5.3.2 5 to 10 MW
- 5.3.3 11 to 15 MW
- 5.3.4 Above 15 MW
- 5.4 By Application Stage
- 5.4.1 Pre-Commercial Pilot
- 5.4.2 Commercial Utility-Scale
- 5.4.3 Hybrid Wind-to-X (Hydrogen, Desalination)
- 5.5 By Geography
- 5.5.1 North America
- 5.5.1.1 United States
- 5.5.1.2 Rest of North America
- 5.5.2 Europe
- 5.5.2.1 France
- 5.5.2.2 United Kingdom
- 5.5.2.3 Spain
- 5.5.2.4 Nordic Countries
- 5.5.2.5 Italy
- 5.5.2.6 Rest of Europe
- 5.5.3 Asia-Pacific
- 5.5.3.1 China
- 5.5.3.2 Japan
- 5.5.3.3 South Korea
- 5.5.3.4 Rest of Asia-Pacific
- 5.5.4 South America
- 5.5.4.1 Brazil
- 5.5.4.2 Argentina
- 5.5.4.3 Rest of South America
- 5.5.5 Middle East and Africa
- 5.5.5.1 United Arab Emirates
- 5.5.5.2 Saudi Arabia
- 5.5.5.3 South Africa
- 5.5.5.4 Rest of Middle East and Africa
- 5.5.1 North America
6 Competitive Landscape
- 6.1 Market Concentration
- 6.2 Strategic Moves (M&A, Partnerships, PPAs)
- 6.3 Market Share Analysis (Market Rank/Share for key companies)
- 6.4 Company Profiles (includes Global level Overview, Market level overview, Core Segments, Financials as available, Strategic Information, Products & Services, and Recent Developments)
- 6.4.1 Siemens Gamesa Renewable Energy SA
- 6.4.2 Vestas Wind Systems A/S
- 6.4.3 GE Vernova (GE Renewable Energy)
- 6.4.4 BW Ideol AS
- 6.4.5 Equinor ASA
- 6.4.6 Orsted A/S
- 6.4.7 Principle Power Inc.
- 6.4.8 Aker Solutions ASA
- 6.4.9 Hexicon AB
- 6.4.10 TotalEnergies SE
- 6.4.11 Shell plc
- 6.4.12 Ocean Winds (EDPR/ENGIE)
- 6.4.13 Copenhagen Infrastructure Partners
- 6.4.14 RWE AG
- 6.4.15 Marubeni Corporation
- 6.4.16 MingYang Smart Energy
- 6.4.17 Goldwind Science & Technology
- 6.4.18 Gazelle Wind Power Ltd.
7 Market Opportunities & Future Outlook
- 7.1 White-space & Unmet-Need Assessment