


|
시장보고서
상품코드
1687903
인도의 건설용 화학제품 시장 : 시장 점유율 분석, 산업 동향 및 통계, 성장 예측(2025-2030년)India Construction Chemicals - Market Share Analysis, Industry Trends & Statistics, Growth Forecasts (2025 - 2030) |
||||||
■ 보고서에 따라 최신 정보로 업데이트하여 보내드립니다. 배송일정은 문의해 주시기 바랍니다.
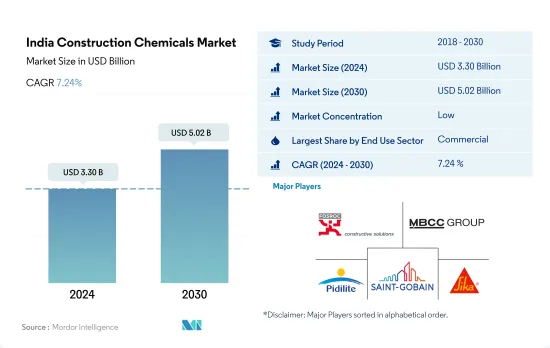
인도의 건설용 화학제품 시장 규모는 2024년에 33억 달러로 추정되고, 2030년에는 50억 2,000만 달러에 이를 것으로 예측되며, 예측 기간(2024-2030년) 중 CAGR 7.24%로 성장할 전망입니다.
상업 및 주택 부문이 인도의 건설용 화학제품 시장 성장 견인
- 인도의 건설용 화학제품 시장은 수익성으로는 세계 3위, 성장률에서는 1위입니다. 2022년에는 여러 부문에 걸친 건설 활동과 지출 증가로 시장 규모가 6.97% 급증했습니다. 2023년에도 탄탄한 부동산과 인프라 개발로 시장은 6.9% 증가하며 상승세를 유지한 것으로 평가되었습니다.
- 정부기관이든 민간단체이든 그 자금원인 상업 분야가 건설용 화학제품 수요를 지배하고 있습니다. 이러한 자금적인 뒷받침에 의해 주택이나 기타 건물 타입에 비해 상업 프로젝트에서는 건설용 화학제품에 대한 투자가 보다 친숙해지고 있습니다. 또한 고밀도이고 복잡한 설계로 알려진 상업용 건물에서는 보다 폭넓은 종류의 건설용 화학제품이 필요합니다.
- 주택 부문은 건설용 화학제품에 있어서 두 번째로 유리한 부문으로서, 소량의 차이로 계속되고 있습니다. 인도가 세계에서 가장 인구가 많은 나라인 것은 상당수의 주택을 건설하는 것으로 이어져 수요와 시장 규모를 끌어올리고 있습니다. 게다가 방수 솔루션에 대한 일관된 수요가 이 부문의 중요성을 더욱 높이고 있습니다.
- 주택 및 상업 분야 시장 규모는 다른 분야와 동등하고 그 이상의 속도로 상승할 것으로 추정되며, 시장 추정 및 예측 기간인 2023-2030년 CAGR 7.9%와 7.4%를 기록할 전망입니다. 이러한 성장률은, 주택 건설 촉진 등의 정부의 대처 및 국내외로부터의 투자를 유치하는 비즈니스 친화적인 환경이 뒷받침하고 있다고 추정됩니다.
인도의 건설용 화학제품 시장 동향
인도의 A등급 오피스 시장은 2030년까지 12억 평방 피트에 이를 것으로 예상되며 상업 건축 부문 수요를 견인할 것으로 보입니다.
- 2022년 인도의 신규 상업 바닥 면적은 2021년 대비 6.2%의 성장을 보였습니다. 소매 분야, 특히 상위 7개 도시(델리NCR, 방갈로르, 하이데라바드, 뭄바이, 푸네, 첸나이, 콜카타)에서는 왕성한 수요가 나타나 몰 면적은 260만 평방 피트를 넘어 2021년부터 27% 증가했습니다. 2023년에는, 외국 직접 투자(FDI)의 급증이 새로운 오피스, 소매점, 기타 시설의 필요성을 부추겨, 이 분야 신규 바닥 면적은 3,800만 평방 피트 급증한 것으로 평가되었습니다. 특히, 2023년 건설 개발에 대한 FDI 자본 유입액은 9,600만 달러에 달한 것으로 평가되었습니다.
- 2020년 인도 상업 시설의 신규 바닥 면적은 2019년 대비 68.3% 감소했습니다. 이러한 감소는 주로 정부에 의한 전국적인 봉쇄로 인해 진행 중인 프로젝트가 중단되고 공급망이 긴장하여 노동력 확보에 영향을 주었습니다. 그러나 2021년 규제가 완화되자 신규 바닥 면적이 약 5억 2,600만 제곱피트 급증해 큰 폭의 회복을 보였습니다. 게다가 2021년에는 그린 빌딩에 대한 대처가 현저하게 증가해, 상업 프로젝트의 약 55%가 지속 가능성을 도입해, 이 분야 수요를 한층 더 끌어올렸습니다.
- 2030년을 전망하면 인도 상업 시설의 신규 바닥 면적은 3억 5,800만 평방 피트에 달할 것으로 예측되며, 2023년부터 크게 급증합니다. 이 급증으로 쇼핑몰, 사무실 공간 및 기타 상업 시설에 대한 수요가 높아지고 있습니다. 예를 들어 상위 7개 도시의 인도의 A등급 오피스 시장은 2026년까지 10억 평방 피트로 확대되고 2030년까지 12억 평방 피트로 확대될 전망입니다. 그 결과, 이 나라 상업 시설의 신규 바닥 면적은, 예측 기간 중 CAGR 5.26%라고 하는 견조한 성장을 기록할 전망입니다.
주택 수요 증가와 부동산 부문 확대로 주택 부문 수요 증가
- 2022년, 인도의 주택 바닥 면적은 전년을 웃도는 9.4%의 성장을 나타냈습니다. 국내 주택 수요는 급증해 상위 7개 도시(델리NCR, 방갈로르, 하이데라바드, 뭄바이, 푸네, 첸나이, 콜카타)의 합계로 약 40만 2,000호가 새롭게 건설되어 2021년부터 44% 증가했습니다. 2023년 1분기에는 이들 도시의 주택 판매 호수가 11.4만 호에 달했고, 전년보다 9.95만 호 이상 급증했습니다. 그 결과, 인도의 주택 신규 바닥 면적은 2023년에는 2022년 대비 약 7,100만 평방 피트 확대된 것으로 평가되었습니다.
- 2020년 인도의 주택 부문은 후퇴에 직면해 신규 바닥 면적은 전년 대비 6.25% 감소했습니다. 이러한 감소는 전국적인 봉쇄, 공급망의 혼란, 노동력 부족, 건설 생산성 저하, 외국 투자의 침체가 원인입니다. 그러나 2021년에는 인도 주택 부동산 시장이 회복되어 상위 7개 도시에서 약 16만 3,000호의 신축 주택이 증가했습니다. 이 급증으로 2021년 주택 분야의 신규 바닥 면적은 2020년 대비 약 6억 4,900만 평방 피트로 대폭 증가했습니다.
- 향후 인도의 주택 분야는 2023-2030년 수량 기준으로 CAGR 2.95%를 보여줄 전망입니다. 이 성장은 지속적인 주택 수요, 투자 증가, 유리한 정부 시책 때문입니다. 특히, 2030년까지 인도 인구의 40% 이상이 도시 지역에 거주하게 되어 저렴한 주택이 약 2,500만 호 추가로 수요가 증가할 것으로 예측되고 있습니다. 게다가 2030년까지 주택 부동산 시장은 주요 도시에서 150만 호에 이를 것으로 예상되고 있어 이 분야의 수요를 더욱 촉진하고 있습니다.
인도의 건설용 화학제품 산업 개요
인도의 건설용 화학제품 시장은 세분화되어 있으며 상위 5개사에서 18.71%를 차지하고 있습니다. 이 시장의 주요 기업은 다음과 같습니다. Fosroc, Inc., MBCC Group, Pidilite Industries Ltd., Saint-Gobain and Sika AG
기타 혜택
- 엑셀 형식 시장 예측(ME) 시트
- 3개월의 애널리스트 서포트
목차
제1장 주요 요약 및 주요 조사 결과
제2장 보고서 제안
제3장 서문
- 조사의 전제조건 및 시장 정의
- 조사 범위
- 조사 방법
제4장 주요 산업 동향
- 최종 용도 부문의 동향
- 상업
- 산업 및 시설
- 인프라
- 주택용
- 주요 인프라 프로젝트(현재로 발표됨)
- 규제 프레임워크
- 밸류체인 및 유통채널 분석
제5장 시장 세분화
- 최종 용도 부문별
- 상업
- 산업 및 시설
- 인프라
- 주택용
- 제품별
- 접착제
- 서브 제품별
- 핫멜트
- 반응성
- 용제계
- 수성
- 앵커와 그라우트
- 서브 제품별
- 시멘트계 고정재
- 수지 고정
- 기타
- 콘크리트 혼화제
- 서브 제품별
- 촉진제
- 공기혼입혼화제
- 고범위 감수제(초가소제)
- 지연제
- 수축 저감 혼화제
- 점도 조정제
- 감수제(가소제)
- 기타
- 콘크리트 보호 페인트
- 서브 제품별
- 아크릴계
- 알키드
- 에폭시
- 폴리우레탄
- 기타
- 바닥재용 수지
- 서브 제품별
- 아크릴
- 에폭시
- 폴리아스파라긴
- 폴리우레탄
- 기타
- 보수 및 재생 화학제품
- 서브 제품별
- 섬유 포장 시스템
- 주입 그라우트재
- 마이크로 콘크리트 모르타르
- 개질 모르타르
- 철근보호재
- 실링재
- 서브 제품별
- 아크릴
- 에폭시
- 폴리우레탄
- 실리콘
- 기타
- 표면 처리 약품
- 서브 제품별
- 경화 컴파운드
- 이형제
- 기타
- 방수 솔루션
- 서브 제품별
- 화학제품
- 멤브레인
- 접착제
제6장 경쟁 구도
- 주요 전략 동향
- 시장 점유율 분석
- 기업 상황
- 기업 프로파일
- Ardex Group
- Don Construction Products Ltd.
- ECMAS Group
- Fosroc, Inc.
- MAPEI SpA
- MBCC Group
- Pidilite Industries Ltd.
- Saint-Gobain
- Sika AG
- Thermax Limited
제7장 CEO에 대한 주요 전략적 질문
제8장 부록
- 세계 개요
- 개요
- Porter's Five Forces 분석 프레임워크(산업 매력도 분석)
- 세계의 밸류체인 분석
- 시장 역학(DROs)
- 정보원 및 참고문헌
- 도표 일람
- 주요 인사이트
- 데이터 팩
- 용어집
The India Construction Chemicals Market size is estimated at 3.30 billion USD in 2024, and is expected to reach 5.02 billion USD by 2030, growing at a CAGR of 7.24% during the forecast period (2024-2030).

The commercial and residential sectors are leading the growth of the construction chemicals market in India
- India's construction chemicals market ranks third globally in profitability and is the leader in terms of growth. In 2022, the market surged by 6.97% in value, driven by increased construction activity and spending across several sectors. The market was projected to maintain its upward trajectory in 2023, with a 6.9% increase owing to robust real estate and infrastructure developments.
- The commercial sector dominates the demand for construction chemicals, given its funding sources, be it government or private entities. This financial backing makes investing in construction chemicals more accessible in commercial projects compared to residential or other building types. Moreover, commercial buildings, known for their higher densities and intricate designs, necessitate a wider range of construction chemicals.
- The residential sector follows closely as the second most lucrative sector for construction chemicals. India's status as the world's most populous nation translates into a significant number of residential buildings, driving up demand and market value. Additionally, the sector's consistent demand for waterproofing solutions further bolsters its significance.
- The market's value in the residential and commercial sectors is estimated to rise at similar and faster rates than the rest, recording CAGRs of 7.9% and 7.4% during the forecast period (2023-2030). These growth rates are estimated to be propelled by government initiatives, such as housing unit construction drives, and a business-friendly environment attracting both domestic and foreign investments.
India Construction Chemicals Market Trends
India's Grade A office market is expected to reach 1.2 billion sq. ft by 2030 and is likely to drive the demand for the commercial construction sector
- In 2022, India's new commercial floor area saw a 6.2% volume growth compared to 2021. The retail sector, particularly in the top seven cities (Delhi NCR, Bangalore, Hyderabad, Mumbai, Pune, Chennai, and Kolkata), witnessed robust demand, adding over 2.6 million sq. ft of mall space, a 27% increase from 2021. Looking ahead to 2023, the sector's new floor area is expected to surge by 38 million sq. ft, driven by a surge in foreign direct investment (FDI) fueling the need for new offices, retail outlets, and other facilities. Notably, the FDI equity inflow for construction development in 2023 was projected to hit USD 96 million.
- In 2020, India's commercial new floor area plummeted by 68.3% in volume compared to 2019. This decline was primarily due to a nationwide lockdown imposed by the government, which disrupted ongoing projects, strained supply chains, and impacted labor availability. However, as restrictions eased in 2021, the country witnessed a significant rebound, with the new floor area surging by approximately 526 million sq. ft. Additionally, 2021 saw a notable uptick in green building initiatives, with around 55% of commercial projects embracing sustainability, further bolstering the demand for the sector.
- Looking ahead to 2030, India's commercial new floor area is projected to hit 358 million sq. ft, a significant jump from 2023. This surge drives a growing appetite for shopping malls, office spaces, and other commercial facilities. For instance, India's Grade A office market in the top seven cities is set to expand to 1 billion sq. ft by 2026 and further to 1.2 billion sq. ft by 2030. Consequently, the country's commercial new floor area is poised to witness a robust CAGR of 5.26% during the forecast period.
Rise in demand for housing units and increasing real estate sector to boost residential sector demand
- In 2022, India witnessed a 9.4% growth in residential floor area, outpacing the previous year. The demand for housing in the country surged, with the top seven cities (Delhi NCR, Bangalore, Hyderabad, Mumbai, Pune, Chennai, and Kolkata) collectively adding approximately 402,000 new units, marking a 44% increase from 2021. In Q1 2023, housing sales in these cities reached 1.14 lakh units, a staggering jump of over 99,500 units from the previous year. Consequently, it was projected that the residential new floor area in India would expand by approximately 71 million sq. ft in 2023 compared to 2022.
- In 2020, the residential sector in India faced a setback, witnessing a 6.25% decline in new floor area compared to the previous year. This decline was attributed to the nationwide lockdown, disruptions in the supply chain, labor shortages, reduced construction productivity, and a dip in foreign investments. However, in 2021, the Indian residential real estate market rebounded, adding around 163,000 new residential units across the top seven cities. This surge translated into a significant increase of about 649 million sq. ft in the residential sector's new floor area in 2021 compared to 2020.
- Looking ahead, the residential sector in India is poised to exhibit a CAGR of 2.95% in terms of volume from 2023 to 2030. This growth can be attributed to sustained housing demand, increased investments, and favorable government policies. Notably, by 2030, it is projected that over 40% of India's population will reside in urban areas, driving a demand for approximately 25 million additional affordable housing units. Furthermore, by 2030, the residential real estate market is expected to hit 1.5 million units in key cities, further fueling the demand in the sector.
India Construction Chemicals Industry Overview
The India Construction Chemicals Market is fragmented, with the top five companies occupying 18.71%. The major players in this market are Fosroc, Inc., MBCC Group, Pidilite Industries Ltd., Saint-Gobain and Sika AG (sorted alphabetically).
Additional Benefits:
- The market estimate (ME) sheet in Excel format
- 3 months of analyst support
TABLE OF CONTENTS
1 EXECUTIVE SUMMARY & KEY FINDINGS
2 REPORT OFFERS
3 INTRODUCTION
- 3.1 Study Assumptions & Market Definition
- 3.2 Scope of the Study
- 3.3 Research Methodology
4 KEY INDUSTRY TRENDS
- 4.1 End Use Sector Trends
- 4.1.1 Commercial
- 4.1.2 Industrial and Institutional
- 4.1.3 Infrastructure
- 4.1.4 Residential
- 4.2 Major Infrastructure Projects (current And Announced)
- 4.3 Regulatory Framework
- 4.4 Value Chain & Distribution Channel Analysis
5 MARKET SEGMENTATION (includes market size, forecasts up to 2030 and analysis of growth prospects.)
- 5.1 End Use Sector
- 5.1.1 Commercial
- 5.1.2 Industrial and Institutional
- 5.1.3 Infrastructure
- 5.1.4 Residential
- 5.2 Product
- 5.2.1 Adhesives
- 5.2.1.1 By Sub Product
- 5.2.1.1.1 Hot Melt
- 5.2.1.1.2 Reactive
- 5.2.1.1.3 Solvent-borne
- 5.2.1.1.4 Water-borne
- 5.2.2 Anchors and Grouts
- 5.2.2.1 By Sub Product
- 5.2.2.1.1 Cementitious Fixing
- 5.2.2.1.2 Resin Fixing
- 5.2.2.1.3 Other Types
- 5.2.3 Concrete Admixtures
- 5.2.3.1 By Sub Product
- 5.2.3.1.1 Accelerator
- 5.2.3.1.2 Air Entraining Admixture
- 5.2.3.1.3 High Range Water Reducer (Super Plasticizer)
- 5.2.3.1.4 Retarder
- 5.2.3.1.5 Shrinkage Reducing Admixture
- 5.2.3.1.6 Viscosity Modifier
- 5.2.3.1.7 Water Reducer (Plasticizer)
- 5.2.3.1.8 Other Types
- 5.2.4 Concrete Protective Coatings
- 5.2.4.1 By Sub Product
- 5.2.4.1.1 Acrylic
- 5.2.4.1.2 Alkyd
- 5.2.4.1.3 Epoxy
- 5.2.4.1.4 Polyurethane
- 5.2.4.1.5 Other Resin Types
- 5.2.5 Flooring Resins
- 5.2.5.1 By Sub Product
- 5.2.5.1.1 Acrylic
- 5.2.5.1.2 Epoxy
- 5.2.5.1.3 Polyaspartic
- 5.2.5.1.4 Polyurethane
- 5.2.5.1.5 Other Resin Types
- 5.2.6 Repair and Rehabilitation Chemicals
- 5.2.6.1 By Sub Product
- 5.2.6.1.1 Fiber Wrapping Systems
- 5.2.6.1.2 Injection Grouting Materials
- 5.2.6.1.3 Micro-concrete Mortars
- 5.2.6.1.4 Modified Mortars
- 5.2.6.1.5 Rebar Protectors
- 5.2.7 Sealants
- 5.2.7.1 By Sub Product
- 5.2.7.1.1 Acrylic
- 5.2.7.1.2 Epoxy
- 5.2.7.1.3 Polyurethane
- 5.2.7.1.4 Silicone
- 5.2.7.1.5 Other Resin Types
- 5.2.8 Surface Treatment Chemicals
- 5.2.8.1 By Sub Product
- 5.2.8.1.1 Curing Compounds
- 5.2.8.1.2 Mold Release Agents
- 5.2.8.1.3 Other Product Types
- 5.2.9 Waterproofing Solutions
- 5.2.9.1 By Sub Product
- 5.2.9.1.1 Chemicals
- 5.2.9.1.2 Membranes
- 5.2.1 Adhesives
6 COMPETITIVE LANDSCAPE
- 6.1 Key Strategic Moves
- 6.2 Market Share Analysis
- 6.3 Company Landscape
- 6.4 Company Profiles
- 6.4.1 Ardex Group
- 6.4.2 Don Construction Products Ltd.
- 6.4.3 ECMAS Group
- 6.4.4 Fosroc, Inc.
- 6.4.5 MAPEI S.p.A.
- 6.4.6 MBCC Group
- 6.4.7 Pidilite Industries Ltd.
- 6.4.8 Saint-Gobain
- 6.4.9 Sika AG
- 6.4.10 Thermax Limited
7 KEY STRATEGIC QUESTIONS FOR CONCRETE, MORTARS AND CONSTRUCTION CHEMICALS CEOS
8 APPENDIX
- 8.1 Global Overview
- 8.1.1 Overview
- 8.1.2 Porter's Five Forces Framework (Industry Attractiveness Analysis)
- 8.1.3 Global Value Chain Analysis
- 8.1.4 Market Dynamics (DROs)
- 8.2 Sources & References
- 8.3 List of Tables & Figures
- 8.4 Primary Insights
- 8.5 Data Pack
- 8.6 Glossary of Terms


샘플 요청 목록