


|
시장보고서
상품코드
1689795
태양광 추적기 시장 : 점유율 분석, 산업 동향 및 통계, 성장 예측(2025-2030년)Solar Tracker - Market Share Analysis, Industry Trends & Statistics, Growth Forecasts (2025 - 2030) |
||||||
■ 보고서에 따라 최신 정보로 업데이트하여 보내드립니다. 배송일정은 문의해 주시기 바랍니다.
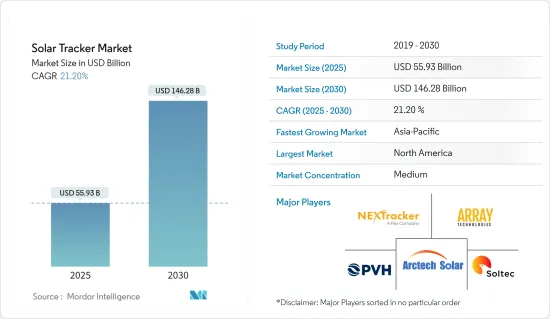
세계의 태양광 추적기 시장 규모는 2025년 559억 3,000만 달러로 추정되며, 예측 기간 중(2025-2030년) CAGR 21.2%로 확대되어, 2030년에는 1,462억 8,000만 달러에 달할 것으로 예측됩니다.

주요 하이라이트
- 장기적으로는 태양광 발전 설비 증가가 예측 기간중의 태양광 추적기 수요를 낳을 것으로 예상됩니다.
- 한편, 추적 시스템의 설치에 필요한 초기 투자의 높이, 설계의 복잡성, 유지 보수 비용, 태양 추적 시스템의 용량 제한 등이 태양 추적 장치의 이용을 억제할 것으로 예상됩니다.
- 정부의 지원 시책이나 재생 가능 에너지원을 이용한 전력 수요 증가에 대응하는 대처 등의 요인에 의해 향후 수년간은 솔라 패널이나 태양광 추적기의 유리한 시장이 형성될 것으로 예상됩니다.
- 북미는 태양광 추적기 시장을 독점하고 있으며, 미국은 2023년 말까지 70% 이상의 프로젝트에 태양광 추적기가 설치되는 중요한 고객으로 부상하고 있습니다.
태양광 추적기 시장 동향
세계 태양광 발전 설비 증가가 시장 독점
- 태양 추적 기술을 사용하면 태양 포수제, 리플렉터, 태양광 발전 패널이 태양의 방향을 향합니다.
- 태양광 발전(PV) 프로젝트의 설치 용량은 정부의 유리한 조치와 여러 국가가 설정한 야심적인 재생 가능 에너지 목표에 뒷받침되는 재생 가능 에너지 산업에 대한 투자 증가로 지난 10년간 상당히 증가하고 있습니다. IRENA Renewable Energy Capacity Statistics 2024에 따르면 세계 태양광 발전의 누적 설치 용량은 2022년 1,066.5GW에서 2023년에는 1,412.0GW로 32.39% 증가했습니다.
- 중국, 미국, 일본, 독일, 인도, 호주 등 국가들이 세계 PV 설치 용량의 대부분을 차지하고 있어 태양광 추적기 시장에서 중요한 역할을 할 것으로 예상됩니다.
- 중국 시장은 2023년에 216GW의 PV 신설 용량으로 성장하여 세계 시장의 55.26% 이상을 차지합니다. 태양에너지산업의 개발로 중국의 태양광발전의 누적 용량은 2024년까지 700GW를 넘어 2025년 말에는 900GW 가까이까지 증가할 것으로 예상됩니다.
- 유럽은 태양광 발전 산업에서 현저한 발전을 이루고 있습니다. SolarPower Europe에 따르면 2023년에는 27개국 전체에서 약 55.9GW의 태양광 발전 용량이 새롭게 설치되어 2022년 수준에서 40%의 성장률에 상당합니다.
- 게다가, 2023년 9월, 독일의 에너지 공급자인 Vatenfall은 최적의 발전을 위해 태양광 추적기를 사용한 79MW의 Tutzpatz에서 농업용 태양광 발전소의 개발을 언급했습니다. Vatenfall은 또한 Power and Air Condition Solution Management(PASM)와 10년간 클린 전력을 공급하는 전력 구입 계약을 맺었습니다.
- 이상으로부터, 세계에서 태양광 발전의 설치가 증가하고 있어, 예측 기간 중에 시장을 석권하는 것이 예상됩니다.
시장을 독점하는 북미
- 미국은 세계 태양광 추적기의 주요 시장 중 하나이며, 수요의 대부분은 캘리포니아, 애리조나, 네바다, 텍사스, 플로리다, 노스 캐롤라이나 등의 주에서 유래하고 있습니다.
- 미국의 태양광 발전 시장에서의 단축추적식의 이용은 지난 10년간 꾸준히 확대되고 있습니다.
- 캐나다의 태양광 추적기 시장은 발전 단계에 있으며, 대부분 수요는 알버타, 매니토바, 온타리오, 서스캐처원 등의 주에서 유래하고 있습니다.
- 2023년 7월에는 앨버타의 Scottford Project(81MW)와 Saddlebtook Project(101MW)의 2개의 태양광 발전 프로젝트가 시작되었습니다.
- 미국의 태양광 추적기 시장에 더해, 인디애나주, 버지니아주, 네바다주 등에서는 상당히 많은 태양광 발전 프로젝트가 진행중이며, 예측 기간 중에 태양광 추적기의 큰 수요가 생길 것으로 예상됩니다.
- 2024년 2월 태양광 추적기의 제조 및 공급회사인 Soltec은 버지니아주에 설치되는 약 164MW의 SF7 태양광 추적기를 공급하는 계약을 Blue Ridge Power에서 획득했습니다. SF7 태양광 추적기는 보다 적은 부품과 지원으로 프로젝트를 신속하게 완료합니다.
- 태양에너지산업협회(SEIA)의 데이터에 따르면 인디애나 주에서는 2026년까지 약 5GW의 태양광 발전 용량이 설치될 전망으로, 동주의 파이프라인은 국내 제6위에 랭크됩니다.
- 이 때문에 향후 예정되고 있는 태양광 발전 추적 시스템 프로젝트, 정부의 지원 시책, 화석 연료 베이스의 전력에의 의존을 줄이는 대처 등의 요인이, 이 지역의 태양광 추적기 시장을 견인할 것으로 예상됩니다.
태양 트래커 산업 개요
태양광 추적기 시장은 반고정적이며, 시장의 주요 기업(특별한 순서 없음)에는 NexTracker Inc., Array Technologies Inc., PV Hardware Solutions SLU, Arctech Solar Holding, Soltec Power Holdings SA 등이 있습니다.
기타 혜택
- 엑셀 형식 시장 예측(ME) 시트
- 3개월간의 애널리스트 서포트
목차
제1장 서론
- 조사 범위
- 시장의 정의
- 조사의 전제
제2장 주요 요약
제3장 조사 방법
제4장 시장 개요
- 소개
- 2029년까지 시장 규모와 수요 예측(단위: 달러)
- 최근 동향과 개발
- 정부의 규제와 시책
- 시장 역학
- 성장 촉진요인
- 태양광 발전 설비 증가
- 억제요인
- 초기 투자액
- 성장 촉진요인
- 공급망 분석
- Porter's Five Forces 분석
- 공급기업의 협상력
- 소비자의 협상력
- 신규 참가업체의 위협
- 대체품의 위협
- 경쟁 기업간 경쟁 관계의 강도
제5장 시장 세분화
- 축 유형
- 단축
- 2축
- 지역
- 북미
- 미국
- 멕시코
- 기타 북미
- 유럽
- 독일
- 프랑스
- 영국
- 이탈리아
- 스페인
- 노르딕
- 튀르키예
- 러시아
- 기타 유럽
- 아시아태평양
- 중국
- 인도
- 일본
- 한국
- 말레이시아
- 태국
- 인도네시아
- 베트남
- 기타 아시아태평양
- 중동 및 아프리카
- 사우디아라비아
- 아랍에미리트(UAE)
- 남아프리카
- 카타르
- 나이지리아
- 이집트
- 기타 중동 및 아프리카
- 남미
- 브라질
- 콜롬비아
- 칠레
- 기타 남미
- 북미
제6장 경쟁 구도
- M&A, 합작사업, 제휴, 협정
- 주요 기업의 전략
- 기업 프로파일
- Soltec Power Holdings SA
- Arctech Solar Holdings Co Ltd.
- Meca Solar
- Ideematec Deutschland GmbH
- Nextracker Inc.
- Trina Solar
- Valmont Industries Inc.
- PV Hardware Solutions SLU
- Solar Flexrack
- Array Technologies Inc.
- 기타 유명한 기업 일람(회사명, 본사 소재지, 관련 제품 및 서비스, 연락처 등)
- 시장 랭킹 분석
제7장 시장 기회와 앞으로의 동향
- 전력 수요 증가
The Solar Tracker Market size is estimated at USD 55.93 billion in 2025, and is expected to reach USD 146.28 billion by 2030, at a CAGR of 21.2% during the forecast period (2025-2030).
Key Highlights
- Over the long term, increasing solar PV installations are expected to create demand for solar trackers in the forecast period.
- On the other hand, the high initial investment required to install a tracking system, design complexity, maintenance cost, and limited capacity of solar tracking systems is expected to restrain the usage of solar trackers.
- Nevertheless, factors such as supportive government policies and efforts to meet the increasing power demand using renewable energy sources are expected to create a favorable market for solar panels and for solar trackers in the coming years.
- North America has dominated the solar trackers market, where the United States emerged as a significant customer with solar trackers installed in more than 70% of projects by the end of 2023.
Solar Tracker Market Trends
Increasing Solar PV Installations Across The Globe to Dominate the Market
- Using solar tracking technology, solar collectors, reflectors, and photovoltaic panels are oriented toward the sun. As the sun moves across the sky, a tracking device ensures that solar collectors maintain a position in which they receive the maximum amount of solar radiation as it moves across the sky. Solar tracker's ability to track the sun can improve PV system efficiency by as much as 25 to 35 percent.
- The installed capacity of solar photovoltaic (PV) projects has been growing significantly over the last decade due to increasing investments in the renewable energy industry supported by favorable government policies and ambitious renewable energy targets set by several countries. According to IRENA Renewable Energy Capacity Statistics 2024, the cumulative global installed solar PV capacity grew by 32.39%, i.e., from 1066.5 GW in 2022 to 1412.0 GW in 2023.
- Countries such as China, the United States, Japan, Germany, India, and Australia account for most of the installed PV capacity globally, which is expected to play a significant role in the solar tracker market.
- The Chinese market grew with 216 GW of newly installed PV capacity in 2023, representing more than 55.26% of the global market. Industry projections estimate that this significant acceleration is set to continue with about 165 GW expected to be added in 2024 and 170 GW in 2025. The developments in the solar energy industry is expected to witness China's cumulative solar PV capacity reach over 700 GW by 2024 and increase to close to 900 GW by the end of 2025.
- The European region has been witnessing significant developments in the solar industry. According to SolarPower Europe, In 2023, nearly 55.9 GW of new solar PV capacity was installed across the 27 Member States, representing a 40% growth rate from 2022 levels. The cumulative EU solar PV fleet amounts to 263 GW, up 27% from the 207 GW in 2022. Germany continues to be the largest contributor with 82 GW.
- Additionally, several solar projects are either in the planning or construction phase. For instance, In September 2023, Germany's energy provider Vattenfall noted the development of an Agri-Photovoltaic power plant in Tutzpatz of 79 MW using solar trackers to optimally generate electricity. Vatenfall has also inked a power purchase agreement with Power and Air Condition Solution Management (PASM) to supply clean electricity for ten years.
- Thus, owing to the above points, the increasing Solar PV installations across the globe are expected to dominate the market in the forecast period.
North America to Dominate the Market
- The United States is one of the major markets for solar trackers worldwide, with a majority of the demand coming from states like California, Arizona, Nevada, Texas, Florida, North Carolina, etc. As per the International Renewable Energy Agency (IRENA), the solar energy installed capacity in the United States of America was about 139 GW in 2023, an increase of about 21% since the previous year.
- The use of single-axis tracking in the United States's utility PV market has grown steadily over the past decade. At the end of 2023, about 22.5 GW of utility-scale solar installations were executed in the United States, where the solar tracker systems had a substantial share in the projects
- Canada's solar tracker market is in its development phase, with the majority of the demand coming from provinces like Alberta, Manitoba, Ontario, and Saskatchewan. The market for solar trackers has been gaining momentum in recent years due to their increased efficiency and declining costs. Multiple projects have been commissioned in the country.
- In July 2023, the country witnessed the commencement of two solar projects, the Scotford Project (81MW) and the Saddlebtook Project (101 MW) in Alberta. The projects, being developed by Qcells and Alltrade Industrial Contractors, would use fixed-tilt trackers to generate electricity from bifacial solar modules.
- In addition to the United States's big markets for solar trackers, states like Indiana, Virginia, and Nevada, among others, have a significantly large number of solar PV projects in the pipeline, which is expected to create significant demand for solar trackers during the forecast period.
- In February 2024, Soltec, the manufacturer and supplier of solar trackers, bagged a contract from Blue Ridge Power to supply about 164 MW of SF7 solar trackers to be located in Virginia. The SF7 solar tracker requires fewer components and supports to complete the project quickly. The power plant, upon completion, is likely to curtail over 294,000 tons of emissions, which could power about 17000 households.
- According to the data from the Solar Energy Industries Association (SEIA), around 5 GW of solar PV capacity is expected to be installed in Indiana by 2026, ranking the state's pipeline as the sixth-largest in the country. On the other hand, SEIA estimates that Nevada will install more than 4 GW over the same period, making the state the seventh-largest in terms of solar PV pipelines.
- Therefore, factors such as upcoming solar PV tracking systems projects, supportive government policies, and efforts to reduce reliance on fossil fuel-based power are expected to drive the solar tracker market in the region.
Solar Tracker Industry Overview
The solar tracker market is semi-consolidated. Some of the major players in the market (in no particular order) include NexTracker Inc., Array Technologies Inc., PV Hardware Solutions S.L.U., Arctech Solar Holding Co. Ltd, and Soltec Power Holdings SA.
Additional Benefits:
- The market estimate (ME) sheet in Excel format
- 3 months of analyst support
TABLE OF CONTENTS
1 INTRODUCTION
- 1.1 Scope of the Study
- 1.2 Market Definiton
- 1.3 Study Assumptions
2 EXECUTIVE SUMMARY
3 RESEARCH METHODOLOGY
4 MARKET OVERVIEW
- 4.1 Introduction
- 4.2 Market Size and Demand Forecast in USD, till 2029
- 4.3 Recent Trends and Developments
- 4.4 Government Policies and Regulations
- 4.5 Market Dynamics
- 4.5.1 Drivers
- 4.5.1.1 Increasing Solar PV Installations
- 4.5.2 Restraints
- 4.5.2.1 High Initial Investment
- 4.5.1 Drivers
- 4.6 Supply Chain Analysis
- 4.7 Porter's Five Forces Analysis
- 4.7.1 Bargaining Power of Suppliers
- 4.7.2 Bargaining Power of Consumers
- 4.7.3 Threat of New Entrants
- 4.7.4 Threat of Substitute Products and Services
- 4.7.5 Intensity of Competitive Rivalry
5 Market Segmentation
- 5.1 Axis Type
- 5.1.1 Single Axis
- 5.1.2 Dual Axis
- 5.2 Geography
- 5.2.1 North America
- 5.2.1.1 United States
- 5.2.1.2 Mexico
- 5.2.1.3 Rest of North America
- 5.2.2 Europe
- 5.2.2.1 Germany
- 5.2.2.2 France
- 5.2.2.3 United Kingdom
- 5.2.2.4 Italy
- 5.2.2.5 Spain
- 5.2.2.6 NORDIC
- 5.2.2.7 Turkey
- 5.2.2.8 Russia
- 5.2.2.9 Rest of Europe
- 5.2.3 Asia-Pacific
- 5.2.3.1 China
- 5.2.3.2 India
- 5.2.3.3 Japan
- 5.2.3.4 South Korea
- 5.2.3.5 Malaysia
- 5.2.3.6 Thailand
- 5.2.3.7 Indonesia
- 5.2.3.8 Vietnam
- 5.2.3.9 Rest of Asia-Pacific
- 5.2.4 Middle-East and Africa
- 5.2.4.1 Saudi Arabia
- 5.2.4.2 United Arab Emirates
- 5.2.4.3 South Africa
- 5.2.4.4 Qatar
- 5.2.4.5 Nigeria
- 5.2.4.6 Egypt
- 5.2.4.7 Rest of Middle East and Africa
- 5.2.5 South America
- 5.2.5.1 Brazil
- 5.2.5.2 Colombia
- 5.2.5.3 Chile
- 5.2.5.4 Rest of South America
- 5.2.1 North America
6 Competitive Landscape
- 6.1 Mergers and Acquisitions, Joint Ventures, Collaborations, and Agreements
- 6.2 Strategies Adopted by Leading Players
- 6.3 Company Profiles
- 6.3.1 Soltec Power Holdings SA
- 6.3.2 Arctech Solar Holdings Co Ltd.
- 6.3.3 Meca Solar
- 6.3.4 Ideematec Deutschland GmbH
- 6.3.5 Nextracker Inc.
- 6.3.6 Trina Solar
- 6.3.7 Valmont Industries Inc.
- 6.3.8 PV Hardware Solutions S.L.U.
- 6.3.9 Solar Flexrack
- 6.3.10 Array Technologies Inc.
- 6.4 List of Other Prominent Companies (Company Name, Headquarter, Relevant Products & Services, Contact Details, etc.)
- 6.5 Market Ranking Analysis
7 Market Opportunities and Future Trends
- 7.1 Increasing Power Demand

샘플 요청 목록