
|
시장보고서
상품코드
1690707
고무용 프로세스 오일 시장 : 점유율 분석, 산업 동향 및 통계, 성장 예측(2025-2030년)Rubber Process Oils - Market Share Analysis, Industry Trends & Statistics, Growth Forecasts (2025 - 2030) |
||||||
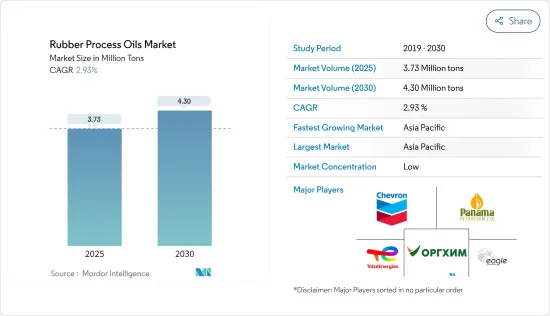
세계의 고무용 프로세스 오일 시장 규모는 2025년 373만 톤으로 추정되며, 예측 기간 중(2025-2030년) CAGR 2.93%로 확대되어, 2030년에는 430만 톤에 달할 것으로 예측됩니다.
COVID-19 팬데믹은 시장에 부정적인 영향을 미쳤습니다. 봉쇄와 규제에 의해 제조시설이나 공장이 폐쇄되었기 때문입니다. 공급망과 운송의 혼란은 시장에 장애를 가져왔습니다. 그러나 2021년에는 업계가 회복되었고 시장 수요도 회복되었습니다.
주요 하이라이트
- 단기적으로 자동차 산업의 타이어와 자동차 부품 수요 증가는 시장 성장의 주요 요인 중 하나입니다.
- 반면 원료 가격 변동이 시장 성장을 방해할 것으로 예상됩니다.
- 그러나 바이오 고무용 오일에 대한 수요 증가는 예측 기간 동안 시장 성장에 다양한 기회를 제공할 것으로 예상됩니다.
- 아시아태평양은 가장 큰 시장으로, 중국, 인도, 일본 등 국가에서의 소비 증가로 예측 기간 동안 가장 빠르게 성장하는 시장이 될 것으로 예상됩니다.
고무용 프로세스 오일 시장 동향
타이어 및 자동차 부품에서 고무용 프로세스 오일 수요 증가
- 고무용 프로세스 오일은 고무 화합물을 혼합하는 데 사용됩니다. 이들 제품은 충전제의 분산성 및 화합물의 유동성을 향상시킵니다. 따라서 고무를 기반으로 하는 산업에 있어서 가장 중요한 성분이라고 생각되고 있습니다.
- 기계적 특성이 향상되기 때문에 고무용 오일은 타이어 및 기타 자동차 부품에 사용됩니다. 게다가, 제품의 브레이크 효율과 연비 향상은 타이어와 자동차 부품에서의 사용에 더 많은 이익을 가져올 것으로 예상됩니다.
- 고무용 프로세스 오일은 타이어의 제조에 사용되는 고무의 특성을 향상시킵니다. 인구 증가에 따른 생활수준의 향상과 소비력 증가는 세계적으로 자동차 수요를 끌어올리는 요인이 되고 있습니다. 예를 들어 OICA에 따르면 2022년 세계 전체의 승용차 생산 대수는 6,159만대로 2021년 대비 8%, 2020년 대비 10% 증가를 보였습니다. 따라서 승용차의 생산량 증가는 예측기간 동안 고무용 오일시장에 상향 수요를 발생시킬 것으로 예상됩니다.
- 게다가 독일에서는 반도체 부족과 원재료의 제한된 공급으로 자동차 산업이 저해되고 있습니다. 마찬가지로 새로운 국제표준배출가스시험방식(WLTP)의 실시와 국제 자동차 수요를 감소시킨 미국과 중국의 무역마찰, 새로 판매되는 자동차의 평균 CO2 배출량을 킬로미터당 95그램으로 하는 것을 자동차 제조업체에 의무화한 EU-28의 새로운 배출가스 기준 등 다른 요인도 승용차 생산에 악영향을 주었습니다.
- 그러나 2022년에는 자동차 생산이 반도체 부족으로부터 점차 회복되었습니다. 예를 들어 OICA에 따르면 2022년 독일에서 생산된 승용차는 약 348만 357대로 2021년에 비해 12% 증가했습니다. 따라서 승용차 부문의 생산량 증가는 고무용 프로세스 오일 시장에 상향 수요를 가져올 것으로 예상됩니다.
- 또한 미국은 세계 2위의 자동차 판매 및 생산 시장입니다. 예를 들어 OICA에 따르면 2022년 미국의 자동차 생산 대수는 1,006만 339대로 2021년 대비 10% 증가를 보였습니다. 그 결과 자동차 생산량이 증가함에 따라 고무용 프로세스 오일 시장 수요 증가가 예상됩니다.
- 그러므로 이 지역의 이러한 좋은 동향과 투자는 모두 예측 기간 동안 고무용 프로세스 오일 시장 수요를 촉진할 것으로 예상됩니다.
시장을 독점하는 아시아태평양
- 예측 기간 동안 아시아태평양은 고무용 프로세스 오일 시장을 독점할 것으로 예상됩니다. 중국, 일본, 인도 등 신흥 국가에서 타이어 및 자동차 부품의 고무용 프로세스 오일 수요 증가가 이 지역의 고무용 프로세스 오일 수요를 견인할 것으로 예상됩니다.
- 고무용 프로세스 오일의 가장 큰 생산자는 아시아태평양에 위치하고 있습니다. 고무용 프로세스 오일 생산의 주요 기업으로는 Total, Chevron Intellectual Property LLC, Panama Petrochem Ltd, ORGKHIM Biochemical Holding, Eagle Petrochem 등이 있습니다.
- 중국 자동차 산업은 배터리 구동 전기자동차에 대한 소비자의 선호도가 높아짐에 따라 동향이 변화하고 있습니다. 중국 자동차 산업의 확대는 고무용 프로세스 오일 시장에 이익을 가져올 것으로 기대됩니다. 국제자동차공업회(OICA)에 따르면 중국은 세계 최대의 자동차 생산국으로 세계 생산량의 34% 가까이를 차지하고 있습니다. 2022년 자동차 생산 대수는 2,702만 615대로 2021년 2,612만 1,712대에 비해 24% 증가했습니다. 따라서 자동차 생산량 증가는 고무용 프로세스 오일 시장에 상향 수요를 가져올 것으로 예상됩니다.
- 인도에서는 자동차 배기가스 규제 강화, 자동차 안전성 향상, 자동차에 ADAS(첨단 운전 지원 시스템) 도입, 소매 및 E-Commerce 부문에서의 물류 급성장 등이 소형상용차(LCV)의 신차·선진차 수요를 크게 견인하고 있습니다. 예를 들어 OICA에 따르면 2022년 인도의 소형 상용차 생산 대수는 61만 7,398대로 2021년 대비 27% 증가했으며 2020년 대비 60% 회복했습니다.
- 게다가 인도의 자동차 산업에 대한 투자와 진보 증가는 고무용 프로세스 오일 시장의 소비를 증가시킬 것으로 예상됩니다. 예를 들어 Tata Motors는 2022년 4월 향후 5년간 승용차 사업에 30억 8,000만 달러를 투자할 계획을 발표했습니다. 이 확대는 이 나라의 고무용 프로세스 오일 시장에 긍정적인 영향을 미칠 것으로 예상됩니다.
- 공업이나 건설 작업 중 전기 접촉, 낙하물, 유해한 화학물질이나 기름 유출, 기계의 이동 등에 의한 부상으로부터 작업자의 안전을 지키는 의식의 상승은 고무 신발 수요에 긍정적으로 작용할 것으로 예상됩니다. 고무를 사용한 신발의 제조에서 고무용 프로세스 오일의 사용이 증가하고 있습니다. 따라서, 고무 신발 수요가 증가함에 따라 고무 프로세스 오일 시장이 더욱 활성화됩니다.
- 위의 요인들로부터 아시아태평양의 고무용 프로세스 오일 시장은 조사 기간 동안 크게 성장할 것으로 예상됩니다.
고무용 프로세스 오일 산업 개요
고무용 프로세스 오일 시장은 세분화되어 있습니다. 이 시장의 주요 기업(특별한 순서 없음)에는 TotalEnergies, Chevron Corporation, Panama Petrochem Ltd, ORGKHIM Biochemical Holding, Eagle Petrochem 등이 있습니다.
기타 혜택:
- 엑셀 형식 시장 예측(ME) 시트
- 3개월간의 애널리스트·지원
목차
제1장 서론
- 조사의 전제조건
- 조사 범위
제2장 조사 방법
제3장 주요 요약
제4장 시장 역학
- 성장 촉진요인
- 타이어와 자동차 부품 수요 증가
- 신발류 수요 증가
- 기타
- 억제요인
- 원재료 가격 변동
- 기타 억제요인
- 밸류체인 분석
- Porter's Five Forces 분석
- 공급기업의 협상력
- 구매자의 협상력
- 신규 참가업체의 위협
- 대체품의 위협
- 경쟁도
제5장 시장 세분화
- 제품 유형
- 방향족계
- 파라핀계
- 나프텐계
- 용도
- 타이어 및 자동차 부품
- 신발류
- 소비재
- 기타 용도
- 지역
- 아시아태평양
- 중국
- 인도
- 일본
- 한국
- 기타 아시아태평양
- 북미
- 미국
- 캐나다
- 멕시코
- 유럽
- 독일
- 영국
- 프랑스
- 이탈리아
- 기타 유럽
- 남미
- 브라질
- 아르헨티나
- 기타 남미
- 중동 및 아프리카
- 사우디아라비아
- 남아프리카
- 기타 중동 및 아프리카
- 아시아태평양
제6장 경쟁 구도
- 인수합병(M&A), 합작사업, 제휴, 협정
- 시장 점유율(%)**/랭킹 분석
- 주요 기업의 전략
- 기업 프로파일
- APAR Industries
- Chevron Corporation
- CPC Corporation
- EaglePetrochem
- Exxon Mobil Corporation
- HF Sinclair Corporation
- LODHA Petro
- ORGKHIM Biochemical Holding
- Panama Petrochem Ltd
- Repsol
- Sterlite Lubricants
- TotalEnergies
- Witmans Industries Pvt. Ltd
제7장 시장 기회와 앞으로의 동향
- 바이오 베이스의 고무용 프로세스 오일 수요 증가
- 기타 기회
The Rubber Process Oils Market size is estimated at 3.73 million tons in 2025, and is expected to reach 4.30 million tons by 2030, at a CAGR of 2.93% during the forecast period (2025-2030).

The COVID-19 pandemic negatively impacted the market. This was because of the shutdown of the manufacturing facilities and plants due to the lockdown and restrictions. Supply chain and transportation disruptions further created hindrances for the market. However, the industry witnessed a recovery in 2021, thus rebounding the demand for the market studied.
Key Highlights
- Over the short term, increasing demand for tire and automotive components from the automobile industry is one of the major factors driving the growth of the market studied.
- On the flip side, volatility in raw material prices is expected to hinder the growth of the market.
- However, the increasing demand for bio-based rubber process oil is forecasted to offer various opportunities for the growth of the market over the forecast period.
- Asia-Pacific region represents the largest market and is also expected to be the fastest-growing market over the forecast period owing to the increasing consumption from countries such as China, India, and Japan.
Rubber Process Oil Market Trends
Growing Demand of Rubber Process Oil from Tire and Automobile Components
- Rubber process oils are used while mixing the rubber compounds. These products improve the dispersion of fillers and the flow property of the compound. Hence, it is considered to be the most important ingredient for the rubber-based industry.
- Due to enhanced mechanical properties, rubber process oils are used in the tire and other automotive components. In addition, improved braking efficiency and fuel consumption of the product are likely to further benefit its usage in the tire and automotive components.
- The rubber process oils enhance the rubber properties used in the production of tires. Rising population improved living standards and increased spending power are factors likely to boost the demand for automobiles globally. For instance, according to OICA, in 2022, the total number of passenger cars produced globally was 61.59 million units, which showed an increase of 8% compared to 2021 and 10% compared to 2020. Therefore, an increase in the production of passenger cars is expected to create an upside demand for the rubber process oil market in the forecast period.
- Moreover, in Germany, the automotive industry has been hampered by the shortage of semiconductors and a limited supply of raw materials. Similarly, other factors such as the implementation of the new Worldwide Harmonized Light-Duty Vehicles Test Procedure (WLTP) and US-China trade conflicts which decreased the international automotive demand, EU-28's new emission standard which mandates carmakers to achieve average CO2 emissions of 95 grams per kilometre across newly sold vehicles had negatively affected the production of passenger cars.
- However, in 2022 the automobile production in the country recovered gradually from semiconductor shortages. For instance, according to OICA, around 34,80,357 passenger cars were produced in Germany in 2022, which shows an increase of 12% compared to 2021. Therefore, increase in the production of passeger car segment is expected to create an upside demand for the rubber process oils market.
- Furthermore, the United States is the second-largest market for vehicle sales and production globally. For instance, according to OICA, in 2022, automobile production in the United States amounted to 1,00,60,339 units, which showed an increase of 10% compared to 2021. As a result, an increase in automobile production is expected to create an upside demand for rubber process oils market.
- Therefore, all such favorable trends and investments in the region are expected to drive the demand for rubber process oils market during the forecast period.
Asia-Pacific Region to Dominate the Market
- Asia-Pacific region is expected to dominate the market for rubber process oil during the forecast period. The rising demand for rubber process oil from tire and automobile components in developing countries like China, Japan, and India is expected to drive the demand for rubber process oil in this region.
- The largest producers of rubber process oil are located in the Asia-Pacific region. Some of the leading companies in the production of rubber process oil are Total, Chevron Intellectual Property LLC, Panama Petrochem Ltd, ORGKHIM Biochemical Holding, and Eagle Petrochem among others.
- The automobile industry in China is experiencing shifting trends as consumer preference for battery-powered electric vehicles rises. The expansion of China's automotive sector is expected to benefit the rubber process oil market. According to the International Organization of Motor Vehicle Manufacturers (OICA), China is the world's largest automobile producer, accounting for nearly 34% of global volume. In 2022, the country produced 2,70,20,615 units of automobiles, registering an increase of 24% compared to 2,61,21,712 units in 2021. Therefore, increasing in the production of automobiles is expected to create an upside demand for the rubber process oil market.
- In India, increasing regulations on vehicle emissions, advancement in vehicle safety, the introduction of driver-assist systems in vehicles, and rapidly growing logistics in the retail and e-commerce sectors, have been significantly driving the demand for new and advanced Light commercial vehicles (LCVs). For instance, accroding to OICA, in 2022, light commercial vehicle production in India amounted to 6,17,398 units, which showen an increase of 27% compared to 2021 and a recovery of 60% compared to 2020.
- Furthermore, increased investments and advancements in the automobile industry in India is expected to increase the consumption of rubber process oil market. For instance, in April 2022, Tata Motors announced plans to invest USD 3.08 billion in its passenger vehicle business over the next five years. This expansion is expected to have a positive impact on the rubber process oils market in the country.
- Rising awareness about the worker's safety from injuries due to electrical contacts, falling objects, spilling of harmful chemicals and oils, moving machinery, and others during industrial or construction work is likely to benefit the demand for rubber footwear. Rubber process oil is increasingly used in manufacturing footwear using rubber. Hence, the rising demand for rubber footwear further fuels the rubber process oils market.
- Owing to the above-mentioned factors, the market for rubber process oil in the Asia-Pacific region is projected to grow significantly during the study period.
Rubber Process Oil Industry Overview
The Rubber Process Oil Market is fragmented in nature. The major players in this market (not in a particular order) include TotalEnergies, Chevron Corporation, Panama Petrochem Ltd, ORGKHIM Biochemical Holding, and EaglePetrochem, among others.
Additional Benefits:
- The market estimate (ME) sheet in Excel format
- 3 months of analyst support
TABLE OF CONTENTS
1 INTRODUCTION
- 1.1 Study Assumptions
- 1.2 Scope of the Study
2 RESEARCH METHODOLOGY
3 EXECUTIVE SUMMARY
4 MARKET DYNAMICS
- 4.1 Drivers
- 4.1.1 Increasing Demand for Tire and Automotive Components
- 4.1.2 Growing Demand for Footwear
- 4.1.3 Others
- 4.2 Restraints
- 4.2.1 Volatility in Raw Material Price
- 4.2.2 Other Restraints
- 4.3 Industry Value Chain Analysis
- 4.4 Porter's Five Forces Analysis
- 4.4.1 Bargaining Power of Suppliers
- 4.4.2 Bargaining Power of Buyers
- 4.4.3 Threat of New Entrants
- 4.4.4 Threat of Substitute Products and Services
- 4.4.5 Degree of Competition
5 MARKET SEGMENTATION (Market Size in Volume)
- 5.1 Product Type
- 5.1.1 Aromatic
- 5.1.2 Paraffinic
- 5.1.3 Naphthenic
- 5.2 Application
- 5.2.1 Tire and Automobile Components
- 5.2.2 Footwear
- 5.2.3 Consumer Goods
- 5.2.4 Other Applications
- 5.3 Geography
- 5.3.1 Asia-Pacific
- 5.3.1.1 China
- 5.3.1.2 India
- 5.3.1.3 Japan
- 5.3.1.4 South Korea
- 5.3.1.5 Rest of Asia-Pacific
- 5.3.2 North America
- 5.3.2.1 United States
- 5.3.2.2 Canada
- 5.3.2.3 Mexico
- 5.3.3 Europe
- 5.3.3.1 Germany
- 5.3.3.2 United Kingdom
- 5.3.3.3 France
- 5.3.3.4 Italy
- 5.3.3.5 Rest of Europe
- 5.3.4 South America
- 5.3.4.1 Brazil
- 5.3.4.2 Argentina
- 5.3.4.3 Rest of South America
- 5.3.5 Middle-East and Africa
- 5.3.5.1 Saudi Arabia
- 5.3.5.2 South Africa
- 5.3.5.3 Rest of Middle-East and Africa
- 5.3.1 Asia-Pacific
6 COMPETITIVE LANDSCAPE
- 6.1 Mergers and Acquisitions, Joint Ventures, Collaborations, and Agreements
- 6.2 Market Share (%)**/Ranking Analysis
- 6.3 Strategies Adopted by Leading Players
- 6.4 Company Profiles
- 6.4.1 APAR Industries
- 6.4.2 Chevron Corporation
- 6.4.3 CPC Corporation
- 6.4.4 EaglePetrochem
- 6.4.5 Exxon Mobil Corporation
- 6.4.6 HF Sinclair Corporation
- 6.4.7 LODHA Petro
- 6.4.8 ORGKHIM Biochemical Holding
- 6.4.9 Panama Petrochem Ltd
- 6.4.10 Repsol
- 6.4.11 Sterlite Lubricants
- 6.4.12 TotalEnergies
- 6.4.13 Witmans Industries Pvt. Ltd
7 MARKET OPPORTUNITIES AND FUTURE TRENDS
- 7.1 Increasing Demand of Bio Based Rubber Processing Oil
- 7.2 Other Opportunities
