|
시장보고서
상품코드
1692450
아시아태평양의 데이터센터 시장 : 시장 점유율 분석, 산업 동향, 성장 예측(2025-2030년)Asia-Pacific Data Center - Market Share Analysis, Industry Trends & Statistics, Growth Forecasts (2025 - 2030) |
||||||
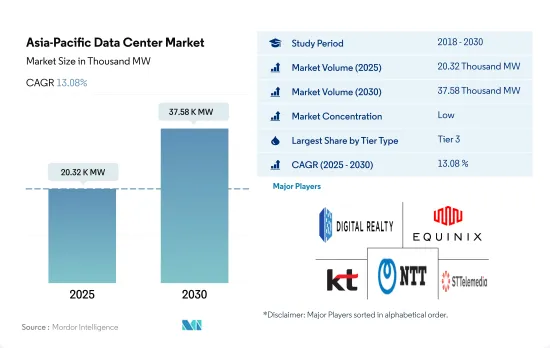
아시아태평양의 데이터센터 시장 규모는 2025년 2만 320kW로 추정되고, 2030년에는 3만 7,580kW에 이를 것으로 예측되며, CAGR 13.08%로 성장할 것으로 예측됩니다.
또한 2025년에는 182억 5,600만 달러의 코로케이션 수익이 예상되며, 2030년에는 404억 6,220만 달러에 달할 것으로 예측되며, 예측 기간(2025-2030년)의 CAGR은 17.25%입니다.
Tier 3 데이터센터는 2023년 규모 면에서 과반수 점유율을 차지했으며, Tier 4는 가장 빠르게 성장하는 부문
- 아시아태평양 지역에서 대다수의 점유율을 차지하고 있습니다.
- 호주에서는 뉴캐슬 시의회가 개발한 스마트 시티 전략이 빅데이터, 사물 인터넷, 클라우드 연결이 어떻게 더 살기 좋고 혁신적인 도시를 만드는 데 도움이 될 수 있는지에 초점을 맞추고 있습니다. 코로나19의 확산 국면에서 클라우드 컴퓨팅은 말레이시아의 디지털 여정의 토대가 된 것으로 널리 인정받았습니다.
- APAC의 Tier 3 부문은 2022년 6705.97MW의 IT 부하 용량으로 운영되었습니다. 이 용량은 2023년 8522.04MW에서 2029년 13981.5MW로 성장하여 CAGR 8.60%를 보일 것으로 예측됩니다.
- Tier 4 부문은 CAGR 20.40%를 보일 것으로 예측됩니다. 신흥 국가들은 내결함성과 중복성을 실현하기 위해 Tier 4 인증을 채택하고 있습니다. 이 때문에 개발 도상 지역에서도 Tier 4 부문이 채택되고 있습니다. 예를 들어, Supernap Thailand는 이 나라에서 유일한 Tier 4 시설입니다.
- Tier 1 및 2 부문은 전체 트래픽의 70% 이상이 서버 간에 이동하기 때문에 가장 낮은 성장률을 보입니다. 최신 애플리케이션은 데이터 센터 내에서 더 빠른 속도로 이동하기 위해 훨씬 더 많은 데이터를 필요로 하며 지연 시간에 대한 관용이 적습니다.
2023년 시장 점유율은 중국, 호주, 인도가 대부분을 차지합니다.
- 중국과 호주는 아시아태평양 지역에서 데이터센터 시장을 선도하는 국가입니다. 중국은 세계 최대 규모의 광섬유 네트워크, 4G 및 5G 독립 네트워킹 네트워크를 보유하고 있습니다. 현재 5G에서는 91만 6,000개의 기지국이 건설되고 있으며, 세계 5G 연결의 70-80% 중 3억 6,500만 이상을 차지하고 있습니다. OTT 서비스 및 고화질 온라인 스트리밍 콘텐츠에 대한 수요가 증가하면서 데이터 소비량이 크게 증가하고 있습니다. 중국에는 넷플릭스는 없지만 Yuoku, Tencent Video, Mango TV, Bilibili 등 현지 OTT 제공업체가 있습니다. 온라인 스트리밍 산업은 2021년 약 340억 달러의 가치를 지니고 있으며, 사용자 수가 증가함에 따라 그 규모는 더욱 커질 것으로 예상됩니다.
- 호주에서는 현재 약 10-12%의 데이터가 중앙 데이터 센터나 클라우드 외부에서 생성 및 처리되고 있지만, 2025년에는 그 수가 65-70%를 넘어설 것으로 예상되며, 이는 전 세계적인 추세로 호주에도 반영되고 있습니다. 코로나19 위기는 호주의 연결성 향상을 위한 디지털 인프라의 필요성이 매우 크다는 점을 강조했습니다. 광선로는 초고속 인터넷 서비스에 대한 수요 증가와 국가 광대역 네트워크(NBN) 프로젝트에 따라 전국적으로 공격적인 광대역 파이버 투 더 엑스(FTTx) 네트워크 확장에 주력하고 있는 정부의 지원으로 2025년까지 지배적인 고정 광대역 기술로 유지될 것으로 예상됩니다.
- 투자 측면에서 보면, 2022년 8월 호주 통신사 Telstra는 독특한 환경적 문제로 유명한 호주 전역에 고용량 데이터 전송 네트워크를 구축하기 위한 노력을 가속화하면서 새로운 전송 네트워크 인프라 롤아웃 파트너와 이중 광케이블을 동시에 설치할 수 있는 Mad Max와 같은 기계를 선정했습니다.
아시아태평양의 데이터센터 시장 동향
5G의 확대와 5G ICT 기술을 위한 기술 기업 및 대학 간의 파트너십 증가가 데이터센터 시장을 견인
- 스마트폰을 통해 액세스하는 클라우드 기반 애플리케이션은 스마트폰 사용자의 증가와 함께 성장하는 주요 시장 트렌드 중 하나입니다. 모바일 광대역 네트워크는 아시아태평양 지역의 96%를 커버하며, 12억 명이 모바일 인터넷 서비스에 접속하고 있습니다. 2021년 스마트폰 보급률은 74%에 달했습니다. 2025년에는 84%까지 증가할 것으로 예상됩니다.
- 890만 개의 모바일 앱이 있으며, 중국이 40%를 소비합니다. 2021년 12월 현재 중국은 442개의 앱을 보유하고 있으며, 모바일 인터넷 사용자의 총 보급률은 94.6%에 달합니다. 인구의 5G 네트워크 도입이 증가함에 따라 5G 지원 디바이스 판매도 증가했습니다.
- 2022년에는 태국 인구의 85% 이상이 5G 서비스를 이용할 수 있을 것으로 예상됩니다. 새로운 파트너십과 개발로 스마트폰의 5G 채택이 증가하고 있습니다. 예를 들어, 2022년 7월 에릭슨과 킹몽꿋공과대학교 톤부리캠퍼스(KMUTT)는 태국 학생들이 미래를 위한 5G ICT 기술을 구축하도록 지원하기 위해 파트너십을 맺었다고 발표했습니다.
다양한 아시아태평양 국가에서 광가입자망/빌딩(FTTH/B) 서비스의 성장이 이 지역의 데이터센터 수요를 견인
- 평균 광대역 인터넷 연결의 최소 다운로드 속도는 25Mbps, 최소 업로드 속도는 3Mbps입니다. 광가입자망/빌딩(FTTH/B) 서비스는 아시아태평양 지역의 선도적인 고정 광대역 기술로서 입지를 확고히 할 것입니다. 싱가포르는 2026년까지 전체 고정 광대역 회선 중 FTTH/B 회선의 비율이 98% 이상으로 이지역에서 가장 높은 점유율을 차지할 것으로 예상됩니다.
- 말레이시아 통신 멀티미디어부 장관에 따르면 구리선 네트워크는 2023년까지 단계적으로 폐지됩니다.
- 호주 통신사 Telstra는 2022년 8월에 듀얼 파이버 케이블을 동시에 설치하기 위해 새로운 인프라 롤아웃 파트너와 Mad Max와 같은 장비를 선정했습니다. 이 사업자는 증가하는 데이터 연결 수요를 충족하기 위해 환경적 문제로 유명한 호주 전역에 고용량 데이터 전송 네트워크를 구축하기 위한 노력을 가속화할 계획입니다. 광케이블 연결은 아시아태평양 지역에서 구리 네트워크의 폐기에 의해 주도되고 있습니다. 구리는 유지 관리 비용이 많이 들고 운영이 어렵습니다.
아시아태평양의 데이터센터 산업 개요
아시아태평양의 데이터센터 시장은 세분화되어 있으며 상위 5개 기업에서 18.04%를 차지하고 있습니다. 이 시장의 주요 업체는 Digital Realty Trust, Inc., Equinix, Inc., KT Corporation, NTT Ltd, STT GDC Pte Ltd(알파벳 순 정렬)입니다.
기타 혜택
- 엑셀 형식 시장 예측(ME) 시트
- 3개월간의 애널리스트 지원
목차
제1장 주요 요약과 주요 조사 결과
제2장 보고서 제안
제3장 소개
- 조사의 전제조건과 시장 정의
- 조사 범위
- 조사 방법
제4장 시장 전망
- IT 부하 용량
- 바닥면적
- 코로케이션 수입
- 설치 랙 수
- 랙 공간 이용률
- 해저 케이블
제5장 주요 업계 동향
- 스마트폰 사용자수
- 스마트폰 1대당 데이터 트래픽
- 모바일 데이터 속도
- 광대역 데이터 속도
- 광섬유 접속 네트워크
- 규제 프레임워크
- 호주
- 중국
- 홍콩
- 인도
- 인도네시아
- 일본
- 말레이시아
- 뉴질랜드
- 필리핀
- 싱가포르
- 한국
- 대만
- 태국
- 베트남
- 밸류체인 및 유통채널 분석
제6장 시장 세분화
- 데이터센터 규모
- 대규모
- 초대규모
- 중규모
- 메가규모
- 소규모
- Tier 유형
- Tier 1 및 2
- Tier 3
- Tier 4
- 흡수량
- 비이용
- 이용
- 코로케이션 유형별
- 하이퍼스케일
- 소매
- 도매
- 최종 사용자별
- BFSI
- 클라우드
- 전자상거래
- 정부기관
- 제조업
- 미디어 및 엔터테인먼트
- 텔레콤
- 기타 최종 사용자
- 국가명
- 호주
- 중국
- 인도
- 인도네시아
- 일본
- 말레이시아
- 아시아태평양의 다른 국가
제7장 경쟁 구도
- 시장 점유율 분석
- 기업 상황
- 기업 프로파일
- AirTrunk Operating Pty Ltd
- Canberra Data Centers
- Chindata Group Holdings Ltd.
- Digital Realty Trust, Inc.
- Equinix, Inc.
- Keppel DC REIT Management Pte. Ltd.
- KT Corporation
- NEXTDC Ltd
- NTT Ltd.
- Princeton Digital Group
- Space DC Pte Ltd.
- STT GDC Pte Ltd
- 연구 대상 기업 목록
제8장 CEO에 대한 주요 전략적 질문
제9장 부록
- 세계의 개요
- 개요
- Five Forces 분석 프레임워크
- 세계의 밸류체인 분석
- 세계 시장 규모와 DRO
- 출처 및 참고문헌
- 도표 목록
- 주요 인사이트
- 데이터 팩
- 용어집
The Asia-Pacific Data Center Market size is estimated at 20.32 thousand MW in 2025, and is expected to reach 37.58 thousand MW by 2030, growing at a CAGR of 13.08%. Further, the market is expected to generate colocation revenue of USD 18,256 Million in 2025 and is projected to reach USD 40,462.2 Million by 2030, growing at a CAGR of 17.25% during the forecast period (2025-2030).
Tier 3 data center accounted for majority share in terms of volume in 2023; Tier 4 is the fastest-growing segment
- The Tier 3 type has a majority share in Asia-Pacific due to its major advantage. These tiers have high redundancy with multiple paths for power and cooling. Edge and cloud connectivity are expected to boost Tier 3 growth.
- In Australia, the Smart City Strategy developed by Newcastle Council focuses on how Big Data, the Internet of Things, and cloud connectivity can help create more livable and innovative cities. In the endemic phase of COVID-19, cloud computing was widely acknowledged as the foundation of Malaysia's digital journey. Primary providers such as Alibaba Cloud have enabled small businesses to trade as effectively as large enterprises, allowing such businesses to take full advantage of the services.
- The APAC tier 3 type operated at an IT load capacity of 6705.97 MW in 2022. The capacity is expected to grow from 8522.04 MW in 2023 to 13981.5 MW in 2029, registering a CAGR of 8.60%.
- The Tier 4 type is expected to register a CAGR of 20.40%. Developed countries adopt Tier-4 certification to achieve fault tolerance and redundancy. For this reason, Tier 4 zones are adopted even in developing regions. For instance, Supernap Thailand is the only Tier 4 facility in the country.
- The Tier 1 & 2 segment shows the least growth, as more than 70% of all traffic moves from server to server. Modern applications require significantly more data to travel within a data center at faster speeds and are less forgiving about latency.
China, Australia, and India held the majority market share in 2023; India is the fastest-growing country
- China and Australia are the leading countries in Asia-Pacific in terms of the data center market. China has the world's largest optical fiber network, 4G, and 5G independent networking networks. At present, 916,000 base stations have been built in 5G, accounting for more than 365 million of the world's 70% to 80% of 5G connections. The growing demand for OTT services and streaming content online on high-display formats is significantly increasing data consumption. China does not have Netflix but has local OTT providers, such as Yuoku, Tencent Video, Mango TV, and Bilibili. The online streaming industry was worth around USD 34 billion in 2021, which is expected to increase with the growing number of users.
- In Australia, currently, about 10-12% of data is created and processed outside a centralized data center or cloud, but the number is expected to cross 65-70% by 2025, a global trend that is also reflected in Australia. The COVID-19 crisis highlighted that Australia has a great need for digital infrastructure to improve connectivity. Fiber lines are expected to remain the dominant fixed broadband technology through 2025, supported by the rising demand for high-speed Internet services and the government's focus on aggressive fiber to the x (FTTx) network expansions nationwide under the National Broadband Network (NBN) project.
- In terms of investment, in August 2022, the Australian operator Telstra selected new transport network infrastructure rollout partners and Mad Max-like machinery capable of laying dual fiber cables simultaneously as the operator accelerates its efforts to build out high-capacity data transport networks across a country renowned for its distinctive environmental challenges.
Asia-Pacific Data Center Market Trends
Expansion in 5G and rising partnerships among tech companies and universities for 5G ICT skills in the region drive the data centers market
- Cloud-based applications accessed through smartphones are one of the major growing market trends with smartphone users. Mobile broadband networks cover 96% of Asia-Pacific, with 1.2 billion people accessing mobile internet services. In 2021, smartphone adoption reached 74%. It is expected to rise to 84% by 2025. Mobile subscriber penetration is expected to reach 62% in 2025.
- There are 8.9 million mobile apps, and China spends 40%. As of December 2021, China owned 442 apps that achieved a combined penetration rate of 94.6% among mobile internet users. The growing adoption of the 5G network among the population has complemented 5G-enabled device sales. 5G availability, primarily in Southeast Asia, is variable. Countries like Singapore and Indonesia have already seen 5G deployed for some time and continue to innovate use cases for the public and organizations.
- By 2022, 5G coverage was expected to reach over 85% of Thailand's population. With new partnerships and development, 5G adoption in smartphones is increasing. For instance, in July 2022, Ericsson and the King Mongkut University of Technology Thonburi (KMUTT) announced that they partnered to support Thai students in building 5G ICT skills for the future. A wireless alternative to wireline broadband connectivity for homes and businesses is one of the major early 5G use cases, particularly in regions with unserved or underserved broadband markets.
Growth in fiber-to-the-home/building (FTTH/B) service in various Asia-Pacific countries drives the demand for data centers in the region
- An average broadband internet connection has a minimum download speed of 25 Mbps and a minimum upload speed of 3 Mbps. Fiber-to-the-home/building (FTTH/B) service is set to cement its position as Asia-Pacific's leading fixed broadband technology. Singapore is anticipated to have the highest share of FTTH/B lines as a percentage of total fixed broadband lines in the region, with more than 98% by 2026. Singapore will be followed by Vietnam, Hong Kong, and Malaysia.
- According to the Malaysian Minister of Communications and Multimedia, copper networks will be phased out by 2023. The government looks to increase broadband coverage in populated areas by at least five-fold, and they look at about 98% broadband coverage in populated areas with a speed of at least 30 Mbps.
- The Australian operator Telstra selected new infrastructure rollout partners and Mad Max-like machinery to lay dual fiber cables simultaneously in August 2022. The operator intends to accelerate its efforts to build out high-capacity data transport networks across a country renowned for its distinct environmental challenges to meet increasing demands for data connectivity. Fiber connectivity is driven by the decommissioning of copper networks in Asia-Pacific. Copper is expensive to maintain and difficult to operate. Some estimates suggest that compared to fiber networks, legacy copper network maintenance OpEx is 2-7 times greater, energy costs are 3-6 times higher, and network fault rates are 5-10 times greater.
Asia-Pacific Data Center Industry Overview
The Asia-Pacific Data Center Market is fragmented, with the top five companies occupying 18.04%. The major players in this market are Digital Realty Trust, Inc., Equinix, Inc., KT Corporation, NTT Ltd. and STT GDC Pte Ltd (sorted alphabetically).
Additional Benefits:
- The market estimate (ME) sheet in Excel format
- 3 months of analyst support
TABLE OF CONTENTS
1 EXECUTIVE SUMMARY & KEY FINDINGS
2 REPORT OFFERS
3 INTRODUCTION
- 3.1 Study Assumptions & Market Definition
- 3.2 Scope of the Study
- 3.3 Research Methodology
4 MARKET OUTLOOK
- 4.1 It Load Capacity
- 4.2 Raised Floor Space
- 4.3 Colocation Revenue
- 4.4 Installed Racks
- 4.5 Rack Space Utilization
- 4.6 Submarine Cable
5 Key Industry Trends
- 5.1 Smartphone Users
- 5.2 Data Traffic Per Smartphone
- 5.3 Mobile Data Speed
- 5.4 Broadband Data Speed
- 5.5 Fiber Connectivity Network
- 5.6 Regulatory Framework
- 5.6.1 Australia
- 5.6.2 China
- 5.6.3 Hong Kong
- 5.6.4 India
- 5.6.5 Indonesia
- 5.6.6 Japan
- 5.6.7 Malaysia
- 5.6.8 New Zealand
- 5.6.9 Philippines
- 5.6.10 Singapore
- 5.6.11 South Korea
- 5.6.12 Taiwan
- 5.6.13 Thailand
- 5.6.14 Vietnam
- 5.7 Value Chain & Distribution Channel Analysis
6 MARKET SEGMENTATION (INCLUDES MARKET SIZE IN VOLUME, FORECASTS UP TO 2030 AND ANALYSIS OF GROWTH PROSPECTS)
- 6.1 Data Center Size
- 6.1.1 Large
- 6.1.2 Massive
- 6.1.3 Medium
- 6.1.4 Mega
- 6.1.5 Small
- 6.2 Tier Type
- 6.2.1 Tier 1 and 2
- 6.2.2 Tier 3
- 6.2.3 Tier 4
- 6.3 Absorption
- 6.3.1 Non-Utilized
- 6.3.2 Utilized
- 6.3.2.1 By Colocation Type
- 6.3.2.1.1 Hyperscale
- 6.3.2.1.2 Retail
- 6.3.2.1.3 Wholesale
- 6.3.2.2 By End User
- 6.3.2.2.1 BFSI
- 6.3.2.2.2 Cloud
- 6.3.2.2.3 E-Commerce
- 6.3.2.2.4 Government
- 6.3.2.2.5 Manufacturing
- 6.3.2.2.6 Media & Entertainment
- 6.3.2.2.7 Telecom
- 6.3.2.2.8 Other End User
- 6.4 Country
- 6.4.1 Australia
- 6.4.2 China
- 6.4.3 India
- 6.4.4 Indonesia
- 6.4.5 Japan
- 6.4.6 Malaysia
- 6.4.7 Rest of APAC
7 COMPETITIVE LANDSCAPE
- 7.1 Market Share Analysis
- 7.2 Company Landscape
- 7.3 Company Profiles (includes Global Level Overview, Market Level Overview, Core Business Segments, Financials, Headcount, Key Information, Market Rank, Market Share, Products and Services, and Analysis of Recent Developments).
- 7.3.1 AirTrunk Operating Pty Ltd
- 7.3.2 Canberra Data Centers
- 7.3.3 Chindata Group Holdings Ltd.
- 7.3.4 Digital Realty Trust, Inc.
- 7.3.5 Equinix, Inc.
- 7.3.6 Keppel DC REIT Management Pte. Ltd.
- 7.3.7 KT Corporation
- 7.3.8 NEXTDC Ltd
- 7.3.9 NTT Ltd.
- 7.3.10 Princeton Digital Group
- 7.3.11 Space DC Pte Ltd.
- 7.3.12 STT GDC Pte Ltd
- 7.4 LIST OF COMPANIES STUDIED
8 KEY STRATEGIC QUESTIONS FOR DATA CENTER CEOS
9 APPENDIX
- 9.1 Global Overview
- 9.1.1 Overview
- 9.1.2 Porter's Five Forces Framework
- 9.1.3 Global Value Chain Analysis
- 9.1.4 Global Market Size and DROs
- 9.2 Sources & References
- 9.3 List of Tables & Figures
- 9.4 Primary Insights
- 9.5 Data Pack
- 9.6 Glossary of Terms