|
시장보고서
상품코드
1692463
버스용 팬터그래프 충전기 : 시장 점유율 분석, 산업 동향 및 통계, 성장 예측(2025-2030년)Bus Pantograph Charger - Market Share Analysis, Industry Trends & Statistics, Growth Forecasts (2025 - 2030) |
||||||
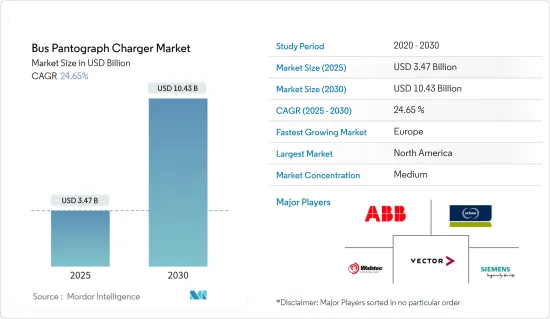
버스용 팬터그래프 충전기 시장 규모는 2025년에 34억 7,000만 달러로 추정되고, 2030년에는 104억 3,000만 달러에 이를 것으로 예측되며, 예측 기간(2025-2030년)의 CAGR은 24.65%를 나타낼 전망입니다.

코로나19로 인해 2020년 상반기 버스용 팬터그래프 충전기 시장은 봉쇄와 제한 조치로 인해 운송 및 기타 관련 부문의 수요가 감소하면서 심각한 영향을 받았습니다. 또한 전기 버스 프로젝트의 지연과 공급망 중단으로 시장 상황이 더욱 악화되었습니다. 그러나 대부분의 자동차 제조업체와 전기차 충전 공급업체는 제한적인 생산과 필요한 조치를 통해 팬터그래프 충전기 생산을 재개했습니다.
중기적으로 팬터그래프 충전기에 대한 수요는 전 세계 주요 국가에서 대중 교통뿐만 아니라 학교 어린이 통학용으로 전기 버스의 채택이 증가함에 따라 증가 할 것으로 예상됩니다.
주요 하이라이트
- 2021년 10월, 호주의 선도적인 버스 제조업체 중 하나인 커스텀 데닝은 지멘스를 선택하여 Sicharge UC 관리 솔루션과 충전소를 제공하기로 결정했습니다.
한, 주요 업체들의 투자와 충전 솔루션 제공업체와 버스 제조업체 간의 전략적 협업이 증가하면서 시장에서 활동하는 업체에게 새로운 기회가 제공될 것으로 예상됩니다.
주요 하이라이트
- 20022년 6월, 캐나다 태평양 경제개발청은 브리티시컬럼비아주 교통 및 인프라부 장관과 협력하여 브리티시컬럼비아주의 대중교통 서비스 개선을 위한 연방 공동 자금으로 3억 1,200만 달러의 투자 계획을 발표했습니다.
북미 지역은 이 지역의 주요 국가에서 전기 버스 도입이 증가함에 따라 예측 기간 동안 상당한 속도로 성장할 것으로 예상됩니다. 또한 중국과 인도는 정부, 대중교통 기관, 기타 친환경 차량 지원 커뮤니티 및 단체의 강력한 장려로 인해 아시이평양 지역의 성장에 기여할 것으로 예상됩니다.
주요 하이라이트
- 2021년 3월, 델리 정부는 시내 버스 차량 수를 늘리기 위해 저상 전기 버스 300대를 새로 구입하는 제안을 승인했습니다. 이 버스는 델리 교통공사에 의해 승인되었습니다. 첫 번째 118대의 버스는 2021년 10월에 도착할 예정이며, 11월에 100대가 추가로 도착할 예정입니다. 전체 배송은 2022년 1월까지 완료될 예정이었습니다.
버스용 팬터그래프 충전기 시장 동향
친환경 버스에 대한 정부의 중요성 증대
디젤 버스는 오늘날 전 세계적으로 널리 사용되고 있습니다. 게다가 이러한 버스는 대부분 인구 밀도가 높은 도시에서 사용되며, 다른 오염 물질로 인해 대기 질이 이미 악화되어 있습니다.
미국 EPA와 NHTSA는 2021년부터 2026년까지 SAFE(Safer Affordable Fuel-Efficient Vehicles) 규칙을 시행하는 것을 제안했습니다. 이 규칙은 승용차 및 상용차에 대한 기업 평균 연비 및 온실가스 배출 기준을 설정할 수 있습니다. OEM은 무공해 차량(ZEV) 프로그램에 따라 일정 수의 청정 무공해 차량(전기, 하이브리드, 연료전지 구동 상용차 및 승용차)을 판매해야 합니다.
인도 정부는 2030년까지 전체 차량 판매량의 30%를 전기화할 계획입니다. 이 전략의 일환으로 인도 정부는 2022년까지 하이브리드 및 전기자동차의 빠른 채택 및 제조(FAME) 프로그램의 2단계에 14억 달러를 투자한다고 발표했습니다. 이 단계에서는 7,090대의 전기 버스에 보조금을 지급하여 인도의 대중교통 및 공유 교통을 전기화하는 데 중점을 둡니다.
또한 대중교통은 대기 질을 개선함으로써 밀집된 도시 지역에서 개인 차량으로 여러 번 이동할 필요성을 줄여 도시의 지속 가능성에 기여합니다.
- 2022년 11월, 런던의 버스 운행회사 메트로라인(Metroline)은 시외 교통을 위해 39대의 전기 2층 버스를 구매한다고 발표했습니다. 북아일랜드의 버스 제조업체인 라이트비우스가 이 버스를 조달했습니다. 이 39대의 버스는 런던의 브렌트, 일링, 해로우, 바넷 자치구와 런던 북쪽 하트퍼드셔의 왓포드를 297번과 142번 노선을 통해 운행될 예정입니다.
- 2022년 3월, 이탈리아 칼리아리에서 최첨단 전기 버스 컨셉이 공개되었으며, 버스 제조업체인 람피니는 주문한 7대의 차량 중 첫 번째 차량을 인도했습니다. 납품된 차량은 팬터그래프가 장착된 6미터 길이의 배터리 전기 버스 6대로 구성되어 있습니다.
가장 빠른 성장을 보일 북미 시장
북미는 예측 기간 동안 시장 성장에 핵심적인 역할을 할 것으로 예상됩니다. 또한 미국은 여러 정부 노력과 전국적으로 전기 스쿨버스의 인기가 높아짐에 따라이 지역의 성장에 주요 기여자 중 하나가 될 것입니다.
- 2021년 6월, 뉴욕전력공사(NYPA)는 뉴욕시의 전기 버스 차량 충전을 위해 뉴욕시 내 여러 역에 67개의 팬터그래프 충전기를 설치하는 3,000만 달러 규모의 계약을 완료했다고 발표했습니다.
- 2021년 3월, 메릴랜드주 몽고메리 카운티 공립학교 시스템은 2025년까지 326대의 스쿨버스 전환을 시작으로 스쿨버스 차량을 완전 전기 차량으로 전환하기 위해 Highland Electric Transportation과 계약을 승인했습니다. 이 계약에 따라 Highland Electric Transportation과 파트너사인 Thomas Built Buses, Proterra, American Bus는 몽고메리 카운티 공립학교 학군에 속한 5개의 버스 차고지 모두에 전기를 공급하고 전기 버스와 충전 인프라를 공급할 예정입니다.
또한, 전기 모빌리티로의 전환이 증가함에 따라 캐나다 정부는 전국적으로 탄소 배출 제로 운송 산업을 구축하기 위해 노력하고 있습니다.
- 2021년 3월, 인프라 및 지역사회부와 혁신과학산업부는 무공해 대중교통 및 스쿨버스 구매를 위한 자금을 포함하여 대중교통 시스템을 개선하고 청정 전력으로 전환하기 위해 2021년부터 5년간 27억 5,000만 캐나다 달러(약 20억 2,000만 달러)의 자금을 지원한다고 발표했습니다.
북미 지역의 이러한 활발한 성장으로 인해 여러 주요 업체 및 전기 버스 인프라 프로젝트 참여자들이 팬터그래프를 채택하고 있으며, 이에 따라 예측 기간 동안 버스 팬터그래프 충전기에 대한 수요가 증가할 것으로 예상됩니다.
- 2022년 3월, ABB는 미국에서 가장 많은 충전기를 배치한 세인트루이스의 새로운 전기 버스 차량에 서비스를 제공한다고 발표했습니다.
따라서 위에서 언급 한 개발 및 사례를 기반으로 북미 지역은 예측 기간 동안 다른 지역에 비해 가장 빠른 성장을 보일 것으로 예상됩니다.
버스용 팬터그래프 충전기 산업 개요
버스용 팬터그래프 충전기 시장의 주요 기업은 ABB Ltd., Wabtec Corporation, Schunk Transit Systems GmBH, BYD 등이 있습니다. 버스용 팬터그래프 충전기 시장은 적당히 통합되어 있으며, 일부 세계적 및 지역적인 기업이 차지하고 있습니다.
- 2022년 6월, 캐나다 인프라 은행과 더럼 지방 자치단체 간에 양해각서가 체결되었는데, 이에 따라 CIB는 최대 5,310만 달러를 투자하여 2027년 말까지 더럼에 납품될 100대의 배터리 전기 버스가 포함된 더럼 지역 대중교통(DRT) 구매 주문을 지원하기로 결정했습니다.
- 2021년 12월, 베를린 교통공사(BVG) 감독위원회는 90대의 전기 버스 추가 구매를 승인했습니다. 이 차량들은 차고지에서 충전할 수 있는 12미터 길이의 배터리 모노플레인으로, 향후 몇 년 동안 전국적으로 사용될 팬터그래프 충전 시스템에 대한 수요가 증가할 것으로 예상됩니다.
위에서 언급한 전기 버스의 발전은 전기 버스용 충전소에 대한 요구 사항을 더욱 높일 수 있습니다.
- 2022년 12월, Solaris Bus & Coach Sp. z o.o.는 라트비아 운영사인 Rgas Satiksme에 35대의 Solaris Urbino 12 전기 버스를 공급하기로 합의했습니다. 이 버스에는 플러그인 커넥터와 인버티드 팬터그래프를 통해 충전할 수 있는 140kWh 용량의 솔라리스 하이 에너지 배터리가 장착될 예정입니다.
기타 혜택
- 엑셀 형식 시장 예측(ME) 시트
- 3개월간의 애널리스트 지원
목차
제1장 서론
- 조사의 전제조건
- 조사 범위
제2장 조사 방법
제3장 주요 요약
제4장 시장 역학
- 시장 성장 촉진요인
- 시장 성장 억제요인
- 업계의 매력도 - Porter's Five Forces 분석
- 신규 참가업체의 위협
- 구매자 및 소비자의 협상력
- 공급기업의 협상력
- 대체품의 위협
- 경쟁 기업간 경쟁 관계의 강도
제5장 시장 세분화
- 충전 부문별
- 레벨 1
- 레벨 2
- 직류 급속 충전
- 부품 부문별
- 하드웨어
- 소프트웨어
- 충전 인프라 부문별
- 오프보드 하향식 팬터그래프
- 온보드 상향식 팬터그래프
- 지역별
- 북미
- 미국
- 캐나다
- 기타 북미
- 유럽
- 독일
- 영국
- 프랑스
- 이탈리아
- 스페인
- 기타 유럽
- 아시이평양
- 인도
- 중국
- 한국
- 일본
- 기타 아시이평양
- 남미
- 브라질
- 아르헨티나
- 기타 남미
- 중동 및 아프리카
- 사우디아라비아
- 남아프리카
- 기타 중동 및 아프리카
- 북미
제6장 경쟁 구도
- 벤더의 시장 점유율
- 기업 프로파일
- ABB Ltd
- Schunk Transit Systems GmBH
- Wabtech Corporation
- Siemens Mobility
- Vector Informatik GmbH
- SETEC Power
- SCHUNK GmbH & Co. KG
- Valmont Industries, Inc.
- Comeca Group
제7장 시장 기회와 앞으로의 동향
HBR 25.05.15The Bus Pantograph Charger Market size is estimated at USD 3.47 billion in 2025, and is expected to reach USD 10.43 billion by 2030, at a CAGR of 24.65% during the forecast period (2025-2030).
COVID-19 has severely affected the bus pantograph charger market for the first half of the year 2020, as lockdowns and restrictions resulted in reduced demand from transportation and other associated sectors. Furthermore, delays in electric bus projects and supply chain disruptions worsened the situation in the market. However, the majority of the automakers and EV charging providers resumed pantograph charger production with limited production and necessary measures. The sales of electric buses witnessed significant growth since the latter half of the year 2020 and are likely to continue during the forecast period. This is anticipated to drive the market in focus during the forecast period.
Over the medium term, the demand for pantograph chargers is expected to be picked up by the growing adoption of electric buses, not only for transit but also for school children's transportation across major countries in the world. Furthermore, growing government investments and their focus on improving charging infrastructure are expected to drive demand in the market during the forecast period. Moreover, a new development in the charging station market by the companies is also expected to support the growth. For instance,
Key Highlights
- In October 2021, Custom Denning, one of Australia's leading bus manufacturers, chose Siemens to provide its Sicharge UC management solution and charging stations. The technology, which is currently being tested, will aid the manufacturer's upcoming electric buses. It can operate at up to 1,000 volts and has a power range of 50 to 600 kW.
In addition, investments from the key players and growing strategic collaborations between charging solution providers and bus manufacturers are anticipated to offer new opportunities for players operating in the market. There is a surge in the utilization of electric bus charging systems owing to the decreasing cost of batteries. The growing efforts to reduce greenhouse gas (GHG) emissions, along with the rise in favorable government regulations, are likely to enhance the growth of the market over the forecast period. For instance,
Key Highlights
- In June 2022, the Pacific Economic Development Agency of Canada, in collaboration with British Columbia's Minister of Transportation and Infrastructure, announced a USD 31,2 million investment plan under their joint federal funding for improving public transportation services in British Columbia. The upgrade includes the construction of new transit interchanges as well as the electrification of the bus fleet.
North American region is expected to grow at a significant rate during the forecast period owing to the rising adoption of electric buses across major countries in the region. Furthermore, China and India are expected to contribute to growth in the Asia-Pacific region owing to strong encouragement from the governments, transit agencies, as well as other green vehicle-supporting communities and organizations.
Key Highlights
- In March 2021, the Delhi government approved a proposal to purchase 300 new low-floor electric (AC) buses to increase the city's bus fleet. These buses have been accepted by the Delhi Transport Corporation. The first batch of 118 buses was scheduled to arrive in October 2021, with another 100 following in November. The entire delivery was supposed to be finished by January 2022.
Pantograph Bus Charger Market Trends
Rising Emphasis of Government on Eco-Friendly Buses
Diesel buses are widely used today all over the world. Furthermore, these buses are mostly used in densely populated cities, where air quality has already been degraded by other pollutants. As a result, governments across the world are focusing on developing a variety of regulations and supportive policies aimed at encouraging environmentally friendly transportation.
The EPA and NHTSA in the United States proposed implementing the Safer Affordable Fuel-Efficient (SAFE) vehicles rule from 2021 to 2026. The rule may establish corporate average fuel economy and greenhouse gas emissions standards for passenger and commercial vehicles. OEMs are required to sell a certain number of clean and zero-emission vehicles (electric, hybrid, and fuel cell-powered commercial and passenger vehicles) under the Zero-emission Vehicles (ZEV) Program. The country's ZEV plan aims to put 12 million ZEVs (including buses) on the road by 2030.
The Indian government intends to electrify 30% of total vehicle sales by 2030. As part of this strategy, the government announced a USD 1.4 billion investment in phase two of the FAME (Faster Adoption and Manufacturing of Hybrid and Electric Vehicles) program through 2022. This phase focuses on electrifying public and shared transportation in India by subsidizing 7090 electric buses. This has prompted fleet operators to switch to electric buses.
Moreover, by improving air quality, public transportation contributes to the sustainability of a city in dense urban areas, reducing the need for multiple separate trips by private vehicle. Because of these advantages, governments around the world are actively promoting sustainable and efficient public bus transportation services, which are expected to create positive momentum in the market. For instance,
- In November 2022, Metroline, a potential London bus operator, announced the purchase of 39 electric double-decker buses for intercity transit. Wrightbius, a Northern Irish bus manufacturer, procured these buses. These 39 buses are expected to travel through the London boroughs of Brent, Ealing, Harrow, and Barnet, as well as Watford in Hertfordshire, north of London, on the 297 and 142 routes. The buses have charging capabilities of up to 300 kW via CCS or 420 kW via pantographs.
- In March 2022, a cutting-edge electric bus concept was unveiled in Cagliari, Italy, where bus manufacturer Rampini delivered the first of seven vehicles ordered. The delivery consists of six 6-meter battery-electric buses with pantographs. This new technology in European buses has been identified, and it has generated a lot of interest in the medium term.
North America Likely to Have Fastest Growth in the Market
North America is expected to play a key role in the growth of the market over the forecast period. Furthermore, the United States is likely to be one of the major contributors to growth in the region, owing to several government initiatives and the growing popularity of electric school buses across the country. The demand for electric buses across the North American region is anticipated to be supported by the growing adoption of governments, municipalities, etc. For instance,
- In June 2021, the New York Power Authority (NYPA) announced the completion of a USD 30 million agreement to install 67 pantograph chargers across various stations in the city to charge the city's electric bus fleet.
- In March 2021, the Montgomery County Public School system in Maryland approved a contract with Highland Electric Transportation to convert its school bus fleet to a fully electric fleet, beginning with converting 326 school buses through 2025. Based on the contract, Highland Electric Transportation and its partners, Thomas Built Buses, Proterra, and American Bus, will electrify all five bus depots belonging to the Montgomery County Public School district and supply electric buses and charging infrastructure.
Moreover, with the increasing transition to electric mobility, the Canadian government is also working to build a net-zero emissions transportation industry across the country. For instance,
- In March 2021, the Infrastructure and Communities Ministry and the Ministry of Innovation, Science, and Industry announced CAD 2.75 billion (~USD 2.02 billion) in funding over five years, beginning in 2021, to improve public transportation systems and transition them to cleaner electrical power, including funding for the purchase of zero-emission public transportation and school buses.
Such active growth in the North American region is encouraging several key players and the players in electric bus infrastructure projects to adopt pantographs, thus driving demand for bus pantograph chargers over the forecast period. For instance,
- In March 2022, ABB announced that it is offering its services to St. Louis's new electric bus fleet with the largest deployment of chargers in the United States. ABB's sequential charging system consists of 20 plug-in depot chargers with 150 kW of power and three additional pantograph chargers.
Therefore, based on the above-mentioned developments and instances, it is estimated that the North American region is likely to have the fastest growth compared to its counterparts over the forecast period.
Pantograph Bus Charger Industry Overview
Some of the leading electric bus charging infrastructure market players are ABB Ltd., Wabtec Corporation, Schunk Transit Systems GmBH, BYD, and others. The bus pantograph charger market is moderately consolidated and accounts for several global and regional players. Product innovation, joint ventures, acquisitions of smaller players, and product launches are the key strategies deployed by the major players. Moreover, initiatives taken by various governments across the world are also supporting the growth of the market. For instance,
- In June 2022, a Memorandum of Understanding was signed between the Canada Infrastructure Bank and the Regional Municipality of Durham, which concluded that CIB would invest up to USD 53.1 million to support Durham Region Transit's (DRT) purchase order, which included 100 battery-electric buses to be delivered to Durham by the end of 2027. The initiative to electrify transit vehicles is a critical step toward meeting the region's climate change commitments over the next 25 years.
- In December 2021, the Berliner Verkehrsbetriebe (BVG) supervisory board approved the purchase of 90 more electric buses. The vehicles are 12-meter-long battery monoplanes that will be charged in the depot, increasing demand for pantograph charging systems to be used across the country in the coming years.
The above-mentioned development in electric buses may further boost the requirement for charging stations for electric buses. Apart from these strategies, bus pantograph chargers are entering into supply agreements with key bus manufacturers and charging station providers to strengthen their position in the market. For instance,
- In December 2022, Solaris Bus & Coach Sp. z o.o. has agreed to supply 35 Solaris Urbino 12 electric buses to Latvian operator Rgas Satiksme. These buses are expected to have Solaris High Energy batteries with a capacity of 140 kWh that will be charged via a plug-in connector as well as an inverted pantograph. The buses will also include an eSConnect system for managing zero-emission bus fleets. This software, created by Solaris experts, provides real-time access to vehicle data as well as the identification of any faults as they occur.
Additional Benefits:
- The market estimate (ME) sheet in Excel format
- 3 months of analyst support
TABLE OF CONTENTS
1 INTRODUCTION
- 1.1 Study Assumptions
- 1.2 Scope of the Study
2 RESEARCH METHODOLOGY
3 EXECUTIVE SUMMARY
4 MARKET DYNAMICS
- 4.1 Market Drivers
- 4.2 Market Restraints
- 4.3 Industry Attractiveness - Porter's Five Forces Analysis
- 4.3.1 Threat of New Entrants
- 4.3.2 Bargaining Power of Buyers/Consumers
- 4.3.3 Bargaining Power of Suppliers
- 4.3.4 Threat of Substitute Products
- 4.3.5 Intensity of Competitive Rivalry
5 MARKET SEGMENTATION (Market Size in Value - USD Million)
- 5.1 By Charging Type
- 5.1.1 Level 1
- 5.1.2 Level 2
- 5.1.3 Direct Current Fast Charging
- 5.2 By Pcomponent Type
- 5.2.1 Hardware
- 5.2.2 Software
- 5.3 By Charging Infrastructure Type
- 5.3.1 Off-board top-down pantograph
- 5.3.2 On-Board Bottom-Up Pantograph
- 5.4 Geography
- 5.4.1 North America
- 5.4.1.1 United States
- 5.4.1.2 Canada
- 5.4.1.3 Rest of North America
- 5.4.2 Europe
- 5.4.2.1 Germany
- 5.4.2.2 United Kingdom
- 5.4.2.3 France
- 5.4.2.4 Italy
- 5.4.2.5 Spain
- 5.4.2.6 Rest of Europe
- 5.4.3 Asia-Pacific
- 5.4.3.1 India
- 5.4.3.2 China
- 5.4.3.3 South Korea
- 5.4.3.4 Japan
- 5.4.3.5 Rest of Asia-Pacific
- 5.4.4 South America
- 5.4.4.1 Brazil
- 5.4.4.2 Aegentina
- 5.4.4.3 Rest of the South America
- 5.4.5 Middle East and Africa
- 5.4.5.1 Saudi Arabia
- 5.4.5.2 South Africa
- 5.4.5.3 Rest of the Middle East and Africa
- 5.4.1 North America
6 COMPETITIVE LANDSCAPE
- 6.1 Vendor Market Share
- 6.2 Company Profiles
- 6.2.1 ABB Ltd
- 6.2.2 Schunk Transit Systems GmBH
- 6.2.3 Wabtech Corporation
- 6.2.4 Siemens Mobility
- 6.2.5 Vector Informatik GmbH
- 6.2.6 SETEC Power
- 6.2.7 SCHUNK GmbH & Co. KG
- 6.2.8 Valmont Industries, Inc.
- 6.2.9 Comeca Group