|
시장보고서
상품코드
1693410
미국의 건설용 접착제 및 실란트 시장 : 시장 점유율 분석, 산업 동향 및 통계, 성장 예측(2025-2030년)United States Construction Adhesives & Sealants - Market Share Analysis, Industry Trends & Statistics, Growth Forecasts (2025 - 2030) |
||||||
미국의 건설용 접착제 및 실란트 시장 규모는 2024년에 30억 8,000만 달러로 추정되고, 2028년에는 38억 5,000만 달러에 이를 전망이며, 예측 기간인 2024-2028년 CAGR 5.76%로 성장할 것으로 예측됩니다.

2028년까지 신축이 71억 평방 피트에 달하기 때문에 접착제 및 실란트에 대한 높은 수요가 향후 수년간 전망됩니다.
- 수지는 특정 용도에 사용할 수 있는 접착제에 내자외선성, 내열성, 인장 강도 등의 필요한 물리적 및 화학적 특성을 부여합니다. 신축은 2021년 56억 평방 피트에서 2022년에는 58억 평방 피트로 성장한 것으로 평가되었습니다.
- 건축용 접착제 및 실란트는 경기 회복, 원재료 공급 규칙화, 2020년 COVID-19 팬데믹의 영향을 받은 미국의 생산 시설 재개를 통해 2021년에는 수량으로 5.12%의 급성장을 기록했습니다. 팬데믹 기간 동안 미국 전역에서 봉쇄가 진행되어 생산 설비가 중단되고 접착제 소비가 감소했습니다.
- 이들 접착제는 다양한 수지로 구분되며, 그 중에서도 폴리우레탄계와 아크릴 수지계의 접착제가 건설 용도로 널리 사용되고 있습니다. 이러한 접착제는 구조용 접착제로 알려져 있으며 5-8N/mm2의 범위에서 높은 인장 강도를 발휘합니다. 이 접착제는 장식 바닥재와 세라믹 타일의 접착, 금속 부품의 콘크리트 봉입, 도어 프레임 벽돌에 대한 접착, 기타 많은 용도에 사용되고 있습니다.
- 미국은 주택 및 비주택 건축에 대한 수요가 증가함에 따라 2021년 북미 시장의 거의 70%를 차지했으며, 건축용 접착제 및 실란트 소비량이 가장 많았습니다. 이 나라의 신축 및 건설은 2028년까지 71억 평방 피트에 달할 것으로 예상되고 있어 예측 기간 중에 건설용 접착제 및 실란트 수요를 견인합니다.
미국의 건설용 접착제 및 실란트 시장 동향
2022-2026년 72억 5,000만 달러를 투자하는 '미국 재건을 위한 인프라(INFRA)' 프로그램 등 정부 투자로 국내 건설 증가
- 미국은 북미에서 가장 큰 건설국입니다. 이 나라의 1인당 GDP는 2만 5,350달러로, 2022년에는 전년 대비 3.7%의 성장을 이뤘습니다. 건설 산업은 미국 GDP의 4.2% 가까이를 차지하고 있습니다. 미국 건설 산업에 영향을 미치는 요인은 신규 투자, 주택 및 비주택 건설, 정부 정책 등입니다.
- 공공 부문 건설 지출은 2020년 3,612억 달러에 비해 2021년 3,463억 달러로 감소했습니다. 그러나 민간 부문의 건설 지출은 2021년에 증가했으며, 2020년 1조 1,079억 달러에 비해 2021년에는 1조 2,454억 달러에 달했습니다.
- 1월 건축허가로 인한 민간주택을 포함한 주택 건설은 계절 조정된 연율 189.9만 호였습니다. 이는 12월 개정치 188.5만 호를 0.7% 웃돌았고, 2021년 1월 188.3만 호를 0.8% 웃돌았습니다.
- 2022년 3월 미국 운수성(USDOT)은 미국 재건을 위한 인프라(INFRA) 프로그램에 의해 2022-2026년 72억 5,000만 달러를 전주 및 지역에 분배해, 국가 또는 지역에서 중요한 복합 일관 수송화물 및 고속도로 프로젝트를 건설한다고 발표했습니다. 이러한 요인들로 인해 예측 기간 동안 미국의 건설 활동은 활발해질 것으로 예상됩니다.
미국의 건설용 접착제 및 실란트 산업 개요
미국의 건설용 접착제 및 실란트 시장은 세분화되어 있으며 상위 5개사에서 34.57%를 차지하고 있습니다. 이 시장의 주요 기업은 다음과 같습니다. 3M, H.B. Fuller Company, Henkel AG & Co. KGaA, RPM International Inc. and Sika AG(알파벳순 정렬)
기타 혜택
- 엑셀 형식 시장 예측(ME) 시트
- 3개월의 애널리스트 서포트
목차
제1장 주요 요약 및 주요 조사 결과
제2장 보고서 제안
제3장 서문
- 조사의 전제조건 및 시장 정의
- 조사 범위
- 조사 방법
제4장 주요 산업 동향
- 최종 사용자 동향
- 건축 및 건설
- 규제 프레임워크
- 미국
- 밸류체인 및 유통 채널 분석
제5장 시장 세분화
- 수지별
- 아크릴
- 시아노아크릴레이트
- 에폭시
- 폴리우레탄
- 실리콘
- VAE 및 EVA
- 기타 수지
- 기술별
- 핫멜트
- 반응성
- 실란트
- 용제형
- 수성
제6장 경쟁 구도
- 주요 전략적 움직임
- 시장 점유율 분석
- 기업 상황
- 기업 프로파일
- 3M
- Arkema Group
- Dow
- HB Fuller Company
- Henkel AG & Co. KGaA
- Huntsman International LLC
- Illinois Tool Works Inc.
- MAPEI SpA
- RPM International Inc.
- Sika AG
제7장 CEO에 대한 주요 전략적 질문
제8장 부록
- 세계의 접착제 및 실란트 산업의 개요
- 개요
- Porter's Five Forces 분석 프레임워크(산업 매력도 분석)
- 세계의 밸류체인 분석
- 성장 촉진요인, 억제요인 및 기회
- 정보원 및 참고문헌
- 도표 일람
- 주요 인사이트
- 데이터 팩
- 용어집
The United States Construction Adhesives & Sealants Market size is estimated at 3.08 billion USD in 2024, and is expected to reach 3.85 billion USD by 2028, growing at a CAGR of 5.76% during the forecast period (2024-2028).
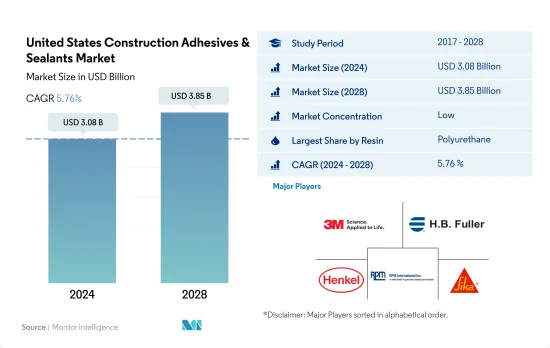
High demand for adhesives and sealants is expected in the coming years with new construction reaching 7.1 billion square feet by 2028
- Resins impart the required physical and chemical properties such as UV resistance, heat resistance, and tensile strength in the adhesives that can be used in specific applications. New construction is expected to grow to 5.8 billion square feet in 2022 from 5.6 billion in 2021.
- The construction adhesives and sealants recorded a sudden growth of 5.12% in volume in 2021 due to the economic recovery, regularization of raw materials supply, and reopening of production facilities in the United States, which the COVID-19 pandemic impacted in 2020. During the pandemic, lockdowns across the country caused the shutdown of production facilities and a decline in the consumption of adhesives.
- These adhesives are segmented into different resins, of which polyurethane and acrylic resin-based adhesives are widely used in construction applications. These adhesives are known as structural adhesives, which offer high tensile strength in the range of 5 to 8 N/mm2. They are used in construction to bond decorative floor coverings and ceramic tiles adhesives, seal metal parts into concrete, bond a door frame into masonry, and many other applications.
- The United States accounts for the highest consumption of construction adhesives and sealants, accounting for nearly 70% of the North American market in 2021 because of the rising demand for residential and non-residential construction. The new building and constructions in the country are expected to reach 7.1 billion square feet by 2028 and, thus, drive the demand for construction adhesives and sealants over the forecast period.
United States Construction Adhesives & Sealants Market Trends
Government's' investments such as the Infrastructure for Rebuilding America (INFRA) program of USD 7.25 billion for FY 2022-2026 to increase construction in the country
- The United States is the largest country for construction activities in the North American region. The country had a GDP of USD 25,350 per capita, with an expected growth rate of 3.7% Y-o-Y in 2022. The construction industry contributes nearly 4.2% of the US GDP. The factors affecting the US construction industry are new investments, residential & non-residential constructions, government policies, and others.
- Public sector construction spending declined in 2021, recording USD 346.3 billion compared to USD 361.2 billion in 2020. However, the private sector construction spending increased in 2021 and was valued at USD 1,245.4 billion in 2021 compared to USD 1107.9 billion in 2020.
- The residential house construction, including privately-owned housing units authorized by building permits in January, was at a seasonally adjusted annual rate of 1,899,000. This was 0.7% above the revised December rate of 1,885,000 and 0.8% above the January 2021 rate of 1,883,000.
- In March 2022, the US Department of Transportation (USDOT) announced that the Infrastructure for Rebuilding America (INFRA) program would distribute USD 7.25 billion for FY 2022-2026 to all states and regions to build multimodal freight and highway projects of national or regional significance. These factors are expected to boost construction activities in the United States over the forecast period.
United States Construction Adhesives & Sealants Industry Overview
The United States Construction Adhesives & Sealants Market is fragmented, with the top five companies occupying 34.57%. The major players in this market are 3M, H.B. Fuller Company, Henkel AG & Co. KGaA, RPM International Inc. and Sika AG (sorted alphabetically).
Additional Benefits:
- The market estimate (ME) sheet in Excel format
- 3 months of analyst support
TABLE OF CONTENTS
1 EXECUTIVE SUMMARY & KEY FINDINGS
2 REPORT OFFERS
3 INTRODUCTION
- 3.1 Study Assumptions & Market Definition
- 3.2 Scope of the Study
- 3.3 Research Methodology
4 KEY INDUSTRY TRENDS
- 4.1 End User Trends
- 4.1.1 Building and Construction
- 4.2 Regulatory Framework
- 4.2.1 United States
- 4.3 Value Chain & Distribution Channel Analysis
5 MARKET SEGMENTATION (includes market size in Value in USD and Volume, Forecasts up to 2028 and analysis of growth prospects)
- 5.1 Resin
- 5.1.1 Acrylic
- 5.1.2 Cyanoacrylate
- 5.1.3 Epoxy
- 5.1.4 Polyurethane
- 5.1.5 Silicone
- 5.1.6 VAE/EVA
- 5.1.7 Other Resins
- 5.2 Technology
- 5.2.1 Hot Melt
- 5.2.2 Reactive
- 5.2.3 Sealants
- 5.2.4 Solvent-borne
- 5.2.5 Water-borne
6 COMPETITIVE LANDSCAPE
- 6.1 Key Strategic Moves
- 6.2 Market Share Analysis
- 6.3 Company Landscape
- 6.4 Company Profiles (includes Global Level Overview, Market Level Overview, Core Business Segments, Financials, Headcount, Key Information, Market Rank, Market Share, Products and Services, and Analysis of Recent Developments).
- 6.4.1 3M
- 6.4.2 Arkema Group
- 6.4.3 Dow
- 6.4.4 H.B. Fuller Company
- 6.4.5 Henkel AG & Co. KGaA
- 6.4.6 Huntsman International LLC
- 6.4.7 Illinois Tool Works Inc.
- 6.4.8 MAPEI S.p.A.
- 6.4.9 RPM International Inc.
- 6.4.10 Sika AG
7 KEY STRATEGIC QUESTIONS FOR ADHESIVES AND SEALANTS CEOS
8 APPENDIX
- 8.1 Global Adhesives and Sealants Industry Overview
- 8.1.1 Overview
- 8.1.2 Porter's Five Forces Framework (Industry Attractiveness Analysis)
- 8.1.3 Global Value Chain Analysis
- 8.1.4 Drivers, Restraints, and Opportunities
- 8.2 Sources & References
- 8.3 List of Tables & Figures
- 8.4 Primary Insights
- 8.5 Data Pack
- 8.6 Glossary of Terms