


|
시장보고서
상품코드
1693416
유럽의 에폭시 접착제 시장 : 시장 점유율 분석, 산업 동향 및 통계, 성장 예측(2025-2030년)Europe Epoxy Adhesive - Market Share Analysis, Industry Trends & Statistics, Growth Forecasts (2025 - 2030) |
||||||
■ 보고서에 따라 최신 정보로 업데이트하여 보내드립니다. 배송일정은 문의해 주시기 바랍니다.
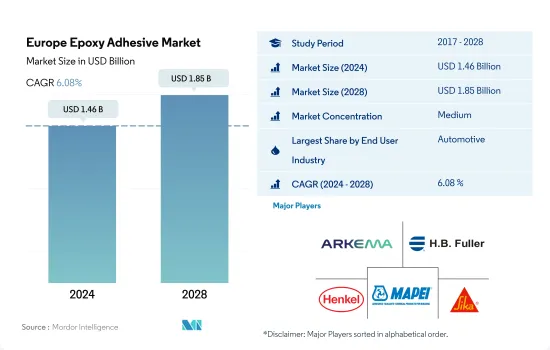
유럽의 에폭시 접착제 시장 규모는 2024년에 14억 6,000만 달러로 평가되었고, 2028년에는 18억 5,000만 달러에 이를 전망이며, 예측 기간(2024-2028년) 중 CAGR 6.08%를 나타낼 것으로 예측됩니다.

자동차 용도에서 에폭시 접착제의 사용 증가가 시장 성장 가속
- 에폭시 접착제는 열경화성 수지이며, 경화시 높은 강도와 낮은 수축률을 나타냅니다. 이러한 접착제는 강인하고 화학 약품이나 환경 손상에 내성이 있습니다. 또한 에폭시 접착제는 다양한 기재에 대한 우수한 접착성, 우수한 내용제성, 양호한 전기 절연성을 제공합니다.
- 에폭시 접착제의 소비량은 주로 독일, 이탈리아, 프랑스, 영국 등 많은 국가에서 COVID-19의 악영향으로 인해 2020년에는 2019년 대비 12% 축소되었습니다. 이들 국가에서는 조업 중단, 공급망 혼란, 경기 둔화 때문에 생산이 방해받았고, 그 결과 에폭시 접착제 소비도 감소했습니다. 더욱이 이들 국가의 경기 회복으로 2021년 에폭시 접착제 생산량이 증가해 수량 기준 8% 성장을 기록했습니다.
- 이 지역의 에폭시 접착제 시장 점유율은 독일이 21% 가까이로 가장 높고, 프랑스, 러시아가 이에 이어지고 있습니다. 이 동향은 자동차 산업과 건설 산업으로부터의 수요가 끊임없이 증가하고 있기 때문에, 향후 수년간 계속될 것으로 전망됩니다. 자동차 산업은 전기차 생산의 증가로 이 지역에서 에폭시 접착제의 최대 소비 산업이 되고 있습니다. 에폭시 접착제는 주로 구조 용도로 사용되며 금속, 유리, 플라스틱을 접착하는 다른 수지계 접착제 중 가장 높은 인장 강도, 약 35-41N/mm2를 부여합니다. 그러나 전자 및 전기기기, 기관차, 선박 등 주요 분야에서의 용도가 증가하고 있어 2028년 말에는 다른 최종 사용자 산업이 수량 기준으로 주요 시장 점유율을 차지할 가능성이 높습니다. 이러한 동향은 향후 수년간 에폭시 접착제의 수요를 견인할 것으로 보입니다.
자동차 산업에서 에폭시 접착제의 사용 증가가 시장 성장 가속
- 에폭시 접착제는 현저한 접착성, 물리적 특성 및 손상 내성으로 인해 가장 널리 사용되는 재료 중 하나입니다. 에폭시 수지의 대부분은 비스페놀A 글리시딜 에테르 등의 석유화학 제품에서 파생되고 있습니다. 그 필수 성분은 재생 불가능하며, 최종 제품은 가장 온화한 조건 하에서도 분해 및 재활용이 불가능하여 심각한 폐기물 오염으로 이어집니다. 물과 증기는 다른 매트릭스 재료보다 내식성이 높기 때문에 에폭시 접착제 화합물에 미치는 영향이 적습니다. 주요 단점은 비교적 비싸다는 점, 경화 기간이 길다는 점, 취급이 어렵다는 점입니다. 최근 대두유에서 제조되는 그린 에폭시 접착제의 제조가 새로운 연구에 의해 도입되었습니다. 이러한 접착제는 지속 가능한 특성으로 인해 더 높은 채택이 예상되며, 그 결과 향후 몇 년간 수요가 급증할 수 있습니다.
- 에폭시 수지의 최대 제조업체인 올린 코퍼레이션은 독일의 슈타데 공장에서 에폭시 수지 일관 생산의 일시적 축소를 발표했습니다. 2022년 2분기, 올림은 유럽의 에폭시 수지 수요가 예상을 밑돌았고, 러시아의 우크라이나 침공에 따른 불확실성으로 인해 악화되었습니다. 이 요인으로 인해 이 지역에서 에폭시 접착제의 생산이 감소하고 또한 입수도 제한되어 결과적으로 이 지역 전체 에폭시 접착제의 가격이 상승하였습니다.
- 모든 최종 용도 분야에 있어서, 자동차는 세계적으로 에폭시의 주요 소비자이며, 약 27.4%의 점유율을 차지하고, 이어서 건축 및 건설, 헬스케어, 항공우주, 목공이 각각 약 16.2%, 12.3%, 9.1%, 9%의 점유율을 차지하고 있습니다.
유럽의 에폭시 접착제 시장 동향
전기차 보급을 위한 정부의 지원책이 업계 규모 확대
- 유럽의 1인당 GDP는 3만 4,230달러로, 2022년의 성장률은 전년대비 1.6%입니다. 자동차 산업 부문이 GDP 전체에서 차지하는 비율은 약 2%입니다. 2021년 유럽의 자동차 생산량은 승용차 81%, 상용차 17%, 기타 2%였습니다.
- 2020년에는 독일, 이탈리아, 스페인, 러시아 등 많은 유럽 국가들이 COVID-19 팬데믹의 영향을 받았습니다. 팬데믹은 공급망의 혼란, 각국에서의 조업 중단, 칩 부족을 초래하여 유럽의 자동차 생산에 영향을 주었습니다. 자동차 생산량은 2019년 대비 22%나 급감했습니다.
- 미국은 유럽에서 25.3% 상당의 자동차를 수입하고 있으며, 2021년에는 독일이 10.3%, 영국이 4.7%를 차지하는 주요 수입국 중 하나가 되었습니다. 2022년 초 러시아의 우크라이나 침공으로 신차 판매가 20.5% 감소하고 자동차 생산에도 반영되었습니다. 2022년 1분기 유럽 자동차 시장은 전년 동기 대비 10.6% 감소했습니다.
- 자동차 생산 대수는 많은 유럽 국가들이 전기자동차에 새로운 투자를 하고 있기 때문에 예측 기간(2022-2027년) 중 CAGR 2.25%로 성장할 가능성이 높습니다. 예를 들어, 스페인은 전기차 생산에 51억 달러를 투자할 예정입니다.
신축의 급증과 개축 요구의 고조가 업계를 견인합ㄴ다.
- 2020년의 건설업 전체의 수익은 COVID-19에 의한 팬데믹 상황의 영향에 의해 급감했습니다.
- 유럽의 건설 부문 전체 매출은 엄청난 성장을 보였으며, 2021년 전년 대비 성장률은 2020년에 비해 가장 높았습니다. 이것은, '차세대 EU'라고 이름 붙여진 코로나 부흥 계획아래, 전 분야에 7,500억 유로를 투입하는 등의 EU위원회의 대처나 대책이 주효했기 때문입니다. 차세대 EU 계획에서는 건축물의 그린화와 디지털화라는 유럽의 목표가 기존 건축물과 구조물의 연간 개수율 증가로 이어졌기 때문에 건설 부문이 가장 큰 투자를 받았습니다.
- EUROCONSTRUCT의 보고서에 따르면 EU의 정치적 지역을 기반으로 한 부문 중 중동 유럽의 CAGR은 6.4%, 그 다음 서유럽의 CAGR은 6.1%로 예상됩니다.
- 유럽연합(EU) 및 국가 수준의 정책 입안자는 '건물의 에너지 성능에 관한 지령(Energy Performance of Buildings Directive)'을 비롯한 다양한 정책을 통해 새로운 건물의 건설과 기존 건물의 에너지 효율화를 우선하고 있습니다. 이러한 정책으로 인해 예측 기간 동안 건설 전체의 수익이 증가할 전망입니다.
유럽의 에폭시 접착제 산업 개요
유럽의 에폭시 접착제 시장은 적당히 통합되어 있으며 주요 5개사에서 63.03%를 차지하고 있습니다. 이 시장 주요 기업은 다음과 같습니다. Arkema Group, H.B. Fuller Company, Henkel AG & Co. KGaA, MAPEI S.p.A. and Sika AG(알파벳순 정렬)
기타 혜택
- 엑셀 형식 시장 예측(ME) 시트
- 3개월의 애널리스트 서포트
목차
제1장 주요 요약 및 주요 조사 결과
제2장 보고서 제안
제3장 서문
- 조사의 전제조건 및 시장 정의
- 조사 범위
- 조사 방법
제4장 주요 산업 동향
- 최종 사용자 동향
- 항공우주
- 자동차
- 건축 및 건설
- 신발 및 가죽
- 포장
- 목공 및 건구
- 규제 프레임워크
- EU
- 러시아
- 밸류체인 및 유통 채널 분석
제5장 시장 세분화
- 최종 사용자 산업별
- 항공우주
- 자동차
- 건축 및 건설
- 신발 및 가죽
- 헬스케어
- 포장
- 목공 및 건구
- 기타 최종 사용자 산업
- 기술별
- 반응성
- 용제계
- UV 경화형 접착제
- 수성
- 국가별
- 프랑스
- 독일
- 이탈리아
- 러시아
- 스페인
- 영국
- 기타 유럽
제6장 경쟁 구도
- 주요 전략 동향
- 시장 점유율 분석
- 기업 상황
- 기업 프로파일
- 3M
- Arkema Group
- Beardow Adams
- HB Fuller Company
- Henkel AG & Co. KGaA
- Huntsman International LLC
- Jowat SE
- MAPEI SpA
- Sika AG
- Soudal Holding NV
제7장 CEO에 대한 주요 전략적 질문
제8장 부록
- 세계의 접착제 및 실란트 산업의 개요
- 개요
- Porter's Five Forces 분석 프레임워크(산업 매력도 분석)
- 세계의 밸류체인 분석
- 성장 촉진요인, 억제요인, 기회
- 정보원 및 참고문헌
- 도표 일람
- 주요 인사이트
- 데이터 팩
- 용어집
The Europe Epoxy Adhesive Market size is estimated at 1.46 billion USD in 2024, and is expected to reach 1.85 billion USD by 2028, growing at a CAGR of 6.08% during the forecast period (2024-2028).
Increasing usage of epoxy adhesives in the automotive applications to boost the market growth
- Epoxy adhesives are thermosetting resins that demonstrate high strength and low shrinkage during their curing time. These adhesives are tough and resistant to chemicals and environmental damage. Moreover, epoxy adhesives offer excellent adhesion to various substrates, superior resistance solvents, and good electrical insulation.
- The consumption of epoxy adhesives shrunk by 12% in 2020 compared to 2019, mainly due to the adverse impact of COVID-19 in many countries, including Germany, Italy, France, and the United Kingdom. Production was hampered in these countries owing to the lockdowns, supply chain disruptions, and economic slowdown, which resulted in a decline in the consumption of epoxy adhesives as well. Moreover, the economic recovery in the countries caused to rise in the production of epoxy adhesives in 2021 by registering a growth of 8% in terms of volume.
- Germany has accounted for the highest market share of nearly 21% for epoxy adhesives in the region, followed by France and Russia. The trend will likely continue in the upcoming years owing to the constant growth in demand from the automotive and construction industries. Automotive has witnessed the largest consumer industry of epoxy adhesives in the region owing to the rising electric vehicle production. Epoxy adhesive is mainly used in structural applications and gives the highest tensile strength, around 35-41 N/mm2, among all other resin-based adhesives to bond metal, glass, and plastic. However, the other end-user industries will likely capture the major market share in terms of volume at the end of 2028 due to the rising applications in the major sectors such as electronics and electrical appliances, locomotive, and marine. Such a trend will drive the demand for epoxy adhesives in the coming years.
Increase in usage of epoxy adhesives in the automotive industry to boost the market growth
- Epoxy adhesive is one of the most widely used materials due to its remarkable adhesiveness, physical properties, and damage tolerance. The majority of epoxy resins are derived from petroleum chemicals such as bisphenol A glycidyl ether. Their essential constituents are non-renewable, and the final products are impossible to degrade and recycle under even the mildest conditions, resulting in severe waste contamination. Water and steam have less impact on epoxy adhesive compounds than other matrix materials, as they have higher corrosion resistance. Their main disadvantages are the comparatively high cost, the lengthy cure period, and the difficult handling. Recently, new research introduced the production of green epoxy adhesives, which are produced from soybean oil. These adhesives are expected to witness higher adoption due to their sustainable properties, which as a result, may upsurge their demand over the coming years.
- Olin Corporation, one of the largest producers of epoxy resins, announced the temporary curtailing of its integrated epoxy production at its Stade, Germany, facility. During Q2 2022, Olin experienced weaker epoxy resin demand in Europe than anticipated, exacerbated by uncertainties following the Russian invasion of Ukraine. This factor reduced the production of epoxy adhesives in the region and also limited their availability, which, as a result, has increased the price of epoxy adhesives across the region.
- Across all the end-use sectors, automotive is the leading consumer of epoxy globally, holding a share of about 27.4%, followed by building and construction, healthcare, aerospace, and woodworking, with shares of approximately 16.2%, 12.3%, 9.1%, and 9%, respectively.
Europe Epoxy Adhesive Market Trends
Supportive government initiatives to promote electric vehicles will raise the industry size
- Europe has a GDP of 34,230 USD per capita with a growth rate of 1.6% y-o-y in 2022. The automotive industry sector contributes a percentage of around 2% of the total GDP. The European vehicle production comprises 81% passenger vehicles, 17% commercial vehicles, and 2% other vehicles in 2021.
- In 2020, many European countries were affected by the COVID-19 pandemic, including Germany, Italy, Spain, Russia, and the United Kingdom. The pandemic resulted in supply chain disruptions, lockdowns in the countries, and chip shortages which affected automotive production in Europe. The production of vehicles sharply declined by 22% compared to 2019.
- The United States imports 25.3% worth of cars from Europe and became one of the leading importers of the United States, where Germany accounted for 10.3% and the United Kingdom for 4.7% of total imports of vehicles in the country in 2021. At the beginning of 2022, the sale of the new vehicle dropped by 20.5% due to the invasion of Ukraine by Russia, which reflected in vehicle production as well. In the first quarter of 2022, the European automotive market was down by 10.6% compared to the same period last year.
- Vehicle production is likely to grow with a CAGR of 2.25% during the period (2022 to 2027) due to the new investments being made in electric vehicles by many European countries. For instance, Spain is going to invest USD 5.1 billion in electric vehicle production.
Rapid growth of new construction along with rising need for renovation activities will drive the industry
- The overall revenue of construction showed a steep decrement in 2020 because of the impact of the pandemic situation due to COVID-19, which led to an overall recovery slowdown and social distancing measures on work sites.
- The overall revenue of the construction sector in Europe grew tremendously, with the highest year-on-year growth in 2021 compared to that of 2020 because of the initiatives and measures taken by the EU Commission, such as the infusion of EUR 750 billion for all sectors under the COVID recovery plan named Next Generation EU. Under the Next Generation EU plan, the construction sector received the maximum investment because of the European objective of green and digital transition in buildings which led to growth in the annual renovation rate of existing buildings and structures.
- As per the EUROCONSTRUCT report, among the segments of the European Union based on political geography, Central and Eastern Europe are expected to register a CAGR of 6.4%, followed by Western Europe at a CAGR of 6.1% in 2022-2024.
- The policymakers at European Union and national level are prioritizing the construction of new buildings and conversion of existing buildings to be energy efficient through various policies including Energy Performance of Buildings Directive and others. These policies will lead to an increase in overall revenue for construction in the forecast period.
Europe Epoxy Adhesive Industry Overview
The Europe Epoxy Adhesive Market is moderately consolidated, with the top five companies occupying 63.03%. The major players in this market are Arkema Group, H.B. Fuller Company, Henkel AG & Co. KGaA, MAPEI S.p.A. and Sika AG (sorted alphabetically).
Additional Benefits:
- The market estimate (ME) sheet in Excel format
- 3 months of analyst support
TABLE OF CONTENTS
1 EXECUTIVE SUMMARY & KEY FINDINGS
2 REPORT OFFERS
3 INTRODUCTION
- 3.1 Study Assumptions & Market Definition
- 3.2 Scope of the Study
- 3.3 Research Methodology
4 KEY INDUSTRY TRENDS
- 4.1 End User Trends
- 4.1.1 Aerospace
- 4.1.2 Automotive
- 4.1.3 Building and Construction
- 4.1.4 Footwear and Leather
- 4.1.5 Packaging
- 4.1.6 Woodworking and Joinery
- 4.2 Regulatory Framework
- 4.2.1 EU
- 4.2.2 Russia
- 4.3 Value Chain & Distribution Channel Analysis
5 MARKET SEGMENTATION (includes market size in Value in USD and Volume, Forecasts up to 2028 and analysis of growth prospects)
- 5.1 End User Industry
- 5.1.1 Aerospace
- 5.1.2 Automotive
- 5.1.3 Building and Construction
- 5.1.4 Footwear and Leather
- 5.1.5 Healthcare
- 5.1.6 Packaging
- 5.1.7 Woodworking and Joinery
- 5.1.8 Other End-user Industries
- 5.2 Technology
- 5.2.1 Reactive
- 5.2.2 Solvent-borne
- 5.2.3 UV Cured Adhesives
- 5.2.4 Water-borne
- 5.3 Country
- 5.3.1 France
- 5.3.2 Germany
- 5.3.3 Italy
- 5.3.4 Russia
- 5.3.5 Spain
- 5.3.6 United Kingdom
- 5.3.7 Rest of Europe
6 COMPETITIVE LANDSCAPE
- 6.1 Key Strategic Moves
- 6.2 Market Share Analysis
- 6.3 Company Landscape
- 6.4 Company Profiles (includes Global Level Overview, Market Level Overview, Core Business Segments, Financials, Headcount, Key Information, Market Rank, Market Share, Products and Services, and Analysis of Recent Developments).
- 6.4.1 3M
- 6.4.2 Arkema Group
- 6.4.3 Beardow Adams
- 6.4.4 H.B. Fuller Company
- 6.4.5 Henkel AG & Co. KGaA
- 6.4.6 Huntsman International LLC
- 6.4.7 Jowat SE
- 6.4.8 MAPEI S.p.A.
- 6.4.9 Sika AG
- 6.4.10 Soudal Holding N.V.
7 KEY STRATEGIC QUESTIONS FOR ADHESIVES AND SEALANTS CEOS
8 APPENDIX
- 8.1 Global Adhesives and Sealants Industry Overview
- 8.1.1 Overview
- 8.1.2 Porter's Five Forces Framework (Industry Attractiveness Analysis)
- 8.1.3 Global Value Chain Analysis
- 8.1.4 Drivers, Restraints, and Opportunities
- 8.2 Sources & References
- 8.3 List of Tables & Figures
- 8.4 Primary Insights
- 8.5 Data Pack
- 8.6 Glossary of Terms


샘플 요청 목록