


|
시장보고서
상품코드
1693543
남미의 비료 시장 : 점유율 분석, 산업 동향, 성장 예측(2025-2030년)South America Fertilizers - Market Share Analysis, Industry Trends & Statistics, Growth Forecasts (2025 - 2030) |
||||||
■ 보고서에 따라 최신 정보로 업데이트하여 보내드립니다. 배송일정은 문의해 주시기 바랍니다.
가격
※ 부가세 별도
한글목차
영문목차
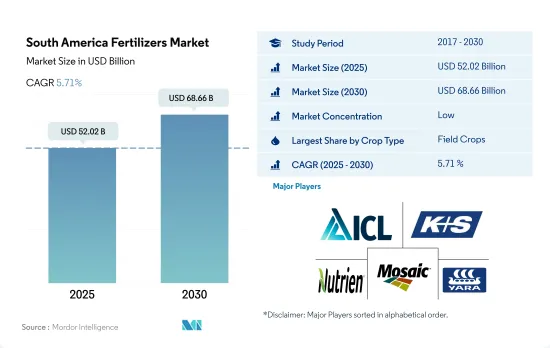
남미의 비료 시장 규모는 2025년에 520억 2,000만 달러, 2030년에는 686억 6,000만 달러에 이를 것으로 예측되며, 예측 기간 중(2025-2030년) CAGR은 5.71%를 나타낼 전망입니다.

기후 패턴 변화와 토양분 부족 증가로 비료시장은 성장세에
- 작물 유형에 따른 비료 시장 전체의 금액은 481억 달러를 차지하고, 2023-2030년의 CAGR은 5.6%를 나타낼 것으로 추정됩니다.
- 작물 유형별로는 농작물이 94.5%를 차지하고, 원예 작물이 5.5%로 계속되고 있습니다.
- 농작물의 재배면적은 2023-2030년의 CAGR로 2.2% 증가하고 있습니다.
- 이에 따라 미국, 칠레, 라틴아메리카 국가 간의 자유무역협정(FTA)이 지난 수십년간 남미 국가의 과일 및 채소 생산 증가의 주요 요인이 되고 있습니다. NAFTA(USMCA), CAFTA-DR, 칠레, 콜롬비아, 파나마, 페루 등의 국가와의 양자간 협정을 포함한 이 FTA는 이 지역의 비료 수요를 더욱 끌어올릴 것으로 예측됩니다.
- 남미의 비료 시장의 성장은 증가하는 수요를 충족하고 작물의 수량과 품질을 향상시키고 생산량을 증가시킬 필요성 등 다양한 요인에 의해 초래되고 있습니다.
콩과 같은 주요 작물의 재배 면적이 많기 때문에 브라질의 비료 소비량은 높은 점유율을 차지하고 있습니다.
- 남미의 국내 비료 소비량의 73.0%를 차지하는 브라질은 비료 사용량으로 이 지역을 리드하고 있습니다.
- 밀과 콩의 세계 수출국인 아르헨티나는 농업이 GDP에 약 5.9% 기여하고 있습니다. 르와 마찬가지로, 프랙티스 비료가 시장의 96.1%를 차지하고, 특수 비료는 3.9%입니다.
- 브라질과 아르헨티나를 제외한 다른 남미는 2022년 비료 시장에서 14.8%의 점유율을 차지했으며, 농작물은 수량 기준으로 83.1% 시장 점유율을 차지했으며, 2022년에는 815만 톤에 이르렀습니다.
- 2022년 남미 비료 시장은 콩, 옥수수, 사탕수수를 포함한 농작물이 시장 점유율의 94.2%를 차지했으며, 압도적인 존재감을 보여주었습니다. 이 작물들은 지난 20년 동안 상당한 성장을 이루고 있으며, 앞으로도 새로운 성장이 예상되고 있습니다.
- 인구 증가와 그에 따른 식량곡물 수요의 급증에 견인되어 남미에서는 주요 식량작물의 재배면적이 일관되게 확대되고 있습니다. 이 동향은 2023-2030년에 걸쳐 이 지역의 비료 시장이 성장할 것으로 예측됨을 보여줍니다.
남미 비료시장 동향
자급자족을 달성하기 위한 정부의 이니셔티브는 농작물의 재배면적 증가에 크게 기여하고 있습니다.
- 남미의 농작물 재배면적은 현저한 증가를 보였으며, 2017년 1억1,160만ha에서 2022년에는 1억2,610만ha로 급증하여 총 면적의 12.8% 증가를 기록했습니다. 이러한 재배 확대는 이 지역의 비료 수요를 끌어올릴 것으로 예측됩니다. 농작물이 시장을 독점하고 96.8%의 큰 점유율을 차지하고 있습니다. 2022년에는 브라질이 56.9%로 최대 점유율을 차지하고 아르헨티나가 29.3%로 이어졌습니다. 대두 생산과 수출의 세계 리더로 알려진 브라질의 대두 생산량은 2021년 약 1억 3,500만 톤에 달했습니다. 그 중 82%를 차지하는 1억 550만 톤이 수출되고, 그 82%는 생콩, 16%는 대두 케이크, 2%는 대두유로 수출됩니다.
- 남미 최대 재배면적을 자랑하는 대두는 주로 브라질(64.4%)과 아르헨티나(26.1%)로 재배되고 있습니다. 그러나 이 지역은 현재 긴 가뭄에 시달리고 있으며 주요 하천의 수위가 위기적으로 떨어지고 있습니다. 이것은 심각한 영향을 미치고 수확과 중요한 여름 작물(특히 콩)의 운송 모두를 방해합니다. 그 결과 이러한 상황은 남미에서 비료 시용량 증가 수요를 증폭시키고 있습니다.
- 왕성한 세계 수요와 양호한 수익성에 힘입어, 메르코수르 지역의 대두 재배는 급증했습니다. 대두 가격의 상승은 다른 원료와 함께, 생산자가 새로운 토지나 설비에 투자 하는 동기부여가 되어 사업의 확대나 효율화를 가능하게 했습니다.
남미의 농작물의 1차 양분 시용량의 평균은 약 172.73kg/헥타르입니다.
- 지난 20년간 남미는 농작물 생산의 주요 담당자로서 대두해 왔습니다. 특히 대두, 옥수수, 밀, 옥수수가 그렇습니다.이러한 생산량 급증은 재배 확대와 수확량 증대를 위한 노력 강화에 기인할 수 있습니다. 특필해야할 것은 브라질과 같은 나라들이 경작 면적을 적극적으로 확대하고 있는 것으로, 작물 생산이 한층 더 증가해, 거기에 따라 비료 소비량도 급증하는 것을 나타내고 있습니다.
- 영양소는 식물의 건강, 작물의 성장, 작물의 생산량에 있어서 매우 중요합니다. 1차 영양소, 즉 질소, 인, 칼륨은 식물의 개발을 위한 기본적인 컴포넌트로서의 역할을 합니다.이러한 영양소의 결핍은 농작물 수확량과 품질에 큰 영향을 미칠 수 있으며, 이는 밭작물의 중요성을 강조합니다. 2022년, 남미의 밭작물에의 주요 영양소의 평균 시용량은 172.7kg/헥타르였습니다. 14.
- 농작물 중에서는 밀, 벼, 옥수수 평균 양분 시용량이 가장 많아질 것으로 예측됩니다. 구체적으로, 밀은 헥타르당 평균 231kg의 영양분 시비율을 보일 것으로 예상되며, 벼는 156kg/ha, 옥수수는 149kg/ha로 추정됩니다. 인구 증가와 그에 따른 주요 식량 작물에 수요에 견인되어, 남미에서는 수확 면적이 확대하고 있습니다.
남미 비료 산업 개요
남미의 비료 시장은 세분화되어 있으며 상위 5개 기업에서 37.12%를 차지하고 있습니다.
기타 혜택
- 엑셀 형식 시장 예측(ME) 시트
- 3개월의 애널리스트 서포트
목차
제1장 주요 요약과 주요 조사 결과
제2장 보고서 제안
제3장 소개
- 조사의 전제조건과 시장 정의
- 조사 범위
- 조사 방법
제4장 주요 산업 동향
- 주요 작물의 작부 면적
- 밭작물
- 원예작물
- 평균 양분 시용률
- 미량 영양소
- 밭작물
- 원예작물
- 1차 영양소
- 밭작물
- 원예작물
- 2차 다량 영양소
- 밭작물
- 원예작물
- 미량 영양소
- 관개 농지
- 규제 프레임워크
- 밸류체인과 유통채널 분석
제5장 시장 세분화
- 유형
- 복합형
- 스트레이트
- 미량 영양소
- 붕소
- 구리
- 철
- 망간
- 몰리브덴
- 아연
- 기타
- 질소
- 질산암모늄
- 우레아
- 기타
- 인산
- DAP
- MAP
- SSP
- TSP
- 기타
- 포타시스
- MoP
- SoP
- 기타
- 2차 영양소
- 칼슘
- 마그네슘
- 유황
- 형태
- 기존
- 특수
- CRF
- 액체 비료
- SRF
- 수용성
- 시비 모드
- 시비
- 잎면 살포
- 토양
- 작물 유형
- 밭작물
- 원예작물
- 잔디 및 관상용
- 생산국
- 아르헨티나
- 브라질
- 기타 남미
제6장 경쟁 구도
- 주요 전략 동향
- 시장 점유율 분석
- 기업 상황
- 기업 프로파일
- Fertgrow
- Grupa Azoty SA(Compo Expert)
- Haifa Group
- ICL Group Ltd
- KS Aktiengesellschaft
- Nortox
- Nutrien Ltd.
- Sociedad Quimica y Minera de Chile SA
- The Mosaic Company
- Yara International ASA
제7장 CEO에 대한 주요 전략적 질문
제8장 부록
- 세계 개요
- 개요
- Five Forces 분석 프레임워크
- 세계의 밸류체인 분석
- 시장 역학(DROs)
- 정보원과 참고문헌
- 도표 일람
- 주요 인사이트
- 데이터 팩
- 용어집
The South America Fertilizers Market size is estimated at 52.02 billion USD in 2025, and is expected to reach 68.66 billion USD by 2030, growing at a CAGR of 5.71% during the forecast period (2025-2030).
The fertilizer market is poised for growth due to shifting climate patterns and rising soil nutrient deficiencies
- The overall fertilizer market value by crop type has accounted for USD 48.1 billion and is estimated to record a CAGR of 5.6% during 2023-2030. By volume, the overall consumption accounted for 64.0 million metric tons and is estimated to record a CAGR of 3.3% during 2023-2030.
- By crop type, field crops are dominating the market by 94.5%, followed by horticultural crops with 5.5% of fertilizer consumption value. Both horticultural and field crops are essential to the country's trade and consumption, and the increased domestic and international demand is bolstering the segment's growth.
- The area under field crop cultivation has increased by a CAGR of 2.2% during 2023-2030. With important crops being cultivated in the country, such as soybean, corn, and wheat, the country is actively importing fertilizers to meet the domestic demand, which is driving the growth of the segments.
- Accordingly, Free trade agreements (FTAs) between the United States, Chile, and several Latin American countries have been a major factor in the increase in fruit and vegetable production in South American countries over the last few decades. These FTAs, including NAFTA (USMCA), CAFTA-DR, and bilateral agreements with countries such as Chile, Colombia, Panama, and Peru, are expected to further boost fertilizer demand in the region.
- The growth of the South American fertilizers market is being driven by various factors, including the need to meet the growing demand, improve crop yield and quality, and increase production. As a result, the market volume is expected to register a CAGR of 3.3% from 2023 to 2030.
Due to higher cultivation areas under major crops like soybeans, fertilizer consumption in Brazil leads to a higher share
- Brazil, accounting for 73.0% of South America's domestic fertilizer consumption, leads the region in fertilizer usage. The Brazilian market is predominantly driven by conventional fertilizers, which held a commanding 95.2% share in 2022. Specialty fertilizers made up the remaining 4.8%.
- Argentina, a global exporter of wheat and soybeans, sees agriculture contributing around 5.9% to its GDP. In 2022, Argentina held a 14.6% share of the South American fertilizer market. Similar to Brazil, conventional fertilizers dominated, capturing 96.1% of the market, while specialty fertilizers accounted for 3.9%. Within the specialty segment, liquid fertilizers led at 44.7%, followed by water-soluble fertilizers at 52.6%.
- The Rest of South America, excluding Brazil and Argentina, held a 14.8% share of the regional fertilizer market in 2022. Field crops, commanding an 83.1% market share by volume, reached 8.15 million metric tons in 2022. Projections indicate this volume will climb to 10.53 million metric tons by 2030, representing a significant growth trajectory.
- Field crops, including soybeans, corn, and sugarcane, dominated the South American fertilizer market in 2022, capturing 94.2% of the market share. These crops have witnessed substantial growth over the past two decades, with further increases expected. Driven by countries like Brazil expanding their cultivated areas and aiming for higher yields, this trend is set to continue.
- Driven by a rising population and the subsequent surge in food grain demand, South America has witnessed a consistent expansion in the area dedicated to major food crops. This trend points to a projected growth in the region's fertilizer market during 2023-2030.
South America Fertilizers Market Trends
The government's initiatives to achieve self-sufficiency have significantly contributed to the increase in the area under field crop cultivation.
- The cultivation area for field crops in South America witnessed a notable rise, surging from 111.6 million ha in 2017 to 126.1 million ha in 2022, marking a 12.8% increase in the total area. This expansion in cultivation is projected to drive up the demand for fertilizers in the region. Field crops dominated the market, accounting for a significant 96.8% share. In 2022, Brazil held the maximum share of the market at 56.9%, with Argentina trailing at 29.3%. Brazil, renowned as the global leader in soy production and exports, saw its soy output reach nearly 135 million tonnes in 2021. Of this, a whopping 105.5 million tonnes, constituting 82%, were exported, with 82% in raw soybean form, 16% as soybean cake, and 2% as soybean oil.
- Soybean, commanding the largest cultivated area in South America, is primarily grown in Brazil (64.4%) and Argentina (26.1%). However, the region is currently grappling with an extended drought, leading to critically low water levels in major rivers. This has severe repercussions, hampering both harvests and the transportation of crucial summer crops, especially soybeans. Consequently, these conditions are amplifying the demand for increased fertilizer application in South America.
- Driven by robust global demand and favorable profitability, soybean cultivation in the Mercosur region witnessed a surge. The surge in soy prices, along with other raw materials, has incentivized producers to invest in new lands and equipment, enabling them to scale up operations and enhance efficiency. As a result, the field crop cultivation area in the region is poised to expand in tandem with the growing domestic and international markets.
The average rate of primary nutrient application for field crops in South America is about 172.73 kg/hectare
- Over the past two decades, South America has emerged as a key player in field crop production, notably for soybeans, corn, wheat, and maize. This surge in production can be attributed to both expanded cultivation and intensified efforts to boost yields. Notably, countries like Brazil are actively expanding their cultivated areas, indicating a further uptick in crop production and a subsequent surge in fertilizer consumption.
- Nutrients are pivotal for plant health, crop growth, and crop output. Primary nutrients, namely nitrogen, phosphorus, and potassium, serve as the fundamental building blocks for plant development. Any deficiency in these nutrients can significantly impact both crop yield and quality, underscoring their importance for field crops. In 2022, the average application rate of primary nutrients for field crops in South America stood at 172.7 kg/hectare. Nitrogen topped the list with an application rate of 193.8 kg/hectare, followed by potassium at 181.9 kg/hectare. Phosphorus trailed slightly behind, with an application rate of 142.4 kg/hectare.
- Among the field crops, wheat, rice, and corn/maize are expected to have the highest average nutrient application rate. Specifically, wheat is projected to have an average nutrient application rate of 231 kg/ha, while rice and corn/maize are estimated to have average rates of 156 kg/ha and 149 kg/ha, respectively. Driven by a growing population and subsequent demand for major food crops, South America has witnessed an expansion in harvested areas. This trend points to a significant uptick in primary nutrient usage for field crops in the region in the coming years.
South America Fertilizers Industry Overview
The South America Fertilizers Market is fragmented, with the top five companies occupying 37.12%. The major players in this market are ICL Group Ltd, K+S Aktiengesellschaft, Nutrien Ltd., The Mosaic Company and Yara International ASA (sorted alphabetically).
Additional Benefits:
- The market estimate (ME) sheet in Excel format
- 3 months of analyst support
TABLE OF CONTENTS
1 EXECUTIVE SUMMARY & KEY FINDINGS
2 REPORT OFFERS
3 INTRODUCTION
- 3.1 Study Assumptions & Market Definition
- 3.2 Scope of the Study
- 3.3 Research Methodology
4 KEY INDUSTRY TRENDS
- 4.1 Acreage Of Major Crop Types
- 4.1.1 Field Crops
- 4.1.2 Horticultural Crops
- 4.2 Average Nutrient Application Rates
- 4.2.1 Micronutrients
- 4.2.1.1 Field Crops
- 4.2.1.2 Horticultural Crops
- 4.2.2 Primary Nutrients
- 4.2.2.1 Field Crops
- 4.2.2.2 Horticultural Crops
- 4.2.3 Secondary Macronutrients
- 4.2.3.1 Field Crops
- 4.2.3.2 Horticultural Crops
- 4.2.1 Micronutrients
- 4.3 Agricultural Land Equipped For Irrigation
- 4.4 Regulatory Framework
- 4.5 Value Chain & Distribution Channel Analysis
5 MARKET SEGMENTATION (includes market size in Value in USD and Volume, Forecasts up to 2030 and analysis of growth prospects)
- 5.1 Type
- 5.1.1 Complex
- 5.1.2 Straight
- 5.1.2.1 Micronutrients
- 5.1.2.1.1 Boron
- 5.1.2.1.2 Copper
- 5.1.2.1.3 Iron
- 5.1.2.1.4 Manganese
- 5.1.2.1.5 Molybdenum
- 5.1.2.1.6 Zinc
- 5.1.2.1.7 Others
- 5.1.2.2 Nitrogenous
- 5.1.2.2.1 Ammonium Nitrate
- 5.1.2.2.2 Urea
- 5.1.2.2.3 Others
- 5.1.2.3 Phosphatic
- 5.1.2.3.1 DAP
- 5.1.2.3.2 MAP
- 5.1.2.3.3 SSP
- 5.1.2.3.4 TSP
- 5.1.2.3.5 Others
- 5.1.2.4 Potassic
- 5.1.2.4.1 MoP
- 5.1.2.4.2 SoP
- 5.1.2.4.3 Others
- 5.1.2.5 Secondary Macronutrients
- 5.1.2.5.1 Calcium
- 5.1.2.5.2 Magnesium
- 5.1.2.5.3 Sulfur
- 5.2 Form
- 5.2.1 Conventional
- 5.2.2 Speciality
- 5.2.2.1 CRF
- 5.2.2.2 Liquid Fertilizer
- 5.2.2.3 SRF
- 5.2.2.4 Water Soluble
- 5.3 Application Mode
- 5.3.1 Fertigation
- 5.3.2 Foliar
- 5.3.3 Soil
- 5.4 Crop Type
- 5.4.1 Field Crops
- 5.4.2 Horticultural Crops
- 5.4.3 Turf & Ornamental
- 5.5 Country
- 5.5.1 Argentina
- 5.5.2 Brazil
- 5.5.3 Rest of South America
6 COMPETITIVE LANDSCAPE
- 6.1 Key Strategic Moves
- 6.2 Market Share Analysis
- 6.3 Company Landscape
- 6.4 Company Profiles
- 6.4.1 Fertgrow
- 6.4.2 Grupa Azoty S.A. (Compo Expert)
- 6.4.3 Haifa Group
- 6.4.4 ICL Group Ltd
- 6.4.5 K+S Aktiengesellschaft
- 6.4.6 Nortox
- 6.4.7 Nutrien Ltd.
- 6.4.8 Sociedad Quimica y Minera de Chile SA
- 6.4.9 The Mosaic Company
- 6.4.10 Yara International ASA
7 KEY STRATEGIC QUESTIONS FOR FERTILIZER CEOS
8 APPENDIX
- 8.1 Global Overview
- 8.1.1 Overview
- 8.1.2 Porter's Five Forces Framework
- 8.1.3 Global Value Chain Analysis
- 8.1.4 Market Dynamics (DROs)
- 8.2 Sources & References
- 8.3 List of Tables & Figures
- 8.4 Primary Insights
- 8.5 Data Pack
- 8.6 Glossary of Terms
