|
시장보고서
상품코드
1693550
미국의 비료 시장 : 점유율 분석, 산업 동향 및 통계, 성장 예측(2025-2030년)United States Fertilizers - Market Share Analysis, Industry Trends & Statistics, Growth Forecasts (2025 - 2030) |
||||||
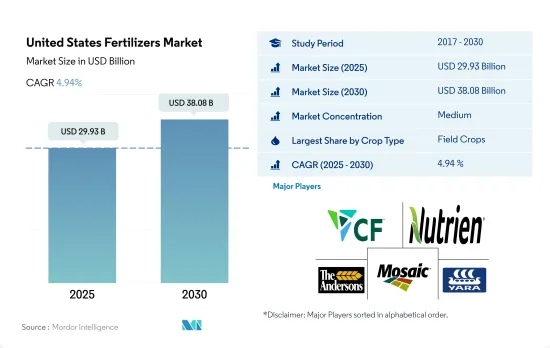
미국의 비료 시장 규모는 2025년 299억 3,000만 달러로 추정되고, 2030년에는 380억 8,000만 달러에 이르고, 예측 기간중(2025-2030년) CAGR 4.94%를 나타낼 것으로 예측됩니다.

재배 면적의 넓이로부터 밭작물이 시장을 독점
- 농작물은 2022년에 87.2%를 차지하며 미국 비료 시장의 주요 점유율을 차지하고 있습니다. 미국에서 2번째로 많이 재배되고 있는 작물은 콩입니다. 옥수수와 같이, 농가는 주로 중서부 주들에서 콩을 재배하고 있습니다.
- 원예작물의 생산은 주로 열개 주에서 행해지고 있으며, 캘리포니아, 플로리다, 오레곤이 매출액이 가장 높습니다.
- 잔디밭과 관상용 작물은 미국 비료 시장의 10.3%를 차지하고 있습니다. 이 시장은 2023년부터 2030년까지 CAGR 4.2%를 나타낼 것으로 예상됩니다.
- 기존 비료는 2022년에 77.8%의 최대 점유율을 차지했습니다.
- 주요 농작물에 대한 수요 증가, 과일과 잔디 재배 면적 확대, 자급 자족을 중시하는 정부 방침이 관상용 꽃의 온실 생산 등 전략 개발로 이어졌습니다.
미국 비료시장 동향
농지가 제한되어 있기 때문에 농업용 투입 자재를 이용하여 농업 생산성을 높일 필요가 있습니다.
- 미국에서는 인구가 2020년 3억 3,590만 명에서 2022년에는 3억 3,820만 명으로 증가합니다. 농지가 제한되어 있기 때문에 농업 투입물을 사용하여 농업 생산성을 높일 필요가 있음을 나타내고 있습니다. 작물의 생산성을 높이기 위해 비료는 오랫동안 사용되어 왔습니다.
- 콩과 옥수수는 미국에서 재배되고 있는 2대 작물입니다. 대부분은 인디애나 주 서부, 일리노이 주, 아이오와 주, 미주리 주, 네브래스카 주 동부, 캔자스 주 동부를 커버하는 "옥수수 벨트"라고 불리는 지역에서 재배되고 있습니다.
- 농업 자재 제조업체는 농가의 정확한 비료 살포를 지원하는 혁신적인 제품을 개발하고 있습니다. 이것에 의해 농가는 재배 효율을 올리면서 비용을 삭감할 수 있습니다.
질소 결핍은 미국의 작물 면적 전체에서 가장 널리 보이는 작물 양분 문제 중 하나입니다.
- 미국 농작산업에서 1차 양분(질소, 칼륨, 인)의 평균 시용량은 약 166.61kg/헥타르입니다.
- 농작물에서는 채소 및 카놀라의 평균 1차 양분 시용량은 284.92kg/헥타르이며, 밭 작물에서 가장 많았습니다.
- 미국에서는 옥수수가 제2위의 농작물이 되고 있으며, 평균 1차 양분 시용량은 245.40 kg/헥타르, 이어서 유채 및 카놀라였습니다. 옥수수의 생산량은 동국의 밭작물 총 생산량의 약 31.44%를 차지하고 있습니다.
- 1차 영양소는 식물 효소의 기능을 향상시키고 식물 세포의 성장을 가속하고 중요한 생화학 적 과정을 촉진하는 데 매우 중요한 역할을 합니다.
미국 비료 산업 개요
미국의 비료 시장은 적당히 통합되어 있으며 상위 5개사에서 57.61%를 차지하고 있습니다. 이 시장 주요 기업은 CF Industries Holdings, Inc., Nutrien Ltd., The Andersons Inc., The Mosaic Company, Yara International ASA입니다(알파벳순).
기타 혜택
- 엑셀 형식 시장 예측(ME) 시트
- 3개월의 애널리스트 서포트
목차
제1장 주요 요약과 주요 조사 결과
제2장 보고서 제안
제3장 소개
- 조사의 전제조건과 시장 정의
- 조사 범위
- 조사 방법
제4장 주요 산업 동향
- 주요 작물의 작부 면적
- 밭 작물
- 원예 작물
- 평균 양분 시용률
- 미량 영양소
- 밭 작물
- 원예 작물
- 1차 영양소
- 밭 작물
- 원예 작물
- 2차 다량 영양소
- 밭 작물
- 원예 작물
- 미량 영양소
- 관개 농지
- 규제 프레임워크
- 밸류체인과 유통채널 분석
제5장 시장 세분화
- 유형
- 복합형
- 스트레이트
- 미량 영양소
- 붕소
- 구리
- 철
- 망간
- 몰리브덴
- 아연
- 기타
- 질소
- 질산암모늄
- 무수 암모니아
- 우레아
- 기타
- 인산
- DAP
- MAP
- SSP
- TSP
- 칼륨
- MoP
- SoP
- 기타
- 2차 영양소
- 칼슘
- 마그네슘
- 유황
- 형태
- 기존
- 특수
- CRF
- 액체 비료
- SRF
- 수용성
- 시비 모드
- 시비
- 엽면 살포
- 토양
- 작물 유형
- 밭작물
- 원예작물
- 잔디 및 관상용
제6장 경쟁 구도
- 주요 전략 동향
- 시장 점유율 분석
- 기업 상황
- 기업 프로파일
- CF Industries Holdings, Inc.
- Haifa Group
- ICL Group Ltd
- Koch Industries Inc.
- Nutrien Ltd.
- Sociedad Quimica y Minera de Chile SA
- The Andersons Inc.
- The Mosaic Company
- Wilbur-Ellis Company LLC
- Yara International ASA
제7장 CEO에 대한 주요 전략적 질문
제8장 부록
- 세계 개요
- 개요
- Porter's Five Forces 분석 프레임워크
- 세계의 밸류체인 분석
- 시장 역학(DROs)
- 정보원과 참고문헌
- 도표 일람
- 주요 인사이트
- 데이터 팩
- 용어집
The United States Fertilizers Market size is estimated at 29.93 billion USD in 2025, and is expected to reach 38.08 billion USD by 2030, growing at a CAGR of 4.94% during the forecast period (2025-2030).
Field crops dominated the market owing to their larger cultivation area
- Field crops hold a major share of the US fertilizer market, as they accounted for 87.2% in 2022. The largest crop in the United States in terms of total production is corn, the majority of which grows in a region known as the Corn Belt. The second-largest crop grown in the United States is soybeans. Like corn, farmers primarily grow soybeans in the Midwestern states.
- Horticulture production primarily occurs in 10 states, with California, Florida, and Oregon leading the country in sales. Conventional fertilizers occupied a maximum share of 77.6% in 2022, followed by specialty fertilizers with 22.4%. The higher share of conventional fertilizers is due to the higher adoption of conventional fertilizers by farmers and their lower prices compared to specialty fertilizers.
- Turf and ornamental crops contribute to 10.3% of the US fertilizer market. The increased use of fertilizers in turf and ornamental plants in the United States is a common trend. This trend is often driven by the desire for well-manicured lawns, gardens, and landscapes. The market is expected to register a CAGR of 4.2% from 2023 to 2030.
- Conventional fertilizers occupied a maximum share of 77.8% in 2022. Conventional fertilizers are often more cost-effective than other alternatives, making them a practical choice for large-scale agriculture and commercial landscaping.
- The rising demand for major field crops, the expansion of cultivated areas for fruits and turf, and the government's emphasis on self-sufficiency have led to the development of strategies like greenhouse production of ornamental flowers. This development is expected to significantly contribute to segmental growth, with a projected CAGR of 4.7% between 2023 and 2030.
United States Fertilizers Market Trends
The limited farmland indicates the need to enhance agricultural productivity by employing agri-inputs
- In the United States, the population increased from 335.9 million in 2020 to 338.2 million in 2022. From 2000, the total farmland area decreased by almost 50 million acres, reaching a total of 893.4 million acres as of 2022. The limited farmland indicates the need to increase agricultural productivity with the use of agri inputs. Fertilizers have been used for a long time to increase the productivity of crops. The four major crops in the United States are corn, cotton, soybean, and wheat, which account for more than 65.7% of the principal crop acreage in 2022.
- Soybean and corn are the two largest crops grown in the United States. In 2022, soybeans had the highest area under cultivation, accounting for 25.8% of the total arable land in the United States, followed by corn at 25.7% and wheat at 11.1%. The majority of these crops are grown in a region known as the "Corn Belt," which covers western Indiana, Illinois, Iowa, Missouri, eastern Nebraska, and eastern Kansas. The production of corn (maize) and soybeans dominates this area. Additionally, the United States is a major exporter of rice, with most of the cultivation happening in four regions, three of which are in the South and one in California, according to the USDA.
- Manufacturers of farm inputs are developing innovative products to assist farmers with the precise application of fertilizers. This helps farmers reduce the cost of cultivation while increasing efficiency. The country's field crops have immense market potential, and with increased government funding and support, they are expected to drive positive growth in crop cultivation in this area.
Nitrogen deficiency is one of the most prevalent crop nutrient problems across cropping areas in the United States
- The average application rate of primary nutrients (nitrogen, potassium, and phosphorus) in the country's field crops industry stands at approximately 166.61 kg/hectare. Nitrogen constitutes 45.93%, potassium accounts for 28.11%, and phosphorus makes up 25.96% of the total primary nutrient application in field crops.
- In field crops, rapeseed/ canola was applied with an average primary nutrient application rate of 284.92 kg/hectare, which is the highest in field crops. In primary nutrients, nitrogen occupies first place with an average application rate of 229.60 kg/hectare. This is because nitrogen is required in large amounts for plant metabolism, and it is a major component of chlorophyll and amino acids.
- In the United States, corn/maize stands as the second-largest field crop, with an average primary nutrient application rate of 245.40 kg/hectare, followed by rapeseed/canola. Corn production constitutes approximately 31.44% of the country's total field crop output. Specifically, corn requires about 50.06% of nitrogen, 23.77% of phosphorus, and 26.17% of potash, making up the lion's share of the total nutrient application.
- Primary nutrients play a pivotal role in enhancing plant enzyme function, bolstering plant cell growth, and facilitating crucial biochemical processes. Any deficiency in these primary nutrients can significantly impact plant health, stunting growth and hampering crop yields. In response, the application of primary nutrients in field crops is expected to rise, driven by the need to meet escalating productivity demands.
United States Fertilizers Industry Overview
The United States Fertilizers Market is moderately consolidated, with the top five companies occupying 57.61%. The major players in this market are CF Industries Holdings, Inc., Nutrien Ltd., The Andersons Inc., The Mosaic Company and Yara International ASA (sorted alphabetically).
Additional Benefits:
- The market estimate (ME) sheet in Excel format
- 3 months of analyst support
TABLE OF CONTENTS
1 EXECUTIVE SUMMARY & KEY FINDINGS
2 REPORT OFFERS
3 INTRODUCTION
- 3.1 Study Assumptions & Market Definition
- 3.2 Scope of the Study
- 3.3 Research Methodology
4 KEY INDUSTRY TRENDS
- 4.1 Acreage Of Major Crop Types
- 4.1.1 Field Crops
- 4.1.2 Horticultural Crops
- 4.2 Average Nutrient Application Rates
- 4.2.1 Micronutrients
- 4.2.1.1 Field Crops
- 4.2.1.2 Horticultural Crops
- 4.2.2 Primary Nutrients
- 4.2.2.1 Field Crops
- 4.2.2.2 Horticultural Crops
- 4.2.3 Secondary Macronutrients
- 4.2.3.1 Field Crops
- 4.2.3.2 Horticultural Crops
- 4.2.1 Micronutrients
- 4.3 Agricultural Land Equipped For Irrigation
- 4.4 Regulatory Framework
- 4.5 Value Chain & Distribution Channel Analysis
5 MARKET SEGMENTATION (includes market size in Value in USD and Volume, Forecasts up to 2030 and analysis of growth prospects)
- 5.1 Type
- 5.1.1 Complex
- 5.1.2 Straight
- 5.1.2.1 Micronutrients
- 5.1.2.1.1 Boron
- 5.1.2.1.2 Copper
- 5.1.2.1.3 Iron
- 5.1.2.1.4 Manganese
- 5.1.2.1.5 Molybdenum
- 5.1.2.1.6 Zinc
- 5.1.2.1.7 Others
- 5.1.2.2 Nitrogenous
- 5.1.2.2.1 Ammonium Nitrate
- 5.1.2.2.2 Anhydrous Ammonia
- 5.1.2.2.3 Urea
- 5.1.2.2.4 Others
- 5.1.2.3 Phosphatic
- 5.1.2.3.1 DAP
- 5.1.2.3.2 MAP
- 5.1.2.3.3 SSP
- 5.1.2.3.4 TSP
- 5.1.2.4 Potassic
- 5.1.2.4.1 MoP
- 5.1.2.4.2 SoP
- 5.1.2.4.3 Others
- 5.1.2.5 Secondary Macronutrients
- 5.1.2.5.1 Calcium
- 5.1.2.5.2 Magnesium
- 5.1.2.5.3 Sulfur
- 5.2 Form
- 5.2.1 Conventional
- 5.2.2 Speciality
- 5.2.2.1 CRF
- 5.2.2.2 Liquid Fertilizer
- 5.2.2.3 SRF
- 5.2.2.4 Water Soluble
- 5.3 Application Mode
- 5.3.1 Fertigation
- 5.3.2 Foliar
- 5.3.3 Soil
- 5.4 Crop Type
- 5.4.1 Field Crops
- 5.4.2 Horticultural Crops
- 5.4.3 Turf & Ornamental
6 COMPETITIVE LANDSCAPE
- 6.1 Key Strategic Moves
- 6.2 Market Share Analysis
- 6.3 Company Landscape
- 6.4 Company Profiles
- 6.4.1 CF Industries Holdings, Inc.
- 6.4.2 Haifa Group
- 6.4.3 ICL Group Ltd
- 6.4.4 Koch Industries Inc.
- 6.4.5 Nutrien Ltd.
- 6.4.6 Sociedad Quimica y Minera de Chile SA
- 6.4.7 The Andersons Inc.
- 6.4.8 The Mosaic Company
- 6.4.9 Wilbur-Ellis Company LLC
- 6.4.10 Yara International ASA
7 KEY STRATEGIC QUESTIONS FOR FERTILIZER CEOS
8 APPENDIX
- 8.1 Global Overview
- 8.1.1 Overview
- 8.1.2 Porter's Five Forces Framework
- 8.1.3 Global Value Chain Analysis
- 8.1.4 Market Dynamics (DROs)
- 8.2 Sources & References
- 8.3 List of Tables & Figures
- 8.4 Primary Insights
- 8.5 Data Pack
- 8.6 Glossary of Terms