|
시장보고서
상품코드
1693555
베트남의 비료 시장 : 점유율 분석, 산업 동향 및 통계, 성장 예측(2025-2030년)Vietnam Fertilizers - Market Share Analysis, Industry Trends & Statistics, Growth Forecasts (2025 - 2030) |
||||||
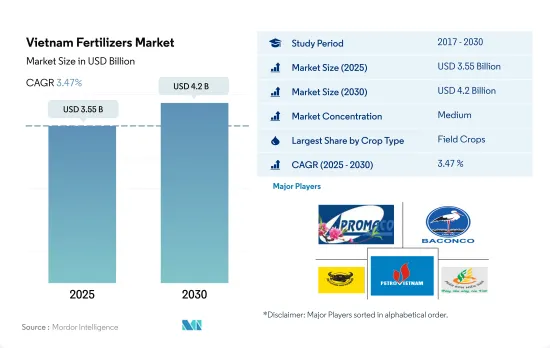
베트남의 비료 시장 규모는 2025년 35억 5,000만 달러로 추정되고, 2030년에는 42억 달러에 이르고, 예측 기간 중(2025-2030년) CAGR 3.47%로 성장할 것으로 예측됩니다.
시장의 매력이 증가하고 수요가 증가함에 따라 비료 수요는 크게 증가할 것으로 예상됩니다.
- 베트남의 비료 시장은 예측 기간 동안 CAGR 4.6%를 나타낼 것으로 예측됩니다.
- 농작물은 시장의 81.6%를 차지하고 시장을 독점하고 있습니다. 경작 면적은 감소하고 있지만, 작물의 수량은 현저하게 증가하고 있어 비료의 사용량을 늘릴 필요가 있습니다.
- 특히 쌀, 완두콩, 대두는 베트남의 주요 밭 작물입니다.
- 2022년 베트남 비료시장에서 원예 작물의 점유율은 25.8%였습니다.
- 잔디 및 관상식물분야는 CAGR 4.4%를 나타낼 것으로 보여지고 있습니다. 농업 농촌 개발성이 강조하고 있는 것처럼, 꽃과 분재 수요는 증가 경향에 있습니다.
- 시장의 매력 증가와 수요 증가를 생각하면, 베트남의 비료 시장은 대폭적인 성장을 이룰 것으로 예상됩니다.
베트남 비료 시장 동향
베트남 정부는 생산 비용을 줄이는 정책을 추진하고 있으며, 이로 인해 농작물의 재배 면적이 증가할 것으로 예상됩니다.
- 베트남은 밭작물에 상당한 면적을 할당하고 있으며, 주요 재배 품목은 쌀, 옥수수, 기타 다양한 주식입니다.
- 쌀은 주식으로서의 중요성을 반영하여 베트남의 주요 농작물이며, 재배면적은 최대 81.8%의 점유율을 차지했고 옥수수가 10.2%의 점유율을 차지했습니다. 2022년, 베트남의 쌀 생산량은 약 4,390만 톤에 이르렀습니다.
- 1년의 작기는 크게 나누어 3개 있어, 겨울부터 봄에 이르는 조기 작기, 여름부터 가을에 걸친 중기 작기, 가을에서 겨울에 걸치는 장기 작기입니다.
- 베트남 정부는 농작물의 생산성, 품질, 이익을 향상시키기 위해 비료와 농약의 사용량을 줄이고 농가제 또는 현지산의 비료를 장려함으로써 생산비용을 절감하는 정책을 추진하고 있습니다. 양분 부족으로 인한 흉작이 증가하고 식물의 왜곡을 방지하기 위해 고효율 비료에 대한 요구가 높아지고있는 것도 베트남 비료 시장의 성장에 기여하고있는 요인 중 하나입니다.
질소는 다양한 농작물에 필수적인 영양소이며, 그 적용량은 매우 많습니다.
- 농작물의 1차 양분의 평균 시용량은 2022년에는 1헥타르당 123.94kg이었습니다. 베트남에서 가장 많이 생산되는 곡물은 쌀, 밀, 옥수수입니다. 이 밭 작물들으 ㅣ동년 평균 1차 양분 비료 시용량은 155.49kg/ha, 228.90 kg/ha, 148.49 kg/ha였습니다.
- 모든 1차 양분 중 질소의 시용량이 많고, 농작물 평균 221.43 kg/헥타르였습니다. 이것은 질소가 경작, 잎 면적의 개발, 곡물 형성, 곡물 충진, 단백질 합성 증가를 돕고, 농작물의 곡물 수량과 곡물 품질을 높이기 때문입니다.
- 베트남의 Vinh Phuc성에서는 토양의 대부분이 열화되어 유기물이 적은 것이 특징입니다. 총 이용 가능 질소는 0.08% 미만, 전체 인은 0.04% 미만, 전체 가용성은 10ppm 미만입니다. 따라서 농산물의 생산을 안정시키기 위해 비료 수요는 더욱 증가하고 있으며, 베트남의 비료 시장의 성장을 견인하고 있습니다.
베트남 비료 산업 개요
베트남의 비료 시장은 적당히 통합되어 있으며 주요 5개사에서 41.26%를 차지하고 있습니다.이 시장 주요 기업은 AGRICULTURAL PRODUCTS AND MATERIALS JSC(APROMACO), Baconco, Binh Dien Fertilizer JSC(BFC), PetroVietnam Fertilizer and Chemical Corp., Southern Fertilizer JSC(알파벳순)입니다.
기타 혜택
- 엑셀 형식 시장 예측(ME) 시트
- 3개월의 애널리스트 서포트
목차
제1장 주요 요약과 주요 조사 결과
제2장 보고서 제안
제3장 소개
- 조사의 전제조건과 시장 정의
- 조사 범위
- 조사 방법
제4장 주요 산업 동향
- 주요 작물의 작부 면적
- 밭 작물
- 원예 작물
- 평균 양분 시용률
- 미량 영양소
- 밭 작물
- 원예 작물
- 1차 영양소
- 밭 작물
- 원예 작물
- 2차 다량 영양소
- 밭 작물
- 원예 작물
- 미량 영양소
- 관개 농지
- 규제 프레임워크
- 밸류체인과 유통채널 분석
제5장 시장 세분화
- 유형
- 복합형
- 스트레이트
- 미량 영양소
- 붕소
- 구리
- 철
- 망간
- 몰리브덴
- 아연
- 기타
- 질소
- 우레아
- 기타
- 인산
- DAP
- MAP
- TSP
- 기타
- 칼륨
- MoP
- SoP
- 기타
- 2차 영양소
- 칼슘
- 마그네슘
- 유황
- 형태
- 기존
- 특수
- CRF
- 액체 비료
- SRF
- 수용성
- 시비 모드
- 시비
- 엽면 살포
- 토양
- 작물 유형
- 밭작물
- 원예작물
- 잔디 및 관상용
제6장 경쟁 구도
- 주요 전략 동향
- 시장 점유율 분석
- 기업 상황
- 기업 프로파일
- AGRICULTURAL PRODUCTS AND MATERIALS JSC(APROMACO)
- Baconco
- Binh Dien Fertilizer JSC(BFC)
- Duc Giang Chemicals Group
- Grupa Azoty SA(Compo Expert)
- Haifa Group
- Ninh Binh Phosphate Fertilizer JSC
- PetroVietnam Fertilizer and Chemical Corp.
- Southern Fertilizer JSC
- Yara International ASA
제7장 CEO에 대한 주요 전략적 질문
제8장 부록
- 세계 개요
- 개요
- Porter's Five Forces 분석 프레임워크
- 세계의 밸류체인 분석
- 시장 역학(DROs)
- 정보원과 참고문헌
- 도표 일람
- 주요 인사이트
- 데이터 팩
- 용어집
The Vietnam Fertilizers Market size is estimated at 3.55 billion USD in 2025, and is expected to reach 4.2 billion USD by 2030, growing at a CAGR of 3.47% during the forecast period (2025-2030).

With the increased market attractiveness coupled with rising demand, the demand for fertilizer is anticipated to grow substantially
- The fertilizers market in Vietnam is projected to record a CAGR of 4.6% during the forecast period. This growth is primarily driven by the rising popularity of Asian cuisine, a growing emphasis on healthy eating, and favorable climatic conditions.
- Field crops dominate the market, accounting for 81.6% of the total. Despite a decrease in the area under cultivation, the country is witnessing a notable increase in crop yields, necessitating higher fertilizer usage.
- Notably, rice, peas, and soybeans are key field crops in Vietnam. In 2022, the agriculture sector aimed to produce 48.3 million tons of grain, with a specific focus on rice, targeting an output of 43-43.9 million tons. This underscores the expected growth in the field crop market in the coming years.
- Horticultural crops held a 25.8% share in Vietnam's fertilizer market in 2022. The upcoming free trade agreement between the European Union and Vietnam, specifically for horticultural crop exports starting in 2023, is poised to further bolster this segment's growth.
- The turf and ornamental sector is set to record a CAGR of 4.4%. Notably, flower and ornamental plant production has seen significant advancements, yielding substantial economic value. The demand for flowers and bonsai trees is on the rise, as highlighted by the Ministry of Agriculture and Rural Development. In 2022, turf and ornamental crops accounted for 0.4% of Vietnam's fertilizers market.
- Given the increasing market attractiveness and rising demand, the fertilizer market in Vietnam is poised for substantial growth.
Vietnam Fertilizers Market Trends
The Vietnamese government has been promoting policies to reduce production costs, which is expected to increase the cultivation area under field crops
- Vietnam dedicates substantial acreages to field crops; major cultivations include rice, maize (corn), and various other staples. The country's diverse climate and topography allow the cultivation of a wide range of crops. However, the area under the cultivation of field crops in Vietnam decreased by 6.6% during the study period.
- Rice is a primary field crop in Vietnam, reflecting its importance as a staple food, and it occupies the maximum area under cultivation, accounting for an 81.8% share, followed by corn with a 10.2% share. In 2022, rice production volume in Vietnam amounted to approximately 43.9 million metric tons. Vietnam is one of the leading rice producers and exports to countries worldwide.
- There are three major cropping seasons during a year: winter-spring or early season, summer-autumn or midseason, and autumn-winter or a longer rainy season crop. Major agricultural regions in the country include the Red River Delta, the Mekong River Delta, and the Southern Terrace region. Rice is the principal crop in all three regions. Half of Vietnam's exported rice comes from the Mekong Delta.
- The Vietnamese government has been promoting policies to reduce production costs by reducing fertilizer and pesticide usage and encouraging farm-made or locally-produced fertilizers to increase field crops' productivity, quality, and profit. The increasing incidence of crop failures due to a lack of nutrients and the rise in the requirement of high-efficiency fertilizers to prevent dwarfism in plants are some of the other factors contributing to the growth of the Vietnam fertilizers market.
Nitrogen is a vital nutrient required for a range of field crops, and its application is very high
- The average application rate of primary nutrients in field crops was 123.94 kg per hectare in 2022. Among field crops, grains and cereals comprise the largest segment in terms of fertilizer consumption in Vietnam. The top-producing cereals in Vietnam are rice, wheat, and maize. The average primary nutrient application rates of these field crops were 155.49 kg/ha, 228.90 kg/ha, and 148.49 kg/ha, respectively, in the same year.
- Among all the primary nutrients, nitrogen is applied in a higher quantity, which is 221.43 kg/hectare on average for the field crops because nitrogen aids in increased tillering, leaf area development, grain formation, grain filling, and protein synthesis and also enhances grain yield and grain quality in field crops. Wheat has the maximum nitrogen application rate, which is 492.06 kg per hectare, followed by rice with 328.04 kg per hectare.
- In Vinh Phuc province of Vietnam, large areas of the soil are degraded and characterized by low organic matter; total available nitrogen is less than 0.08%, total phosphorus is below 0.04%, and total potassium is below 1.0%. Also, the available P is less than 10 ppm. These nutrient deficiencies led to an increase in the average fertilizer consumption in Vietnam from 49.2 kg/ha in 1969 to 415.3 kilograms per hectare by 2018, increasing at an average annual growth rate of 6.71%. In Vietnam, 43% of the population is involved in agriculture, but the production capacity is still less than one-fifth of the total GDP of the country, grossing only about 12.36%. Hence, to stabilize the production of agricultural products, the demand for fertilizers is further increasing, driving the growth of the Vietnam fertilizers market.
Vietnam Fertilizers Industry Overview
The Vietnam Fertilizers Market is moderately consolidated, with the top five companies occupying 41.26%. The major players in this market are AGRICULTURAL PRODUCTS AND MATERIALS JSC (APROMACO), Baconco, Binh Dien Fertilizer JSC (BFC), PetroVietnam Fertilizer and Chemical Corp. and Southern Fertilizer JSC (sorted alphabetically).
Additional Benefits:
- The market estimate (ME) sheet in Excel format
- 3 months of analyst support
TABLE OF CONTENTS
1 EXECUTIVE SUMMARY & KEY FINDINGS
2 REPORT OFFERS
3 INTRODUCTION
- 3.1 Study Assumptions & Market Definition
- 3.2 Scope of the Study
- 3.3 Research Methodology
4 KEY INDUSTRY TRENDS
- 4.1 Acreage Of Major Crop Types
- 4.1.1 Field Crops
- 4.1.2 Horticultural Crops
- 4.2 Average Nutrient Application Rates
- 4.2.1 Micronutrients
- 4.2.1.1 Field Crops
- 4.2.1.2 Horticultural Crops
- 4.2.2 Primary Nutrients
- 4.2.2.1 Field Crops
- 4.2.2.2 Horticultural Crops
- 4.2.3 Secondary Macronutrients
- 4.2.3.1 Field Crops
- 4.2.3.2 Horticultural Crops
- 4.2.1 Micronutrients
- 4.3 Agricultural Land Equipped For Irrigation
- 4.4 Regulatory Framework
- 4.5 Value Chain & Distribution Channel Analysis
5 MARKET SEGMENTATION (includes market size in Value in USD and Volume, Forecasts up to 2030 and analysis of growth prospects)
- 5.1 Type
- 5.1.1 Complex
- 5.1.2 Straight
- 5.1.2.1 Micronutrients
- 5.1.2.1.1 Boron
- 5.1.2.1.2 Copper
- 5.1.2.1.3 Iron
- 5.1.2.1.4 Manganese
- 5.1.2.1.5 Molybdenum
- 5.1.2.1.6 Zinc
- 5.1.2.1.7 Others
- 5.1.2.2 Nitrogenous
- 5.1.2.2.1 Urea
- 5.1.2.2.2 Others
- 5.1.2.3 Phosphatic
- 5.1.2.3.1 DAP
- 5.1.2.3.2 MAP
- 5.1.2.3.3 TSP
- 5.1.2.3.4 Others
- 5.1.2.4 Potassic
- 5.1.2.4.1 MoP
- 5.1.2.4.2 SoP
- 5.1.2.4.3 Others
- 5.1.2.5 Secondary Macronutrients
- 5.1.2.5.1 Calcium
- 5.1.2.5.2 Magnesium
- 5.1.2.5.3 Sulfur
- 5.2 Form
- 5.2.1 Conventional
- 5.2.2 Speciality
- 5.2.2.1 CRF
- 5.2.2.2 Liquid Fertilizer
- 5.2.2.3 SRF
- 5.2.2.4 Water Soluble
- 5.3 Application Mode
- 5.3.1 Fertigation
- 5.3.2 Foliar
- 5.3.3 Soil
- 5.4 Crop Type
- 5.4.1 Field Crops
- 5.4.2 Horticultural Crops
- 5.4.3 Turf & Ornamental
6 COMPETITIVE LANDSCAPE
- 6.1 Key Strategic Moves
- 6.2 Market Share Analysis
- 6.3 Company Landscape
- 6.4 Company Profiles
- 6.4.1 AGRICULTURAL PRODUCTS AND MATERIALS JSC (APROMACO)
- 6.4.2 Baconco
- 6.4.3 Binh Dien Fertilizer JSC (BFC)
- 6.4.4 Duc Giang Chemicals Group
- 6.4.5 Grupa Azoty S.A. (Compo Expert)
- 6.4.6 Haifa Group
- 6.4.7 Ninh Binh Phosphate Fertilizer JSC
- 6.4.8 PetroVietnam Fertilizer and Chemical Corp.
- 6.4.9 Southern Fertilizer JSC
- 6.4.10 Yara International ASA
7 KEY STRATEGIC QUESTIONS FOR FERTILIZER CEOS
8 APPENDIX
- 8.1 Global Overview
- 8.1.1 Overview
- 8.1.2 Porter's Five Forces Framework
- 8.1.3 Global Value Chain Analysis
- 8.1.4 Market Dynamics (DROs)
- 8.2 Sources & References
- 8.3 List of Tables & Figures
- 8.4 Primary Insights
- 8.5 Data Pack
- 8.6 Glossary of Terms