
|
시장보고서
상품코드
1693557
중국의 비료 시장 : 점유율 분석, 산업 동향, 통계, 성장 예측(2025-2030년)China Fertilizers - Market Share Analysis, Industry Trends & Statistics, Growth Forecasts (2025 - 2030) |
||||||
■ 보고서에 따라 최신 정보로 업데이트하여 보내드립니다. 배송일정은 문의해 주시기 바랍니다.
가격
※ 부가세 별도
한글목차
영문목차
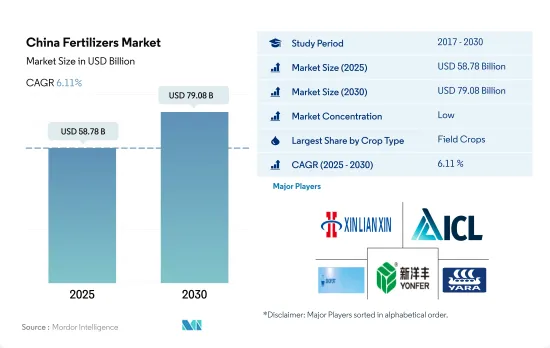
중국의 비료 시장 규모는 2025년에 587억 8,000만 달러, 2030년에는 790억 8,000만 달러에 이르고, 예측 기간 중(2025-2030년) CAGR은 6.11%를 나타낼 전망입니다.
비료 사용이 필요한 집약 재배와 단일 재배
- 윤작을 수반하지 않는 장기에 걸친 지속적인 경작에 의해 농지의 비옥도는 고갈해, 부족이 심각화하고 있어 특히 중국 남부에서는 비료의 필요성이 높아지고 있습니다.
- 농작물은 대부분의 경우 질소 비료를 많이 사용합니다.
- 원예 작물은 일년 내내 재배되어 스프링클러나 점적 관개와 같은 뛰어난 살수 방법의 혜택을 받아 수용성 비료나 액체 비료의 사용을 촉진하기 위해, 밭작물보다 특수 비료를 많이 이용합니다.
- 2022년에는 국내 비료시장 전체에서 잔디 및 관상용 제품으로 구성되는 비율은 1% 이하가 됩니다.
- 그 때문에 2023-2030년에 걸쳐서는 농작물 수요 증가와, 관상용 꽃의 수입을 줄이기 위한 자급률 중시의 높아에 의해 부문에 의한 성장이 밀어올릴 것으로 예측됩니다.
중국 비료 시장 동향
중국의 재배면적 확대는 식량 수요 증가와 주식의 자급 달성 목표에 따릅니다.
- 중국에서는 농작물의 재배면적은 2017년 1억 3,050만 헥타르에서 2021년에는 1억 2,780만 헥타르로 감소하여 총재배면적의 71.4%를 차지합니다. 점유율은 옥수수가 34.2%를 차지하고 이어서 쌀이 23.6%, 밀이 18.3%를 나타낼 전망입니다.
- 중국은 보통 밭작물의 생산을 여름/봄(4월-9월)과 겨울의 2시즌으로 나눕니다. 쌀과 옥수수는 중국의 농업 중에서 우선되어 중국의 곡물 생산량의 1/3을 차지하고 있습니다. 주요 쌀 생산 지역은 흑룡강성, 호남성, 강북성, 강소성, 사천성, 광서 치완족 자치구, 광동성, 클라우드 남성입니다. 2022-23년 중국의 옥수수 생산량은 수확량의 개선에 의해 전년대비 460만 톤 증가한 2억 7,720만 톤에 이를 것으로 예측되고 있습니다.
- 봄이 주요 작기임에 변화는 없지만, 특히 6월과 7월의 더운 시기에는 과제에 직면합니다. 양의 적음이 겹치면 토양의 미네랄 부족이 심각화되어 비료의 시용량을 늘릴 필요가 있습니다.
세계 농지에서 배출되는 아산화질소의 약 28%가 중국 농지에서 배출되고 있습니다.
- 1 차 영양소는 효소 활성과 같은 생화학적 과정을 강화하고 식물 세포의 성장을 가속합니다. 질소, 칼륨, 인을 합한 평균 시용량은 159.9kg/헥타르였습니다. 구체적으로는 질소가 이 평균의 65.23%, 인이 28.07%, 칼륨이 6.68%를 차지합니다.
- 질소는 엽록소와 아미노산의 구성성분으로서 식물의 대사에 중요한 역할을 하며, 1차 영양소 중에서 톱을 차지하고 있습니다.2022년 평균 적용률은 헥타르당 279.65kg이었습니다. 칼륨이 105.3kg/헥타르로 그 뒤를 이었고, 인은 94.9kg/헥타르로 약간 감소했습니다. 질소와 인에 의한 지표수와 지하수의 오염은 농업 종사자에 대한 시비량의 지도가 불충분했던 것에 기인하고 있습니다.
- 2022년에는 면화, 밀, 옥수수, 쌀이 평균 양분 시용량이 가장 많은 작물로 부상하여 각각 255.41kg/헥타르, 232.25kg/헥타르, 198.44kg/헥타르, 157.76kg/헥타르라는 수치였습니다. 꽃생산으로 세계를 리드해, 2022년에는 640만톤이라는 경이적인 생산량을 기록했습니다. 또, 면화의 최대의 소비국이며 수입국이기도 합니다.
- 증가하는 인구의 요구를 충족시키는 것이 급무이기 때문에 2023-2030년에 걸쳐, 농작물에의 1차 영양소의 시용이 증가할 것으로 예상되고 있습니다.
중국 비료 산업 개요
중국의 비료 시장은 세분화되어 있으며 상위 5개 기업에서 12.84%를 차지하고 있습니다.
기타 혜택
- 엑셀 형식 시장 예측(ME) 시트
- 3개월의 애널리스트 서포트
목차
제1장 주요 요약과 주요 조사 결과
제2장 보고서 제안
제3장 소개
- 조사의 전제조건과 시장 정의
- 조사 범위
- 조사 방법
제4장 주요 산업 동향
- 주요 작물의 작부 면적
- 밭작물
- 원예작물
- 평균 양분 시용률
- 미량 영양소
- 밭작물
- 원예작물
- 1차 영양소
- 밭작물
- 원예작물
- 2차 다량 영양소
- 밭작물
- 원예작물
- 미량 영양소
- 관개 농지
- 규제 프레임워크
- 밸류체인과 유통채널 분석
제5장 시장 세분화
- 유형
- 복합형
- 스트레이트
- 미량 영양소
- 붕소
- 구리
- 철
- 망간
- 몰리브덴
- 아연
- 기타
- 질소
- 우레아
- 기타
- 인산
- DAP
- MAP
- SSP
- TSP
- 기타
- 포타시스
- MoP
- SoP
- 기타
- 2차 영양소
- 칼슘
- 마그네슘
- 유황
- 형태
- 기존
- 특수
- CRF
- 액체 비료
- SRF
- 수용성
- 시비 모드
- 시비
- 잎면 살포
- 토양
- 작물 유형
- 밭작물
- 원예작물
- 잔디?관상용
제6장 경쟁 구도
- 주요 전략 동향
- 시장 점유율 분석
- 기업 상황
- 기업 프로파일
- Coromandel International Ltd.
- Grupa Azoty SA(Compo Expert)
- Hebei Monband Water Soluble Fertilizer Co. Ltd
- Hebei Sanyuanjiuqi Fertilizer Co., Ltd.
- Henan XinlianXin Chemicals Group Company Limited
- ICL Group Ltd
- Sinofert Holdings Limited
- Sociedad Quimica y Minera de Chile SA
- Xinyangfeng Agricultural Technology Co., Ltd.
- Yara International ASA
제7장 CEO에 대한 주요 전략적 질문
제8장 부록
- 세계 개요
- 개요
- Five Forces 분석 프레임워크
- 세계의 밸류체인 분석
- 시장 역학(DROs)
- 정보원과 참고문헌
- 도표 일람
- 주요 인사이트
- 데이터 팩
- 용어집
The China Fertilizers Market size is estimated at 58.78 billion USD in 2025, and is expected to reach 79.08 billion USD by 2030, growing at a CAGR of 6.11% during the forecast period (2025-2030).

Intensive cultivation and monoculture necessitating the fertilizers use
- Due to continuous long-term cultivation without crop rotation, farmland fertility has been depleted and has become more deficient, increasing the need for fertilizers, especially in South China. Due to growing concerns about environmental pollution, there is a rising demand for sustainable fertilizers in field crops.
- Field crops often utilize the greatest nitrogen fertilizers. Due to their extensive cultivation, grains and cereals deplete soil nutrients, requiring the application of additional fertilizers to make up for it. Conventional fertilizers accounted for about 73.3%, and specialty fertilizers accounted for about 26.7% of the total field crops fertilizer market value in 2022.
- Horticultural crops utilize more specialty fertilizers than field crops since they are grown all year long and benefit from superior watering methods like sprinkler and drip irrigation, which encourage the use of water-soluble and liquid fertilizers. About 18.7% of the market value of fertilizers used in horticultural crops was made up of specialty fertilizers in 2021.
- In 2022, less than 1% of the country's total fertilizer market was made up of turf and ornamental products. Over recent years, the government put greater emphasis on self-sufficiency and established a number of methods, such as the production of ornamental flowers in greenhouses, which are expected to support sectoral growth.
- Therefore, it is projected that the segmental growth will be boosted throughout 2023-2030 due to the rising demand from field crops and increased focus on self-sufficiency to reduce the import of ornamentals. The country is the leading producer of fertilizers.
China Fertilizers Market Trends
China's expanding cultivation area is driven by increased food demand and goal to achieve self-sufficiency in staple food
- In China, the cultivation area for field crops decreased from 130.5 million hectares in 2017 to 127.8 million hectares in 2021, representing 71.4% of the total cultivated area. Corn dominated the field crop landscape with a share of 34.2%, followed by rice and wheat at 23.6% and 18.3%, respectively. This expanding cultivation area is projected to drive up fertilizer demand in the country.
- China typically divides its field crop production into two seasons: summer/spring (April-September) and winter. Spring crops encompass early corn, early rice, early wheat, and cotton, while winter crops focus on winter wheat and rapeseed. Rice and corn, however, take precedence in China's agricultural landscape, accounting for a third of the nation's grain output. As the world's leading rice producer, China allocated 30 million hectares for rice farming in 2022, yielding a harvest of 210 million tonnes. Key rice-producing regions span Heilongjiang, Hunan, Jiangxi, Hubei, Jiangsu, Sichuan, Guangxi, Guangdong, and Yunan. China's corn production for 2022-23 is projected to hit 277.2 million tonnes, up by 4.6 million tonnes from the previous year, primarily due to improved harvests. The Northeast provinces of Heilongjiang, Jilin, and Inner Mongolia stand out as major corn-growing regions.
- While spring remains the primary cropping season, it faces some challenges, particularly during the hotter months of June and July. Rice, a staple for millions in China, is particularly affected. The combination of high temperatures and low precipitation exacerbates mineral depletion in the soil, necessitating higher fertilizer application. These dry weather conditions also pose a risk to crop yields.
About 28% of nitrous oxide emissions from cropland in the world are from China's agricultural lands
- Primary nutrients enhance biochemical processes, such as enzyme activity, and foster plant cell growth. Deficiencies in these nutrients can significantly impact plant health, development, and crop yields. In 2022, the average application rate for nitrogen, potassium, and phosphorus combined in field crops stood at 159.9 kg/hectare. Specifically, nitrogen accounted for 65.23%, phosphorus for 28.07%, and potassium for 6.68% of this average.
- Nitrogen takes the lead among primary nutrients, playing a vital role in plant metabolism as a constituent of chlorophyll and amino acids. Its average application rate in 2022 was 279.65 kg/hectare. Potash followed with 105.3 kg/hectare, and phosphorus trailed slightly at 94.9 kg/hectare. The contamination of surface and groundwater with nitrogen and phosphorus has been attributed to inadequate guidance on fertilizer application rates for farmers. Notably, around 28% of global nitrous oxide emissions from croplands originate from China.
- In 2022, cotton, wheat, corn, and rice emerged as the crops with the highest average nutrient application rates, with figures of 255.41 kg/hectare, 232.25 kg/hectare, 198.44 kg/hectare, and 157.76 kg/hectare, respectively. China led the world in cotton production, with a staggering 6.4 million metric tons in 2022. It also held the title of the largest consumer and importer of cotton. Impressively, China accounted for about 20% of global cotton consumption, with a significant 84% of its production hailing from Xinjiang.
- Given the imperative to meet the needs of a growing population, there is an anticipated increase in the application of primary nutrients in field crops between 2023 and 2030.
China Fertilizers Industry Overview
The China Fertilizers Market is fragmented, with the top five companies occupying 12.84%. The major players in this market are Henan XinlianXin Chemicals Group Company Limited, ICL Group Ltd, Sinofert Holdings Limited, Xinyangfeng Agricultural Technology Co., Ltd. and Yara International ASA (sorted alphabetically).
Additional Benefits:
- The market estimate (ME) sheet in Excel format
- 3 months of analyst support
TABLE OF CONTENTS
1 EXECUTIVE SUMMARY & KEY FINDINGS
2 REPORT OFFERS
3 INTRODUCTION
- 3.1 Study Assumptions & Market Definition
- 3.2 Scope of the Study
- 3.3 Research Methodology
4 KEY INDUSTRY TRENDS
- 4.1 Acreage Of Major Crop Types
- 4.1.1 Field Crops
- 4.1.2 Horticultural Crops
- 4.2 Average Nutrient Application Rates
- 4.2.1 Micronutrients
- 4.2.1.1 Field Crops
- 4.2.1.2 Horticultural Crops
- 4.2.2 Primary Nutrients
- 4.2.2.1 Field Crops
- 4.2.2.2 Horticultural Crops
- 4.2.3 Secondary Macronutrients
- 4.2.3.1 Field Crops
- 4.2.3.2 Horticultural Crops
- 4.2.1 Micronutrients
- 4.3 Agricultural Land Equipped For Irrigation
- 4.4 Regulatory Framework
- 4.5 Value Chain & Distribution Channel Analysis
5 MARKET SEGMENTATION (includes market size in Value in USD and Volume, Forecasts up to 2030 and analysis of growth prospects)
- 5.1 Type
- 5.1.1 Complex
- 5.1.2 Straight
- 5.1.2.1 Micronutrients
- 5.1.2.1.1 Boron
- 5.1.2.1.2 Copper
- 5.1.2.1.3 Iron
- 5.1.2.1.4 Manganese
- 5.1.2.1.5 Molybdenum
- 5.1.2.1.6 Zinc
- 5.1.2.1.7 Others
- 5.1.2.2 Nitrogenous
- 5.1.2.2.1 Urea
- 5.1.2.2.2 Others
- 5.1.2.3 Phosphatic
- 5.1.2.3.1 DAP
- 5.1.2.3.2 MAP
- 5.1.2.3.3 SSP
- 5.1.2.3.4 TSP
- 5.1.2.3.5 Others
- 5.1.2.4 Potassic
- 5.1.2.4.1 MoP
- 5.1.2.4.2 SoP
- 5.1.2.4.3 Others
- 5.1.2.5 Secondary Macronutrients
- 5.1.2.5.1 Calcium
- 5.1.2.5.2 Magnesium
- 5.1.2.5.3 Sulfur
- 5.2 Form
- 5.2.1 Conventional
- 5.2.2 Speciality
- 5.2.2.1 CRF
- 5.2.2.2 Liquid Fertilizer
- 5.2.2.3 SRF
- 5.2.2.4 Water Soluble
- 5.3 Application Mode
- 5.3.1 Fertigation
- 5.3.2 Foliar
- 5.3.3 Soil
- 5.4 Crop Type
- 5.4.1 Field Crops
- 5.4.2 Horticultural Crops
- 5.4.3 Turf & Ornamental
6 COMPETITIVE LANDSCAPE
- 6.1 Key Strategic Moves
- 6.2 Market Share Analysis
- 6.3 Company Landscape
- 6.4 Company Profiles
- 6.4.1 Coromandel International Ltd.
- 6.4.2 Grupa Azoty S.A. (Compo Expert)
- 6.4.3 Hebei Monband Water Soluble Fertilizer Co. Ltd
- 6.4.4 Hebei Sanyuanjiuqi Fertilizer Co., Ltd.
- 6.4.5 Henan XinlianXin Chemicals Group Company Limited
- 6.4.6 ICL Group Ltd
- 6.4.7 Sinofert Holdings Limited
- 6.4.8 Sociedad Quimica y Minera de Chile SA
- 6.4.9 Xinyangfeng Agricultural Technology Co., Ltd.
- 6.4.10 Yara International ASA
7 KEY STRATEGIC QUESTIONS FOR FERTILIZER CEOS
8 APPENDIX
- 8.1 Global Overview
- 8.1.1 Overview
- 8.1.2 Porter's Five Forces Framework
- 8.1.3 Global Value Chain Analysis
- 8.1.4 Market Dynamics (DROs)
- 8.2 Sources & References
- 8.3 List of Tables & Figures
- 8.4 Primary Insights
- 8.5 Data Pack
- 8.6 Glossary of Terms
