


|
시장보고서
상품코드
1693565
일본의 항공 시장 : 점유율 분석, 산업 동향, 통계, 성장 예측(2025-2030년)Japan Aviation - Market Share Analysis, Industry Trends & Statistics, Growth Forecasts (2025 - 2030) |
||||||
일본 항공 시장 규모는 2025년에 61억 9,000만 달러, 2030년에는 138억 3,000만 달러에 이르고, 예측기간(2025-2030년)의 CAGR은 17.45%를 나타낼 전망입니다.

일본에서는 항공 수요가 증가함에 따라 민간 항공 부문이 시장을 독점할 것으로 예측됩니다.
- 항공사와 공급망으로 구성된 민간항공산업은 예측기간 동안 일본의 GDP에 721억 달러 기여할 것으로 예측됩니다. 또한 항공 운송 부문으로의 입력과 항공 지원으로 일본을 방문하는 외국인 관광객은 일본 GDP의 2.4%에 기여할 것으로 예측됩니다.
- 일본은 COVID-19의 대유행이 이 지역의 민간항공산업에 영향을 미치고 있음에도 불구하고 세계에서 강력하게 성장하고 있는 민간항공시장 중 하나입니다. 여객 수송량의 회복은 일본의 민간 항공 산업의 부활을 조장할 것으로 예측됩니다. 2021년 일본 항공 여객 수송량은 139% 증가했습니다. 여객 수송량 증가는 국경규제의 완화에 기인하고 있습니다.
- 부유층 증가, 훈련교 증가, 비즈니스 제트 인프라 개발에 대한 정부의 주력, 규제 완화 활동 등의 요인이 예측 기간 동안 일본에서 일반 항공의 성장을 가속할 것으로 예측됩니다. 일본에서는 정기편 이외의 비즈니스 여행의 요구가 높아지고 있기 때문에 전세편 운항회사가 끊임없이 항로를 확대해, 새로운 항공기를 보유기에 추가하고 있습니다. 이것은 일본에서 비즈니스 제트기와 터보프롭 기계 수요를 지원합니다. 한편, 경 스포츠기와 연습기 수요는 계속 높아 일반 항공기재의 성장에 기여하고 있습니다.
- 일본의 방위성은 2021년 초에 2022년도 예산으로 493억 달러 이상을 제안했지만, 이것은 기록적인 것으로, GDP의 1%라는 오랜 상한을 상회할 가능성이 있습니다. 2027년까지 일본은 미국과 중국에 이어 세계 3위의 방위 지출국이 될 가능성이 있습니다.
일본 항공 시장 동향
규제 완화와 여객 여행 증가가 수요를 견인.
- 아시아태평양의 일본의 전략적 입지는 국제 여행 및 관광의 인기 목적지가 되고 있습니다. 소득 증가, 관광객 증가, 세계 비즈니스 교류 등의 요인에 힘입어 일본 국내와 해외 목적지로의 항공 여행 수요는 계속 증가하고 있습니다. 2022년에는 2020년 5,100만명에 대해 1억 2,200만명의 항공 여객이 일본을 통과합니다. 2022년과 2020년 사이의 성장은 139%였습니다. 2022-2021년에 걸친 성장은 변하지 않았습니다.
- 2019년, 일본의 37개의 공항이 국제 노선을 가지고 있었습니다. 그러나 2022년에는 이 수는 불과 17개로 감소했습니다. 그 결과, 일본의 지방 공항에서 운항되고 있던 국제 노선의 대부분이, 팬데믹 이전의 운항에는 아직 돌아오지 않은 중국이나 한국의 지방 시장에 취항하고 있기도 하고, 국제선 트래픽은 보다 소수의 공항에 집중하게 되었습니다.
- 여행 수요의 침체와 그와 관련하여 대기업이 직면한 손실은 항공사가 예정하고 있던 항공기의 납품을 연기하고, 몇 기종의 항공기를 조기에 퇴역시킴으로써 기존 항공기를 재편성하는 결과가 되었습니다. 구식의 Boeing사제 737형 단거리 노선용 항공기를, 최신의 연비 효율이 좋은 기종으로 바꾸는 것을 검토하고 있습니다. Max시리즈와 AirbusSE의 라이벌기 A320neo의 어느 쪽인지를 선택해, 30기와 50기의 네로우 바디기를 발주할 전망입니다.
지정학적 위협이 일본의 방위비 증액의 원동력이 되고 있습니다.
- 일본의 종합군사력은 미국, 러시아, 중국, 인도에 이어 세계 6위입니다. 일본의 방위 예산은 2022년 140개국 중 10위였습니다. 2022년 일본은 군사비로 460억 달러를 계상해 2021년부터 5.9% 증가했습니다. 지금까지 군사비의 상한을 GDP의 1.0%로 하고 있던 일본은 시책을 크게 전환하고 있는 중입니다. 일본의 2022년 국가 안보 전략은 2027년까지 군사비를 포함한 안보에 대한 지출을 GDP의 2.0%까지 늘리는 것을 목표로 하고 있습니다. 이 증가는 중국, 북한, 러시아의 위협이 증가하고 있다는 일본 인식에 대한 대응이 주요 이유입니다. 2022년 GDP 대비 1.1%로 일본 군사 부담은 3년 연속 1.0%를 넘어 1960년 이후 고수준이 되었습니다.
- 중국의 침략이 강해지고 있는 가운데, 또한 남중국해와 동중국해에 관련된 거의 모든 분쟁에 대한 이해관계자로서 일본이 군용기를 조달할 필요성은 현저하게 높아지고 있습니다. 이와 관련해 고정익기 부문에서는 일본은 Lockheed Martin사에 FX 또는 F-3로 일반적으로 알려진 6세대 스텔스 전투기 프로그램인 F-35A 63기와 F-35B 42기를 포함한 F-35 전투기 105기에 대해 231억 1,000만 달러의 대량 조달 계약을 발주했습니다. 또한 이 나라는 군용 회전익기 부문에서 벨 헬리콥터스에 150대의 벨과 412대의 UH-X 수송 헬리콥터를 주문했습니다. 2021년까지 3대의 헬리콥터가 납품됐고 나머지 기체는 2039년까지 납품될 예정입니다. 이러한 다목적 헬리콥터는 일본의 육상 자위대(JGSDF)가 현재 보유하고 있는 UH-1J기의 대체기로서 주문됐습니다.
일본 항공 산업 개요
일본 항공 시장은 상당히 통합되어 있으며 상위 5개사에서 89.11%를 차지하고 있습니다. 이 시장의 주요 기업은 Airbus SE, ATR, Kawasaki Heavy Industries, Ltd., Lockheed Martin Corporation and The Boeing Company (sorted alphabetically) 입니다.
기타 혜택
- 엑셀 형식 시장 예측(ME) 시트
- 3개월의 애널리스트 서포트
목차
제1장 주요 요약과 주요 조사 결과
제2장 보고서 제안
제3장 소개
- 조사의 전제조건과 시장 정의
- 조사 범위
- 조사 방법
제4장 주요 산업 동향
- 항공 여객 수송량
- 항공화물 수송량
- 국내총생산
- 수입 여객 킬로(rpk)
- 인플레이션율
- 액티브 플릿 데이터
- 국방 지출
- 개인 부유층(hnwi)
- 규제 프레임워크
- 밸류체인 분석
제5장 시장 세분화
- 항공기 유형
- 민간 항공기
- 서브 항공기 유형별
- 화물기
- 여객기
- 바디 유형별
- 협폭동체 항공기
- 와이드 바디 기계
- 일반 여객기
- 서브 항공기 유형별
- 비즈니스 제트
- 바디 유형별
- 대형 제트기
- 소형 제트기
- 중형 제트기
- 피스톤 고정익기
- 기타
- 군용기
- 서브 항공기 유형별
- 고정익기
- 바디 유형별
- 다용도 항공기
- 수송기
- 기타
- 회전익기
- 기체 유형별
- 멀티미션 헬리콥터
- 수송용 헬리콥터
- 기타
- 민간 항공기
제6장 경쟁 구도
- 주요 전략 동향
- 시장 점유율 분석
- 기업 상황
- 기업 프로파일
- Airbus SE
- ATR
- Bombardier Inc.
- Kawasaki Heavy Industries, Ltd.
- Lockheed Martin Corporation
- Textron Inc.
- The Boeing Company
제7장 CEO에 대한 주요 전략적 질문
제8장 부록
- 세계 개요
- 개요
- Five Forces 분석 프레임워크
- 세계의 밸류체인 분석
- 시장 역학(DROs)
- 정보원과 참고문헌
- 도표 일람
- 주요 인사이트
- 데이터 팩
- 용어집
The Japan Aviation Market size is estimated at 6.19 billion USD in 2025, and is expected to reach 13.83 billion USD by 2030, growing at a CAGR of 17.45% during the forecast period (2025-2030).
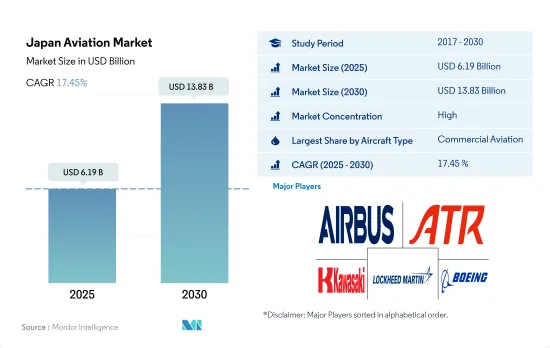
The commercial aviation segment is expected to dominate the market in Japan due to rising demand for air travel
- The commercial aviation industry, comprising airlines and their supply chains, is estimated to contribute USD 72.1 billion to Japan's GDP during the forecast period. In addition, inputs to the air transport sector and foreign tourists coming by air support are expected to contribute 2.4% of the country's GDP.
- Japan is one of the world's strongly growing commercial aviation markets, despite the COVID-19 pandemic impacting the region's commercial airline industry. The recovery of passenger traffic is anticipated to aid in the revival of Japan's commercial aviation industry. Japan witnessed a total increase of 139% in air passenger traffic in 2021. The rise in passenger traffic is attributed to ease in border restrictions.
- Factors such as the increasing number of high-net-worth individuals, training schools, the government's focus on developing business jet infrastructure, and deregulation activities are expected to drive the growth of general aviation in Japan during the forecast period. Charter operators in the country are constantly expanding their routes and are adding new aircraft to their fleets, driven by the growing need for non-scheduled business travel. This has helped the demand for business jets and turboprops in Japan. On the other hand, the demand for light sport and trainer aircraft remained high, contributing to the growth of the general aviation fleet.
- Japan's Defense Ministry proposed a budget for fiscal 2022 of more than USD 49.3 billion at the beginning of 2021, which is a record and potentially exceeds the long-standing cap of 1% of GDP. By 2027, Japan might be the world's third-largest defense spender, after only the United States and China.
Japan Aviation Market Trends
Ease of restrictions and rising passenger travel driving demand
- The strategic location of Japan in the Asia-Pacific region makes it a popular destination for international travel and tourism. The demand for air travel within Japan and to international destinations continues to grow, driven by factors such as rising incomes, increased tourism, and global business interactions. In 2022, 122 million air passengers traveled through Japan, compared to 51 million in 2020. The growth between 2022 and 2020 was 139%. The growth remained the same between 2022 and 2021.
- In 2019, 37 Japanese airports had international routes. However, in 2022, this number fell to just 17. International traffic has also become more concentrated in fewer airports, partly as a result of the Japanese government's decision to allow international access to Japan through just a small number of airports during the COVID-19 pandemic and partly because many of the international routes that operated from regional airports in Japan served regional markets in China and South Korea, which are not yet back to pre-pandemic operations.
- The drop in travel demand and the associated losses faced by major airlines resulted in airlines deferring their expected aircraft deliveries and restructuring their existing fleet by retiring a few aircraft models early. For instance, Japan Airlines Co.'s national Carrier is looking to replace its older Boeing Co. 737 short-haul fleet with modern and fuel-efficient aircraft models. The airline has a fleet of 45 Boeing 737 jets with an average age of about 12.5 years. The airline is expected to choose between the 737 Max range and Airbus SE's rival A320neo to replace the aging fleet, with an expected order of 30 and 50 narrow-body jets.
Geopolitical threats is driving the growth of defense expenditure in Japan
- Japan is ranked sixth globally in overall military power after the United States, Russia, China, and India. The country's defense budget ranked tenth in the 2022 ranking of 140 countries. In 2022, Japan allocated USD 46.0 billion to its military, up by 5.9% from 2021. The country is in the middle of a significant shift in policy, which had previously capped military spending at 1.0% of GDP. Japan's 2022 National Security Strategy aims to increase spending on security, which includes funding for the military, to up to 2.0% of GDP by 2027. The planned increase is largely in response to Japan's perception of growing threats from China, North Korea, and Russia. At 1.1% of GDP in 2022, Japan's military burden surpassed 1.0% for the third consecutive year and was at its highest level since 1960.
- In the face of rising Chinese aggression, and as a stakeholder in almost all disputes involving the South and East China seas, the need for Japan to procure military aircraft has increased significantly. On this note, in the fixed-wing aircraft segment, Japan ordered a mass procurement contract worth USD 23.11 billion with Lockheed Martin for 105 F-35 combat aircraft, which includes 63 F-35A and 42 F-35B under the sixth-generation stealth fight aircraft program, popularly known as F-X or F-3. In addition, the country placed an order with Bell Helicopters for 150 Bell and 412 UH-X transport helicopters in the military rotorcraft segment. Till 2021, three helicopters were delivered, and the remaining aircraft are expected to be delivered by 2039. These multi-purpose helicopters are ordered to replace Japan's Ground Self-Defense Force's (JGSDF) current fleet of UH-1J aircraft.
Japan Aviation Industry Overview
The Japan Aviation Market is fairly consolidated, with the top five companies occupying 89.11%. The major players in this market are Airbus SE, ATR, Kawasaki Heavy Industries, Ltd., Lockheed Martin Corporation and The Boeing Company (sorted alphabetically).
Additional Benefits:
- The market estimate (ME) sheet in Excel format
- 3 months of analyst support
TABLE OF CONTENTS
1 EXECUTIVE SUMMARY & KEY FINDINGS
2 REPORT OFFERS
3 INTRODUCTION
- 3.1 Study Assumptions & Market Definition
- 3.2 Scope of the Study
- 3.3 Research Methodology
4 KEY INDUSTRY TRENDS
- 4.1 Air Passenger Traffic
- 4.2 Air Transport Freight
- 4.3 Gross Domestic Product
- 4.4 Revenue Passenger Kilometers (rpk)
- 4.5 Inflation Rate
- 4.6 Active Fleet Data
- 4.7 Defense Spending
- 4.8 High-net-worth Individual (hnwi)
- 4.9 Regulatory Framework
- 4.10 Value Chain Analysis
5 MARKET SEGMENTATION (includes market size in Value in USD and Volume, Forecasts up to 2030 and analysis of growth prospects)
- 5.1 Aircraft Type
- 5.1.1 Commercial Aviation
- 5.1.1.1 By Sub Aircraft Type
- 5.1.1.1.1 Freighter Aircraft
- 5.1.1.1.2 Passenger Aircraft
- 5.1.1.1.2.1 By Body Type
- 5.1.1.1.2.1.1 Narrowbody Aircraft
- 5.1.1.1.2.1.2 Widebody Aircraft
- 5.1.2 General Aviation
- 5.1.2.1 By Sub Aircraft Type
- 5.1.2.1.1 Business Jets
- 5.1.2.1.1.1 By Body Type
- 5.1.2.1.1.1.1 Large Jet
- 5.1.2.1.1.1.2 Light Jet
- 5.1.2.1.1.1.3 Mid-Size Jet
- 5.1.2.1.2 Piston Fixed-Wing Aircraft
- 5.1.2.1.3 Others
- 5.1.3 Military Aviation
- 5.1.3.1 By Sub Aircraft Type
- 5.1.3.1.1 Fixed-Wing Aircraft
- 5.1.3.1.1.1 By Body Type
- 5.1.3.1.1.1.1 Multi-Role Aircraft
- 5.1.3.1.1.1.2 Transport Aircraft
- 5.1.3.1.1.1.3 Others
- 5.1.3.1.2 Rotorcraft
- 5.1.3.1.2.1 By Body Type
- 5.1.3.1.2.1.1 Multi-Mission Helicopter
- 5.1.3.1.2.1.2 Transport Helicopter
- 5.1.3.1.2.1.3 Others
- 5.1.1 Commercial Aviation
6 COMPETITIVE LANDSCAPE
- 6.1 Key Strategic Moves
- 6.2 Market Share Analysis
- 6.3 Company Landscape
- 6.4 Company Profiles
- 6.4.1 Airbus SE
- 6.4.2 ATR
- 6.4.3 Bombardier Inc.
- 6.4.4 Kawasaki Heavy Industries, Ltd.
- 6.4.5 Lockheed Martin Corporation
- 6.4.6 Textron Inc.
- 6.4.7 The Boeing Company
7 KEY STRATEGIC QUESTIONS FOR AVIATION CEOS
8 APPENDIX
- 8.1 Global Overview
- 8.1.1 Overview
- 8.1.2 Porter's Five Forces Framework
- 8.1.3 Global Value Chain Analysis
- 8.1.4 Market Dynamics (DROs)
- 8.2 Sources & References
- 8.3 List of Tables & Figures
- 8.4 Primary Insights
- 8.5 Data Pack
- 8.6 Glossary of Terms
