


|
시장보고서
상품코드
1693686
아시아태평양의 드라이믹스 모르타르 시장 : 점유율 분석, 산업 동향, 통계, 성장 예측(2025-2030년)Asia-Pacific Dry Mix Mortar - Market Share Analysis, Industry Trends & Statistics, Growth Forecasts (2025 - 2030) |
||||||
■ 보고서에 따라 최신 정보로 업데이트하여 보내드립니다. 배송일정은 문의해 주시기 바랍니다.
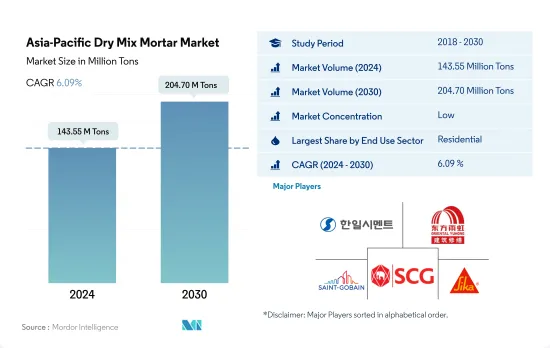
아시아태평양의 드라이믹스 모르타르 시장 규모는 2024년에는 1억 4,355만 톤으로 평가되었으며, 2030년에는 2억 470만 톤에 이를 것으로 예측되며, 예측 기간 중(2024-2030년) CAGR은 6.09%를 나타낼 전망입니다.
주택 수요 증가가 드라이믹스 모르타르의 성장을 이끌 것 같습니다.
- 2022년까지 아시아태평양이 세계 드라이믹스 모르타르 시장의 40.73%를 차지하고 있으며, 압도적인 점유율을 차지하고 있습니다.
- 2022년에는 아시아태평양의 주택 부문이 드라이믹스 모르타르의 주요 소비자로서 대두해 시장의 60.34%를 차지했습니다. 인도네시아 정부는 2025년까지 100만 가구의 주택건설을 목표로 하고 있으며, 이 나라의 주택 총 수요는 3,000만 가구에 달할 것으로 예측되고 있습니다.
- 아시아태평양의 상업 부문은 드라이믹스 모르타르 소비량에서 가장 높은 성장률을 보일 것으로 예측되었으며, 예측 기간 중 CAGR은 7.64%였습니다. 인도 상위 7개 도시 A등급 오피스 시장은 2026년까지 10억 평방 피트로 확대될 전망이며, 2030년까지 12억 평방 피트로 확대될 것으로 예측됩니다.
건설 부문에 대한 정부 투자 증가로 인한 아시아태평양의 드라이믹스 모르타르의 높은 수요 예측
- 시멘트, 모래, 광물, 기능성 첨가물을 정확한 비율로 배합한 드라이믹스 모르타르은 콘크리트 보호, 리노베이션, 렌더링, 좌관, 방수 등의 용도가 있습니다. 호주의 드라이믹스 모르타르 시장은 2022년에 2021년 대비 17.32%의 대폭적인 수량 증가를 기록했습니다.
- 2022년 아시아태평양 드라이믹스 모르타르 시장에서는 중국이 큰 점유율을 차지하고 있습니다. 2021년 1,576억 달러에서 2022년에는 1,656억 달러로 증가했습니다.
- 인도네시아의 드라이믹스 모르타르 시장은 예측기간 중 수량 기준으로 6.74%로 가장 빠른 CAGR을 기록합니다. 인도네시아는 2045년까지 수도를 자카르타에서 보르네오 섬으로 이전하는 320억 달러의 프로젝트에 착수했습니다.
아시아태평양의 드라이믹스 모르타르 시장 동향
인도 등에서 소매점과 사무실 공간이 증가하고 아시아태평양의 상업 건설 분야를 끌어 올립니다.
- 2022년 아시아태평양의 상업시설의 신설 바닥 면적은 전년 대비 3.23% 감소했습니다. 2023년에 이 지역은 반등하여 상업용 건축 신층 면적이 약 1억 4,600만 평방피트 증가했습니다. 이 급증은 주로 외국직접투자(FDI) 증가로 인해 새로운 사무실, 창고, 소매점, 기타 시설 수요에 박차를 가했습니다. 특히 베트남의 건설 부문은 2023년에 7,144만 달러의 FDI 자본을 유치했습니다.
- 2020년 아시아태평양은 상업시설의 신설 바닥 면적에서 대폭적인 후퇴를 경험해 2019년 대비 21.92%의 수량 감소가 되었습니다. 설비, 노동력에 심각한 영향을 주었던 것입니다.
- 아시아태평양의 상업용 신설 바닥 면적은 대폭적인 성장이 예상되며, 2023년에 비해 2030년에는 14억 1,000만 평방 피트 증가할 것으로 추정됩니다. 아시아태평양 지역은 전 세계 소매 성장의 4 분의 3을 차지하며 글로벌 소매 강국으로 부상하고 있습니다.
인도에서는 2030년까지 2,500만 가구에 달할 가능성이 있는 등 저렴한 주택이 증가하고, 이 지역의 주택 건설이 증가하고 있습니다.
- 2022년 아시아태평양의 주택 착공 바닥 면적은 전년 대비 약 5.39% 감소했습니다. 이 지역의 주거 부문은 인구 증가, 부유층 증가, 급속한 도시화에 의해 견인되고 있습니다.
- 2020년 아시아태평양의 주택 신설 바닥 면적은 2019년 대비 약 5.06% 감소했습니다. 이 지역에서는 대폭적인 회복이 보이고, 2021년에는 주택 신설 호수 증가에 의해 주택 신설 바닥 면적이 약 14억 평방 피트 급증했습니다.
- 아시아태평양의 주택 신축 바닥 면적은 예측 기간 동안 CAGR은 3.98%를 보일 것으로 예측됩니다. 이 성장은 주택 수요, 투자 증가, 유리한 정부 정책에 의한 것입니다. 2030년까지 인도 인구의 40% 이상이 도시에 거주하게 될 것으로 예상되며, 추가로 2,500만 가구의 저렴한 주택 수요가 발생할 것으로 전망됩니다.
아시아태평양 드라이믹스 모르타르 산업 개요
아시아태평양의 드라이믹스 모르타르 시장은 세분화되어 있으며 상위 5개 기업에서 12.67%를 차지하고 있습니다.
기타 혜택
- 엑셀 형식 시장 예측(ME) 시트
- 3개월의 애널리스트 서포트
목차
제1장 주요 요약과 주요 조사 결과
제2장 보고서 제안
제3장 소개
- 조사의 전제조건과 시장 정의
- 조사 범위
- 조사 방법
제4장 주요 산업 동향
- 최종 용도 분야의 동향
- 상업
- 산업 및 시설
- 인프라
- 주택
- 주요 인프라 프로젝트(현재 및 발표됨)
- 규제 프레임워크
- 밸류체인과 유통채널 분석
제5장 시장 세분화
- 최종 용도 분야
- 상업
- 산업 및 시설
- 인프라
- 주택
- 용도
- 콘크리트 보호 및 개수
- 그라우트
- 단열과 마무리 시스템
- 석고
- 렌더
- 타일 접착제
- 방수 슬러리
- 기타 용도
- 국가명
- 호주
- 중국
- 인도
- 인도네시아
- 일본
- 말레이시아
- 한국
- 태국
- 베트남
- 기타 아시아태평양
제6장 경쟁 구도
- 주요 전략 동향
- 시장 점유율 분석
- 기업 상황
- 기업 프로파일
- Asia Cement Co., Ltd.
- BBMG Corporation
- HANIL HOLDINGS CO.,LTD.
- MBCC Group
- Oriental Yuhong
- Saint-Gobain
- SAMPYO GROUP
- SCG
- Sika AG
- UltraTech Cement Ltd.
제7장 CEO에 대한 주요 전략적 질문
제8장 부록
- 세계 개요
- 개요
- Five Forces 분석 프레임워크(산업 매력도 분석)
- 세계의 밸류체인 분석
- 시장 역학(DROs)
- 정보원과 참고문헌
- 도표 일람
- 주요 인사이트
- 데이터 팩
- 용어집
The Asia-Pacific Dry Mix Mortar Market size is estimated at 143.55 million Tons in 2024, and is expected to reach 204.70 million Tons by 2030, growing at a CAGR of 6.09% during the forecast period (2024-2030).

Rising demand for housing units is likely to drive the dry mix mortar growth
- By 2022, Asia-Pacific dominated the global dry mix mortar market, accounting for 40.73% of the total share. In 2023, the region's dry mix mortar consumption grew by 4.07% in volume, driven by rising demand from both commercial and residential construction sectors.
- In 2022, the residential sector in Asia-Pacific emerged as the leading consumer of dry mix mortar, comprising 60.34% of the market. Factors such as increasing urbanization, government initiatives, and investments, both domestic and foreign, fueled the region's housing needs. For example, the Government of Indonesia (GOI) aimed to build 1 million housing units by 2025, with the country's total housing demand projected to hit 30 million units. Consequently, the demand for dry mix mortar in the residential sector was forecast to surge from 81.5 million tons in 2023 to 119.7 million tons in 2030.
- The commercial sector in Asia-Pacific was poised to witness the highest growth rate in dry mix mortar consumption, with a CAGR of 7.64% during the forecast period. Anticipated growth in shopping malls, office spaces, and retail centers led to a rise of 178 million sq. ft in commercial floor area in 2025 compared to the previous year. For instance, India's Grade A office market in its top seven cities was projected to expand to 1 billion square feet by 2026 and further to 1.2 billion square feet by 2030. Consequently, the demand for dry mix mortar in the commercial sector was estimated to increase by 13.95 million tons by 2030 compared to 2023.
High demand for dry-mix mortar forecast in Asia-pacific due to rising government investments in the construction sector
- Dry-mix mortar, comprising cement, sand, minerals, and functional additives in precise ratios, finds applications in concrete protection, renovation, rendering, plastering, and waterproofing. Australia's dry-mix mortar market witnessed a significant 17.32% volume growth in 2022 compared to 2021. In the year 2023, Asia-Pacific, driven by robust investments in residential and infrastructure construction, experienced a 4.07% volume growth over the previous year.
- In the year 2022, China held a substantial share of the Asia-Pacific dry-mix mortar market. Despite government-imposed lockdowns, China's infrastructure sector witnessed a 4.29% volume growth between 2021 and 2022. This growth was fueled by a notable increase in transport infrastructure spending, rising from USD 157.6 billion in 2021 to USD 165.6 billion in 2022. Additionally, the residential construction sector in China underwent significant reforms and policy changes, rekindling consumer interest in property purchases. With continued investments and initiatives, the Chinese market experienced a 3.83% volume growth in 2023.
- Indonesia's dry-mix mortar market is set to witness the fastest CAGR of 6.74% in volume during the forecast period. Under the "Capital City Bill," Indonesia embarked on a USD 32 billion project to relocate its capital from Jakarta to Borneo Island by the year 2045. This ambitious endeavor encompasses housing complexes, manufacturing units, and infrastructure, signaling a surge in dry-mix mortar demand.
Asia-Pacific Dry Mix Mortar Market Trends
Rising retail and office spaces in countries such as India to boost the Asia-Pacific commercial construction sector
- In 2022, Asia-Pacific witnessed a 3.23% decline in its commercial new floor area compared to the previous year. This setback was attributed to factors such as regulatory pressures, higher inflation, and a surge in mortgage rates. In 2023, the region rebounded, with commercial construction new floor area increasing by approximately 146 million sq. ft. This surge was primarily driven by a rise in foreign direct investment (FDI), which spurred the demand for new offices, warehouses, retail outlets, and other facilities. Notably, the Vietnamese construction sector attracted an FDI capital of USD 71.44 million in 2023.
- In 2020, the Asia-Pacific region experienced a significant setback in commercial new floor area, with a volume decline of 21.92% compared to 2019. This decline was primarily due to widespread government lockdowns, which disrupted project work and severely impacted supply chains, equipment, and labor. However, as restrictions eased, the region witnessed a remarkable rebound, with its commercial new floor area surging by 20.98% in 2021, reaching a volume of approximately 526 million sq. ft.
- Asia-Pacific's commercial new floor area is projected to witness substantial growth, with an estimated increase of 1.41 billion sq. ft by 2030 compared to 2023. This surge is fueled by a rising demand for shopping malls, office spaces, retail outlets, and more. The Asia-Pacific region is emerging as a global retail powerhouse, contributing to nearly three-quarters of the worldwide retail growth. For instance, the Indian Grade A office market in its top seven cities may to expand to 1 billion sq. ft by 2026 and further to 1.2 billion sq. ft. by 2030. Overall, the commercial new floor area in Asia-Pacific is projected to witness a volume CAGR of 5.16% during the forecast period.
Rising affordable housing units, such as India's likely to reach 25 million by 2030, to augment the residential constructions in the region
- In 2022, the residential new floor area in the Asia-Pacific region saw a volume decline of approximately 5.39% from the previous year. This dip was a result of the sector normalizing after a surge in building activity during the COVID-19 pandemic. The region's residential sector is driven by a growing population, increasing wealth, and rapid urbanization. The residential new floor area in the region was expected to rise by 410 million sq. ft in 2023 compared to 2022.
- In 2020, the residential new floor area in Asia-Pacific declined in volume by around 5.06% compared to 2019. This was primarily due to government-imposed lockdowns, disruptions in the supply chain, labor shortages, reduced construction productivity, and low foreign investments. However, as restrictions eased, the region saw a significant rebound, with the residential new floor area surging by about 1.4 billion sq. ft in 2021, driven by the addition of new residential housing units. For instance, in 2021 alone, the Indian residential real estate market introduced approximately 163 thousand new residential units across its top seven cities.
- The residential new floor area in the Asia-Pacific region is projected to witness a CAGR of 3.98% during the forecast period. This growth can be attributed to the demand for housing, increased investments, and favorable government policies. The focus on constructing more affordable housing units is expected to rejuvenate the residential construction sector in the region, aiding its recovery. By 2030, it is estimated that over 40% of India's population will reside in urban areas, leading to a demand for an additional 25 million affordable housing units. This surge in demand is expected to push the Indian residential real estate market to reach 1.5 million units by 2030.
Asia-Pacific Dry Mix Mortar Industry Overview
The Asia-Pacific Dry Mix Mortar Market is fragmented, with the top five companies occupying 12.67%. The major players in this market are HANIL HOLDINGS CO.,LTD., Oriental Yuhong, Saint-Gobain, SCG and Sika AG (sorted alphabetically).
Additional Benefits:
- The market estimate (ME) sheet in Excel format
- 3 months of analyst support
TABLE OF CONTENTS
1 EXECUTIVE SUMMARY & KEY FINDINGS
2 REPORT OFFERS
3 INTRODUCTION
- 3.1 Study Assumptions & Market Definition
- 3.2 Scope of the Study
- 3.3 Research Methodology
4 KEY INDUSTRY TRENDS
- 4.1 End Use Sector Trends
- 4.1.1 Commercial
- 4.1.2 Industrial and Institutional
- 4.1.3 Infrastructure
- 4.1.4 Residential
- 4.2 Major Infrastructure Projects (current And Announced)
- 4.3 Regulatory Framework
- 4.4 Value Chain & Distribution Channel Analysis
5 MARKET SEGMENTATION (includes market size, forecasts up to 2030 and analysis of growth prospects.)
- 5.1 End Use Sector
- 5.1.1 Commercial
- 5.1.2 Industrial and Institutional
- 5.1.3 Infrastructure
- 5.1.4 Residential
- 5.2 Application
- 5.2.1 Concrete Protection and Renovation
- 5.2.2 Grouts
- 5.2.3 Insulation and Finishing Systems
- 5.2.4 Plaster
- 5.2.5 Render
- 5.2.6 Tile Adhesive
- 5.2.7 Water Proofing Slurries
- 5.2.8 Other Applications
- 5.3 Country
- 5.3.1 Australia
- 5.3.2 China
- 5.3.3 India
- 5.3.4 Indonesia
- 5.3.5 Japan
- 5.3.6 Malaysia
- 5.3.7 South Korea
- 5.3.8 Thailand
- 5.3.9 Vietnam
- 5.3.10 Rest of Asia-Pacific
6 COMPETITIVE LANDSCAPE
- 6.1 Key Strategic Moves
- 6.2 Market Share Analysis
- 6.3 Company Landscape
- 6.4 Company Profiles
- 6.4.1 Asia Cement Co., Ltd.
- 6.4.2 BBMG Corporation
- 6.4.3 HANIL HOLDINGS CO.,LTD.
- 6.4.4 MBCC Group
- 6.4.5 Oriental Yuhong
- 6.4.6 Saint-Gobain
- 6.4.7 SAMPYO GROUP
- 6.4.8 SCG
- 6.4.9 Sika AG
- 6.4.10 UltraTech Cement Ltd.
7 KEY STRATEGIC QUESTIONS FOR CONCRETE, MORTARS AND CONSTRUCTION CHEMICALS CEOS
8 APPENDIX
- 8.1 Global Overview
- 8.1.1 Overview
- 8.1.2 Porter's Five Forces Framework (Industry Attractiveness Analysis)
- 8.1.3 Global Value Chain Analysis
- 8.1.4 Market Dynamics (DROs)
- 8.2 Sources & References
- 8.3 List of Tables & Figures
- 8.4 Primary Insights
- 8.5 Data Pack
- 8.6 Glossary of Terms


샘플 요청 목록