


|
시장보고서
상품코드
1693753
미국의 바이오 방제제 시장 : 시장 점유율 분석, 산업 동향, 통계, 성장 예측(2025-2030년)United States Biocontrol Agents - Market Share Analysis, Industry Trends & Statistics, Growth Forecasts (2025 - 2030) |
||||||
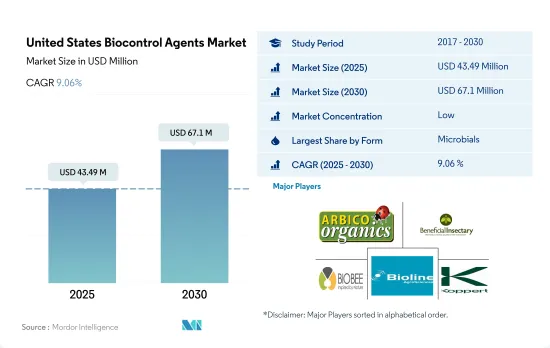
미국의 바이오 방제제 시장 규모는 2025년에 4,349만 달러로 추정되고, 2030년에는 6,710만 달러에 이를 전망이며, 예측 기간인 2025-2030년 CAGR 9.06%를 보일 것으로 예측됩니다.
- 미국에서는 농업 생물 제제 시장에서 바이오 방제제가 2번째로 많이 소비되고 있습니다. 2022년 작물 보호 부문에서의 점유율은 2.6%였습니다.
- 미생물 기반의 바이오 방제제는 미국의 바이오 방제제 시장에서 가장 소비되고 있으며 2022년에는 89.1%의 점유율을 차지했습니다. 세균, 진균, 바이러스, 원생 동물이 이러한 미생물의 일부입니다. 미생물은 세 가지 다른 방법으로 바이오 방제제 역할을 합니다. : 해충에 질병을 주입하거나 해충과 경쟁하거나 혹은 해충을 죽입니다.
- 시장의 진균 바이오 방제제 부문은 2022년 금액 기준으로 미생물 바이오 방제제 시장 전체의 약 62.7%를 차지했습니다. 진균 바이오 방제제 시장 규모는 2017-2022년 약 44.4% 증가하였는데, 이는 종합적 해충관리 및 지속가능한 농업에 대한 농업 종사자들의 의식고조에 기인한다고 볼 수 있습니다.
- 미국에서의 2022년의 매크로비알계 바이오 방제제의 점유율은 10.9%였습니다. 매크로 생물은 해충의 천적이며, 무척추 동물의 바이오 방제제로 알려져 있습니다. 여기에는 진드기, 곤충 포식자, 기생충, 곤충 병원성 선충(EPN)이 포함됩니다.
- 포식자가 바이오 방제제 시장을 독점하고, 2022년 시장 매출의 약 83.8%를 차지했습니다. 바이오 방제제 시장 전체에서 포식자 부문의 우위성은 주로 해충이 다른 라이프 스테이지, 또 다른 해충 종을 공격하는 능력에 의한 것입니다. 다른 바이오 방제제에 비해 포식자는 탐욕스럽습니다.
- 대장균 기반의 바이오 방제제와 미생물 기반의 바이오 방제제를 사용함으로써, 화학 농약의 필요성을 줄일 수 있어, 재배의 전체적인 비용을 직접 삭감할 수 있습니다.
미국의 바이오 방제제 시장 동향
국가의 법규제로 특히 연작작물에서 유기재배 면적 증가
- 2021년 미국의 유기농업 재배면적은 62만 3,000헥타르였습니다. 미국의 유기농업은 지난 20년간 큰 폭으로 증가했지만, 그 대부분은 특정 법률이나 규제의 도입에 의한 것입니다. 캘리포니아주의 유기농 농장과 목장의 수는 2021년에는 3,061개로 미국에서 가장 많은 유기농 인증 농장이 있었습니다. 펜실베니아 주에는 1,125개 이상의 유기 인증 농장이 있었습니다. 2019년 가동 중인 인증 유기농 농장은 1,554만 8,000여 개가 작물을 재배하고 713만 9,000여 개 농장이 목초지와 방목지를 운영하고 있었습니다. 모판과 온실에서 나온 것을 포함한 작물의 판매액은 거의 58억 달러에 달했습니다.
- 국내의 유기농업은 경작 작물이 차지하고 있습니다. 2021년에는 유기농지 전체의 약 71.8%를 차지했습니다. 곡류 생산이 이 나라 농업 부문의 대부분을 차지하고 있습니다. 주요 곡물에는 옥수수, 밀, 쌀, 수수 등이 있습니다. 유기농 제품의 소비는 다양한 건강상의 이점으로 인해 유기농 식품을 선택하게 된 미국 소비자들 사이에서 인기를 끌고 있습니다.
- 유기 원예 작물 전체의 재배 면적은 증가 경향에 있으며, 2017년의 11만 2,900헥타르에서 2021년에는 15만 6,100헥타르가 되었습니다. 2021년의 국내 생산에 대해서는, 과일 및 채소의 상위 5품목은 사과(31.1%), 딸기(9.5%), 오렌지(6.9%), 로메인 양상추(6.7%), 감자(6.2%)입니다. 무역의 경우, 수입이 많은 것은 바나나(53.1%), 아보카도(7.7%), 망고(5.8%), 블루베리(5.0%), 호박(4.3%)이며, 수출이 많은 것은 사과(80.0%), 배(14.4%), 체리(4.0%), 건조 양파 (1.5 %), 감자 (0.2 %)였습니다.
과일 및 야채 부문을 중심으로 하는 유기 농산물에 대한 수요 증가, 유기식품에 대한 1인당 지출액 증가
- 미국은 세계 유수의 유기 제품 소비국입니다. 뉴트리션 비즈니스 저널지(NBJ, 2021년)에 의하면, 2020년 시점에서 이 나라의 유기 식품의 총 매출액은 516억 달러를 차지했습니다. 미국은 북미에서 유기농 제품에 대한 1인당 지출이 가장 컸으며, 2021년에는 186.7달러에 해당했습니다.
- 유기농 신선한 과일 및 채소는 유기농 식품 소매 산업의 설립 이래 유기농 식품의 주요 범주가 되고 있습니다. 2020년에는 이들 유기농 제품의 소매 매출액은 200억 달러로 평가되어 유기농 농산물에 대한 수요가 높아지고 있습니다. 유기농 신선 과일 및 채소에 대한 수요는 지난 20년간 꾸준히 증가하고 있습니다. 유기농 식품의 매출이 증가하고 있는 것은, 특히 고소득층의 소비자 의식의 고조에 의한 것입니다. 가장 수요가 높은 유기농 식품 카테고리에는 계란, 유제품, 과일, 야채 등의 기본 식품이 포함됩니다.
- 유기농 식품의 기호는 인구층과 지역에 따라 다릅니다. 18-29세의 젊은층은 65세 이상의 고령층에 비해 유기농 제품을 요구하는 경향이 강합니다(50% 초과). 소득과 지역도 관련되어 있으며, 소득이 3만 달러 이하인 사람의 42%, 7만 5,000 USD 이상의 사람의 49%가 유기농 제품을 요구하고 있습니다.
- 유기농 제품에 대한 1인당 지출은 국내에서 증가하고 있으며 2017-2021년 CAGR 5.2%를 기록했습니다. 유기농 제품에 대한 수요의 증가는 미국의 유기농 생산자들이 국내외 고가치 시장을 개척할 기회를 창출하고 있습니다. 유기농 제품과 관련된 가격 프리미엄은 저소득층 소비자에게 유기농 식품 소비의 주요 제한 요인 중 하나입니다.
미국의 바이오 방제제 산업 개요
미국의 바이오 방제제 시장은 부문화되어 상위 5개사에서 28.07%를 차지하고 있습니다. 이 시장의 주요 기업은 Arizona Biological Control Inc., Beneficial Insectary Inc., Biobee Ltd, Bioline AgroSciences Ltd, Koppert Biological Systems Inc. 등입니다.
기타 혜택
- 엑셀 형식 시장 예측(ME) 시트
- 3개월의 애널리스트 서포트
목차
제1장 주요 요약 및 주요 조사 결과
제2장 보고서 제안
제3장 서문
- 조사의 전제조건 및 시장 정의
- 조사 범위
- 조사 방법
제4장 주요 산업 동향
- 유기 재배 면적
- 1인당 유기농 제품에 지출
- 규제 프레임워크
- 미국
- 밸류체인 및 유통 채널 분석
제5장 시장 세분화
- 형태별
- 매크로 미생물
- 생물별
- 곤충병원성 선충
- 기생충
- 포식자
- 미생물
- 생물별
- 세균성 바이오 방제제
- 곰팡이 바이오 방제제
- 기타 미생물
- 매크로 미생물
- 작물 유형별
- 환금작물
- 원예작물
- 경작작물
제6장 경쟁 구도
- 주요 전략적 움직임
- 시장 점유율 분석
- 기업 상황
- 기업 프로파일
- Andermatt Group AG
- Arizona Biological Control Inc.
- Beneficial Insectary Inc.
- Biobee Ltd
- Bioline AgroSciences Ltd
- Bioworks Inc.
- Koppert Biological Systems Inc.
제7장 CEO에 대한 주요 전략적 질문
제8장 부록
- 세계 개요
- 개요
- Porter's Five Forces 분석 프레임워크
- 세계의 밸류체인 분석
- 시장 역학(DROs)
- 정보원 및 참고문헌
- 도표 일람
- 주요 인사이트
- 데이터 팩
- 용어집
The United States Biocontrol Agents Market size is estimated at 43.49 million USD in 2025, and is expected to reach 67.1 million USD by 2030, growing at a CAGR of 9.06% during the forecast period (2025-2030).

- Biocontrol agents are the second most consumed in the agricultural biologicals market in the United States. They accounted for a share of 2.6% in the crop protection segment in 2022.
- Microbials-based biocontrol agents are most consumed in the biocontrol agents market in the United States, and they accounted for a share of 89.1% in 2022. Bacteria, fungi, viruses, and protozoans are some of these microbes. In three different ways, microbes function as biocontrol agents: either they inject pests with diseases, outcompete them, or even kill them.
- The fungi biocontrol agents segment of the market accounted for about 62.7% of the total microbial biocontrol agents market by value in 2022. The market value for fungal biocontrol agents increased by about 44.4% from 2017 to 2022, which can be attributed to farmers' increased awareness of integrated pest management and sustainable agriculture.
- Macrobials-based biocontrol agents accounted for a share of 10.9% in the United States in 2022. Macrobials are natural enemies of pests and are known as invertebrate biocontrol agents. They include mites, insect predators, parasitoids, and entomopathogenic nematodes (EPNs).
- Predators dominated the biocontrol agents market, and they accounted for about 83.8% of the market value in 2022. The dominance of the predators' segment in the overall biocontrol agents market is mainly due to their ability to attack different life stages of pests and even different pest species. They are voracious feeders compared to other biocontrol agents.
- Using macrobials-based and microbials-based biocontrol agents can reduce the need for chemical pesticides, directly reducing the overall cost of cultivation.
United States Biocontrol Agents Market Trends
Increase in organic area, particularly in row crops, due to country's laws and regulations
- In 2021, the area under organic agricultural farming in the United States was 623 thousand hectares. Organic agriculture in the United States has increased significantly in the previous 20 years, mostly due to the introduction of particular laws and regulations. The number of organic farms and ranches in California was 3,061 in 2021, the largest number of certified organic farms in the United States. There were over 1,125 certified organic farms in Pennsylvania. Nearly 15,548 thousand certified organic farms in operation used cropland in 2019, while 7,139 thousand farms operated pastureland and rangeland. The sales value of crops, including those from nurseries and greenhouses, amounted to nearly USD 5.8 billion.
- Row crops dominated organic farming in the nation. In 2021, they accounted for about 71.8% of all organic cropland. The production of cereal crops predominates the country's agricultural sector. The main cereals include maize, wheat, rice, and millet. The consumption of organic products has become popular among US consumers who increasingly choose to eat organic foods because of their various health benefits.
- There is an increasing trend in the overall organic horticultural crop cultivation area, from 112.9 thousand hectares in 2017 to 156.1 thousand hectares in 2021. Regarding domestic production in 2021, the top five fruits and vegetables were apples (31.1%), strawberries (9.5%), oranges (6.9%), romaine lettuce (6.7%), and potatoes (6.2%). In the case of trade, the most imported produce was bananas (53.1%), avocados (7.7%), mangoes (5.8%), blueberries (5.0%), and squashes (4.3%), while the most exported were apples (80.0%), pears (14.4%), cherries (4.0%), dried onions (1.5%), and potatoes (0.2%).
Growing demand for organic produce especially in the fruits and vegetables sector, rise in per capita spending on organic food
- The United States is one of the largest organic product consumers in the world. As of 2020, the total sales of organic food products in the country accounted for USD 51.6 billion, according to the Nutrition Business Journal (NBJ, 2021). The United States had the largest per capita spending on organic products in the North American region, worth USD 186.7 in 2021.
- Organic fresh fruits and vegetables have been the leading category of organic food since the establishment of the organic food retail industry. In 2020, retail sales for these organic products were valued at USD 20.0 billion, showing a growing demand for organic produce. The demand for organic fresh fruits and vegetables has steadily risen over the past two decades. Organic food sales are rising due to growing consumer awareness, especially among high-income consumers. The most in-demand organic categories include basic foods like eggs, dairy, fruits, and vegetables.
- Organic food preferences vary by demographic and region. Younger people aged between 18 and 29 are more likely to seek organic products (over 50%) compared to older people aged 65 and above. Income and region also play a role, with 42% of those with under USD 30,000 income and 49% of those with over USD 75.0 thousand seeking organic products.
- The per capita spending on organic products is increasing in the country, recording a CAGR of 5.2% between 2017 and 2021. The growing demand for organic products is creating opportunities for US organic producers to tap into high-value markets both domestically and abroad. The price premium associated with organic products is one of the major limiting factors for organic food consumption for low-income consumers.
United States Biocontrol Agents Industry Overview
The United States Biocontrol Agents Market is fragmented, with the top five companies occupying 28.07%. The major players in this market are Arizona Biological Control Inc., Beneficial Insectary Inc., Biobee Ltd, Bioline AgroSciences Ltd and Koppert Biological Systems Inc. (sorted alphabetically).
Additional Benefits:
- The market estimate (ME) sheet in Excel format
- 3 months of analyst support
TABLE OF CONTENTS
1 EXECUTIVE SUMMARY & KEY FINDINGS
2 REPORT OFFERS
3 INTRODUCTION
- 3.1 Study Assumptions & Market Definition
- 3.2 Scope of the Study
- 3.3 Research Methodology
4 KEY INDUSTRY TRENDS
- 4.1 Area Under Organic Cultivation
- 4.2 Per Capita Spending On Organic Products
- 4.3 Regulatory Framework
- 4.3.1 United States
- 4.4 Value Chain & Distribution Channel Analysis
5 MARKET SEGMENTATION (includes market size in Value in USD and Volume, Forecasts up to 2030 and analysis of growth prospects)
- 5.1 Form
- 5.1.1 Macrobials
- 5.1.1.1 By Organism
- 5.1.1.1.1 Entamopathogenic Nematodes
- 5.1.1.1.2 Parasitoids
- 5.1.1.1.3 Predators
- 5.1.2 Microbials
- 5.1.2.1 By Organism
- 5.1.2.1.1 Bacterial Biocontrol Agents
- 5.1.2.1.2 Fungal Biocontrol Agents
- 5.1.2.1.3 Other Microbials
- 5.1.1 Macrobials
- 5.2 Crop Type
- 5.2.1 Cash Crops
- 5.2.2 Horticultural Crops
- 5.2.3 Row Crops
6 COMPETITIVE LANDSCAPE
- 6.1 Key Strategic Moves
- 6.2 Market Share Analysis
- 6.3 Company Landscape
- 6.4 Company Profiles (includes Global Level Overview, Market Level Overview, Core Business Segments, Financials, Headcount, Key Information, Market Rank, Market Share, Products and Services, and Analysis of Recent Developments).
- 6.4.1 Andermatt Group AG
- 6.4.2 Arizona Biological Control Inc.
- 6.4.3 Beneficial Insectary Inc.
- 6.4.4 Biobee Ltd
- 6.4.5 Bioline AgroSciences Ltd
- 6.4.6 Bioworks Inc.
- 6.4.7 Koppert Biological Systems Inc.
7 KEY STRATEGIC QUESTIONS FOR AGRICULTURAL BIOLOGICALS CEOS
8 APPENDIX
- 8.1 Global Overview
- 8.1.1 Overview
- 8.1.2 Porter's Five Forces Framework
- 8.1.3 Global Value Chain Analysis
- 8.1.4 Market Dynamics (DROs)
- 8.2 Sources & References
- 8.3 List of Tables & Figures
- 8.4 Primary Insights
- 8.5 Data Pack
- 8.6 Glossary of Terms
