


|
시장보고서
상품코드
1693758
유럽의 바이오 방제제 시장 : 시장 점유율 분석, 산업 동향 및 통계, 성장 예측(2025-2030년)Europe Biocontrol Agents - Market Share Analysis, Industry Trends & Statistics, Growth Forecasts (2025 - 2030) |
||||||
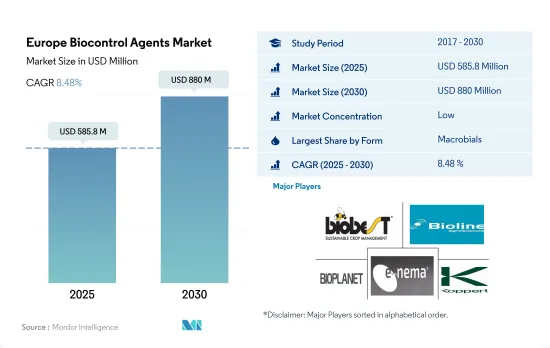
유럽의 바이오 방제제 시장 규모는 2025년에 5억 8,580만 달러로 추정되고, 2030년에는 8억 8,000만 달러에 이를 전망이며, 예측 기간인 2025-2030년 CAGR 8.48%로 성장할 것으로 예측됩니다.

- 매크로 바이오 방제제가 시장을 독점하고 있으며, 2022년 시장 규모는 약 4억 5,880만 달러였습니다. 그 우위성은 주로 환경에 해를 끼치지 않고 광범위한 해충을 효과적으로 구제하는 능력에 의한 것입니다.
- 매크로 바이오 방제제 중에서는 포식 동물이 시장을 독점하고 있으며, 2022년 시장 규모는 3억 9,990만 달러였습니다. 바이오 방제제 시장 전체에 있어서 포식자 부문의 우위성은 해충이 다른 라이프 스테이지, 또 다른 해충 종을 공격하는 능력에 의한 것입니다. 포식자는 다른 바이오 방제제에 비해 탐욕스럽게 먹이를 먹습니다.
- 연작 작물은 주로 이 지역에서의 재배 면적이 크므로 매크로 바이오 방제제 시장을 독점하고 있습니다. 연작 작물에서 매크로 바이오 방제제 소비액은 2029년까지 6억 9,530만 달러에 이를 것으로 예상되고 있습니다.
- 미생물 바이오 방제제 시장 점유율은 매크로 바이오 방제제에 비해 한정적이지만, 그 이유는 입수 가능성이 제한되어 있는 것, 농업 종사자 사이에서 이용 메커니즘에 관한 인식이 낮고, 등록이나 상품화 프로세스가 복잡하다는 등 다양한 요인이 있습니다.
- 세균성 바이오 방제제는 미생물 시장을 독점해, 2022년에는 그 금액의 약 89.0%를 차지했습니다. 세균성 바이오 방제제는 주로, 다양한 병이나 해충을 구제하는 능력에 의해 우위를 차지하고 있습니다
- 그러나 종합적 해충 관리 프로그램에서는 포식자와 기생충 등의 매크로 생물 바이오 방제제의 사용이 추진되고 있습니다. 유럽위원회는 농업 종사자나 어드바이저를 지원할 수 있는 종합적 해충 관리 툴을 추진하고 있으며, 이것이 2023-2029년 매크로 바이오 방제제 시장 규모를 끌어올릴 가능성이 있습니다.
- 미생물은 화학적 식물 보호 제품을 대체하는 것으로 인기가 높아지고 있으며, 농업 종사자에게 작물의 해충이나 병해를 구제하는 효과적인 툴을 제공하는 동시에, 환경에 대한 영향을 경감하고 있습니다. 유럽의 바이오 방제제 시장은 미생물을 함유한 바이오 식물보호 제품의 승인 및 인가 과정을 간소화하는 4개 법률이 유럽위원회 회원국에 의해 승인되었기 때문에 2022년 꾸준한 성장세를 보였습니다. 그 목적은 농업 종사자들에게 화학 식물 보호 제품의 대체가 되는 효과적인 수단을 제공하고 Farm-to-Fork 전략의 목표를 달성하는 것입니다.
- 러시아는 현재 유럽의 바이오 방제제 시장에서 가장 큰 점유율을 차지하고 있으며, 2022년 금액 점유율은 55.5%, 수량 점유율은 21.2%였습니다. 원예작물의 재배 증가와 작물을 가해하는 새로운 해충의 발견이 러시아 시장의 새로운 성장을 견인하여 2023-2029년 CAGR은 8.3%로 예측되고 있습니다.
- 유기농업은 EU농업 분야의 주요 산업이며, 2019년에는 EU에서 약 33만 호의 유기농업 종사자가 탄생하여 회원국의 경작면적의 최대 20%를 차지했습니다. Farm-to-Fork 전략의 목표 중 하나는 EU에서 유기농업을 하는 농지의 총 면적을 확대하는 것이며 2030년까지 EU 농지의 최소 25%를 유기농업으로 만들 계획입니다.
- 신규제는 EU의 유기농업 종사자는 바이오 식물 보호 제품에 사용되는 미생물에 대한 접근이 용이해질 것으로 기대되고 있습니다. 이를 통해 식물 해충을 구제하기 위한 새로운 지속가능한 선택지가 제공되어 보다 환경 친화적이고 지속가능한 농업에 대한 접근에 공헌하게 됩니다.
유럽의 바이오 방제제 시장 동향
유럽의 그린딜은 이 지역 전체의 유기 재배 증가에 크게 기여하고 있습니다.
- 유럽 국가에서는 유기농업의 추진이 진행되고 있어 유기재배로 분류되는 토지의 양은 지난 10년간 대폭 증가하고 있습니다. 2021년 3월 유럽위원회는 2030년까지 농지의 25%를 유기농업으로 만들겠다는 유럽 그린딜 목표를 달성하기 위해 유기행동계획을 수립했습니다. 오스트리아, 이탈리아, 스페인, 독일은 유럽의 유기농 주요 국가 중 하나입니다. 이탈리아는 농지 면적의 15.0%를 유기농으로 재배하고 있으며 EU 평균인 7.5%를 웃돌고 있습니다.
- 2021년에는 EU의 유기 재배지가 1,470만 헥타르로 기록되었습니다. 농업 생산 면적은, 경지 작물(주로 곡물, 근채류, 신선 야채), 영속적 초지, 영속적 작물의 3개의 주요한 이용 유형으로 나눌 수 있습니다. 2021년 유기경지 면적은 650만 헥타르로 EU 전체 유기농업 면적의 46%에 해당합니다.
- EU에서 곡물, 지방종자, 단백질 작물, 콩류의 유기 재배 면적은 2017-2021년 사이에 32.6% 증가하여 160만 헥타르를 초과했습니다. 130만 헥타르에서 생산되는 다년생 작물은 2020년에는 유기농 재배지의 15%를 차지했습니다. 올리브, 포도, 아몬드, 감귤류는 이 그룹에 속하는 작물의 몇 가지 예입니다. 스페인, 이탈리아, 그리스는 유기농 올리브의 중요한 재배국이며, 최근에는 각각 197,000 헥타르, 179,000 헥타르, 47,000 헥타르입니다. 올리브도 포도도 국내외에 수요가 있는 특산품으로 가공할 수 있기 때문에 유럽의 농업에 있어서 매우 중요합니다. 이 지역의 유기농 면적 증가는 유럽의 유기농 산업을 강화할 것으로 예상됩니다.
이 지역의 유기 제품에 대한 수요 증가와 1인당 지출 증가
- 유럽의 소비자는 자연재료나 자연제법으로 만들어진 상품을 점점 구입하게 되고 있습니다. 유기 식품이 유럽 연합 전체의 농업 생산에 차지하는 비율은 아직 미미하지만 더 이상 틈새 산업이 아닙니다. 유럽연합은 유기농 상품의 단일 시장으로는 국제적으로 두 번째로 크고, 1인당 연간 평균 지출액은 74.8달러입니다. 유럽의 유기농 식품에 대한 1인당 지출은 지난 10년간 두 배로 증가했습니다. 2020년에는 스위스와 덴마크의 소비자가 유기농 식품에 가장 많이 지출했습니다(각각 1인당 494.09달러와 453.90달러).
- 세계의 유기 무역 데이터에 따르면 독일은 유럽 최대의 유기농 식품 시장으로 미국에 이어 세계 2위 시장 규모를 자랑하며 2021년 시장 규모는 63억 달러, 1인당 소비액은 75.6달러였습니다. 이 나라는 세계 유기농 식품 수요의 10.0%를 차지하고 2021-2026년 2.7%의 CAGR로 추이할 것으로 추정됩니다.
- 프랑스의 유기농 식품 시장은 강력한 성장을 보였으며, 2021년 소매 매출은 12.6% 증가했습니다. 세계 유기농 무역 데이터에 따르면, 이 나라의 유기농 식품에 대한 1인당 지출액은 2021년에 88.8달러를 기록했습니다. 2018년 Agence BIO/Spirit Insight Barometer가 기록한 바와 같이 프랑스인의 88%가 유기농 제품을 소비한 적이 있다고 선언했습니다. 건강, 환경, 동물 복지의 보호가 프랑스에서 유기농 식품을 소비하는 주요 이유입니다. 유기농 시장은 스페인, 네덜란드, 스웨덴을 포함한 다른 몇몇 국가에서도 유기농 스토어의 개점과 함께 성장하기 시작하고 있습니다. 유기농 식품 매출은 코로나19 대유행 중과 그 이후로 늘었다. 소비자들이 건강 문제에 관심을 갖기 시작하면서 기존 재배 식품의 악영향을 알았기 때문입니다.
유럽의 바이오 방제제 산업 개요
유럽의 바이오 방제제 시장은 세분화되어 있으며 상위 5개 기업에서 27.60%를 차지하고 있습니다. 이 시장이 주요 기업은 Biobest Group NV, Bioline AgroSciences Ltd, Bioplanet France, E-NEMA GmbH, Koppert Biological Systems Inc. 등입니다.
기타 혜택
- 엑셀 형식 시장 예측(ME) 시트
- 3개월의 애널리스트 서포트
목차
제1장 주요 요약 및 주요 조사 결과
제2장 보고서 제안
제3장 서문
- 조사의 전제조건 및 시장 정의
- 조사 범위
- 조사 방법
제4장 주요 산업 동향
- 유기 재배 면적
- 1인당 유기농 제품에 대한 지출
- 규제 프레임워크
- 프랑스
- 독일
- 이탈리아
- 네덜란드
- 러시아
- 스페인
- 튀르키예
- 영국
- 밸류체인 및 유통 채널 분석
제5장 시장 세분화
- 형태별
- 매크로 미생물
- 생물별
- 곤충병원성 선충
- 기생충
- 포식자
- 미생물
- 생물별
- 세균성 바이오 방제제
- 곰팡이 바이오 방제제
- 기타 미생물
- 매크로 미생물
- 작물 유형별
- 환금작물
- 원예작물
- 경작작물
- 국가별
- 프랑스
- 독일
- 이탈리아
- 네덜란드
- 러시아
- 스페인
- 튀르키예
- 영국
- 기타 유럽
제6장 경쟁 구도
- 주요 전략 동향
- 시장 점유율 분석
- 기업 상황
- 기업 프로파일
- Andermatt Group AG
- Biobest Group NV
- Bioline AgroSciences Ltd
- Bioplanet France
- Dragonfli
- E-NEMA GmbH
- If Tech
- Koppert Biological Systems Inc.
- OpenNatur
- VIRIDAXIS SA
제7장 CEO에 대한 주요 전략적 질문
제8장 부록
- 세계 개요
- 개요
- Porter's Five Forces 분석 프레임워크
- 세계의 밸류체인 분석
- 시장 역학(DROs)
- 정보원 및 참고문헌
- 도표 일람
- 주요 인사이트
- 데이터 팩
- 용어집
The Europe Biocontrol Agents Market size is estimated at 585.8 million USD in 2025, and is expected to reach 880 million USD by 2030, growing at a CAGR of 8.48% during the forecast period (2025-2030).
- Macrobial biocontrol agents dominate the market, with a value of about USD 458.8 million in 2022. Their dominance is mainly due to their ability to effectively control a wide range of pests without causing harm to the environment.
- Among macrobial biocontrol agents, predators dominate the market and are valued at USD 399.9 million in 2022. The predators' segment's dominance in the overall biocontrol agents market is due to their ability to attack different life stages of pests and even different pest species. They are voracious feeders compared to other biocontrol agents.
- Row crops dominate the macrobial biocontrol agents market, mainly due to their large cultivation area in the region. The consumption value of macrobial biocontrol agents in row crops is anticipated to reach USD 695.3 million by 2029.
- The market share of microbial biocontrol agents is limited compared to macrobial biocontrol agents due to various factors such as limited availability, less awareness about the utilization mechanism among farmers, and complex registration and commercialization processes.
- Bacterial biocontrol agents dominated the microbial market and accounted for about 89.0% of its value in 2022. Bacterial biocontrol agents are mainly dominant due to their ability to control various diseases and pests.
- However, integrated pest management programs promote the use of macrobial biocontrol agents such as predators and parasitoids. The European Commission promotes integrated pest management tools that can assist farmers and advisors, which may drive the macrobial biocontrol agents market value between 2023 and 2029.
- Microorganisms have become an increasingly popular alternative to chemical plant protection products, providing farmers with effective tools to control pests and diseases in their crops while reducing the environmental impact. The European biocontrol agents market witnessed steady growth in 2022 as four legal acts were endorsed by the Member States of the European Commission that simplify the approval and authorization process of microorganism-containing biological plant protection products. The objective is to provide farmers with effective tools to substitute chemical plant protection products and deliver on the objectives of the Farm-to-Fork Strategy.
- Russia currently occupies the largest share in the European biocontrol agents market, with a value share of 55.5% and a volume share of 21.2% in 2022. The increasing cultivation of horticultural crops and the discovery of new pests attacking crops are expected to drive further growth in the Russian market, with a projected CAGR of 8.3% between 2023 and 2029.
- Organic farming is a key industry of the EU agricultural sector, with nearly 330,000 organic farmers in the European Union in 2019, representing up to 20% of the farming area in the Member States. One of the targets of the Farm-to-Fork Strategy is to increase the total farmland under organic farming in the European Union, with plans for at least 25% of the EU's agricultural land to be under organic farming by 2030.
- The new regulations are expected to make it easier for EU organic farmers to access microorganisms used in biological plant protection products. This will provide them with new sustainable alternatives for controlling plant pests, contributing to a more environmentally friendly and sustainable approach to farming.
Europe Biocontrol Agents Market Trends
European green deal is majorly contributing for increasing organic cultivation across the region
- European countries are increasingly promoting organic farming, and the amount of land categorized as organic has significantly increased over the last 10 years. In March 2021, the European Commission launched an organic action plan to achieve the European Green Deal target of ensuring that 25% of agricultural land is under organic farming by 2030. Austria, Italy, Spain, and Germany are among the leading countries for organic cultivation in the European region. Italy has 15.0% of its agricultural area under organic farming, which is higher than the EU average of 7.5%.
- In 2021, organic land in the European Union was recorded at 14.7 million hectares. The agricultural production area is divided into three main types of use: arable land crops (mainly cereals, root crops, and fresh vegetables), permanent grassland, and permanent crops. The area of organic arable land was 6.5 million hectares in 2021, the equivalent of 46% of the European Union's total organic agricultural area.
- The organic cultivation area of cereals, oilseeds, protein crops, and pulses in the European Union increased by 32.6% between 2017 and 2021, amounting to more than 1.6 million hectares. With 1.3 million hectares in production, perennial crops accounted for 15% of the organic land in 2020. Olives, grapes, almonds, and citrus fruits are a few examples of crops in this group. Spain, Italy, and Greece are significant growers of organic olive trees, with 197,000, 179,000, and 47,000 hectares, respectively, in recent years. Both olives and grapes are crucial for the European agricultural industry because they can be turned into specialty products that are in demand locally and globally. The increasing organic acreage in the region is expected to strengthen the organic agricultural industry in Europe.
Growing demand and rising the per capita spending on organic products in the region
- European consumers are increasingly purchasing goods made using natural materials and methods. Even though organic food still only makes up a fraction of the European Union's overall agricultural production, it is no longer a niche industry. The European Union represents the second-largest single market for organic goods internationally, with an average per capita spending of USD 74.8 annually. The per capita spending on organic food in Europe has doubled in the last decade. In 2020, Swiss and Danish consumers spent the most on organic food (USD 494.09 and USD 453.90 per capita, respectively).
- Germany is the largest organic food market in Europe and the second largest market in the world after the United States, with a market size of USD 6.3 billion in 2021 and a per capita consumption of USD 75.6, as per Global Organic Trade data. The country accounted for 10.0% of the global organic food demand and is estimated to record a CAGR of 2.7% between 2021 and 2026.
- The organic food market in France witnessed strong growth, with a 12.6% rise in retail sales in 2021. The country's per capita spending on organic food was recorded at USD 88.8 in 2021, as per Global Organic Trade data. In 2018, as recorded by the Agence BIO/Spirit Insight Barometer, 88% of French people declared having consumed organic products. The preservation of health, environment, and animal welfare are the primary justifications for consuming organic foods in France. The organic market has begun to grow in several other nations, including Spain, the Netherlands, and Sweden, with the opening of organic stores. Organic food sales grew during and post the COVID-19 pandemic as consumers began paying more attention to health issues and learned the adverse effects of conventionally grown food.
Europe Biocontrol Agents Industry Overview
The Europe Biocontrol Agents Market is fragmented, with the top five companies occupying 27.60%. The major players in this market are Biobest Group NV, Bioline AgroSciences Ltd, Bioplanet France, E-NEMA GmbH and Koppert Biological Systems Inc. (sorted alphabetically).
Additional Benefits:
- The market estimate (ME) sheet in Excel format
- 3 months of analyst support
TABLE OF CONTENTS
1 EXECUTIVE SUMMARY & KEY FINDINGS
2 REPORT OFFERS
3 INTRODUCTION
- 3.1 Study Assumptions & Market Definition
- 3.2 Scope of the Study
- 3.3 Research Methodology
4 KEY INDUSTRY TRENDS
- 4.1 Area Under Organic Cultivation
- 4.2 Per Capita Spending On Organic Products
- 4.3 Regulatory Framework
- 4.3.1 France
- 4.3.2 Germany
- 4.3.3 Italy
- 4.3.4 Netherlands
- 4.3.5 Russia
- 4.3.6 Spain
- 4.3.7 Turkey
- 4.3.8 United Kingdom
- 4.4 Value Chain & Distribution Channel Analysis
5 MARKET SEGMENTATION (includes market size in Value in USD and Volume, Forecasts up to 2030 and analysis of growth prospects)
- 5.1 Form
- 5.1.1 Macrobials
- 5.1.1.1 By Organism
- 5.1.1.1.1 Entamopathogenic Nematodes
- 5.1.1.1.2 Parasitoids
- 5.1.1.1.3 Predators
- 5.1.2 Microbials
- 5.1.2.1 By Organism
- 5.1.2.1.1 Bacterial Biocontrol Agents
- 5.1.2.1.2 Fungal Biocontrol Agents
- 5.1.2.1.3 Other Microbials
- 5.1.1 Macrobials
- 5.2 Crop Type
- 5.2.1 Cash Crops
- 5.2.2 Horticultural Crops
- 5.2.3 Row Crops
- 5.3 Country
- 5.3.1 France
- 5.3.2 Germany
- 5.3.3 Italy
- 5.3.4 Netherlands
- 5.3.5 Russia
- 5.3.6 Spain
- 5.3.7 Turkey
- 5.3.8 United Kingdom
- 5.3.9 Rest of Europe
6 COMPETITIVE LANDSCAPE
- 6.1 Key Strategic Moves
- 6.2 Market Share Analysis
- 6.3 Company Landscape
- 6.4 Company Profiles (includes Global Level Overview, Market Level Overview, Core Business Segments, Financials, Headcount, Key Information, Market Rank, Market Share, Products and Services, and Analysis of Recent Developments).
- 6.4.1 Andermatt Group AG
- 6.4.2 Biobest Group NV
- 6.4.3 Bioline AgroSciences Ltd
- 6.4.4 Bioplanet France
- 6.4.5 Dragonfli
- 6.4.6 E-NEMA GmbH
- 6.4.7 If Tech
- 6.4.8 Koppert Biological Systems Inc.
- 6.4.9 OpenNatur
- 6.4.10 VIRIDAXIS SA
7 KEY STRATEGIC QUESTIONS FOR AGRICULTURAL BIOLOGICALS CEOS
8 APPENDIX
- 8.1 Global Overview
- 8.1.1 Overview
- 8.1.2 Porter's Five Forces Framework
- 8.1.3 Global Value Chain Analysis
- 8.1.4 Market Dynamics (DROs)
- 8.2 Sources & References
- 8.3 List of Tables & Figures
- 8.4 Primary Insights
- 8.5 Data Pack
- 8.6 Glossary of Terms
