|
시장보고서
상품코드
1693760
유럽의 농업용 생물제제 시장 : 시장 점유율 분석, 산업 동향 및 통계, 성장 예측(2025-2030년)Europe Agricultural Biologicals - Market Share Analysis, Industry Trends & Statistics, Growth Forecasts (2025 - 2030) |
||||||
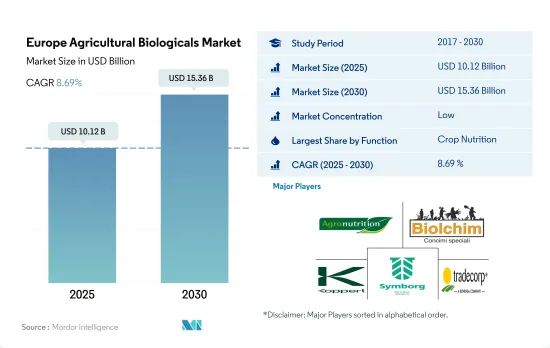
유럽의 농업용 생물제제 시장 규모는 2025년에 101억 2,000만 달러로 추정되고, 2030년에는 153억 6,000만 달러에 이를 전망이며, 예측 기간(2025-2030년) 중 CAGR 8.69%를 보일 것으로 예측됩니다.

- 과도한 비료와 농약의 사용이 생태계에 미치는 악영향은 몇 가지 있습니다. 영양제 살포는 대기오염을 일으키고, 아산화질소 배출은 기후변화의 원인이 되어 수성에 침출됩니다. 합성 비료 제조는 EU의 농업 배출량의 40% 이상을 차지하고 있습니다.
- 유기농업은 비농업적인 투입물의 사용과 의존을 크게 줄인 농업 시스템의 개발을 목표로 하고 있습니다. 따라서 Farm to Fork 전략과 생물 다양성 전략의 목표 달성은 유기농업에 크게 의존하고 있습니다. 2030년까지 이러한 목표는 토양 비옥도를 저하시키지 않으면서 비료 소비량을 최소 20% 절감하고 양분 손실을 최소 50% 절감하는 것을 목표로 하고 있습니다.
- 작물 영양 부문에서는 프랑스가 14.4%의 최대 점유율을 차지하고 2022년에는 8억 4,790만 달러가 되었습니다. 프랑스는 지난 6년간 연작 작물 전용 면적이 150% 증가한 30만 8,42 0헥타르와 가장 크게 성장했기 때문에 2021년에 제1위에 부상했습니다. 이러한 성장 요인은 바이오 비료 및 바이오스티뮬란트와 같은 작물 영양 제품의 수요 증가로 이어질 것으로 예상됩니다.
- 작물보호 부문에서는 이탈리아가 17.3%의 3위 점유율을 차지했으며, 2022년에는 3억 6,450만 달러에 달했습니다. 바이오 농약은 86.0%로 높은 점유율을 차지했고, 2022년 시장 규모는 약 3억 1,350만 달러, 그 다음은 바이오 방제제가 약 5,100만 달러였습니다.
- 합성비료의 유해한 영향에 대한 소비자의 의식이 높아짐에 따라 국제적 및 국내적으로 유기농산물에 대한 수요가 높아지고 있습니다. 이 때문에 이 지역에서는 2023-2029년 시장의 성장이 전망되고 있습니다.
- 유럽은 세계 최대의 유기농 작물 생산지의 하나이며, 유럽 국가에서는 유기 제품의 소비량이 많습니다. 독일과 프랑스는 이 지역의 주요 유기 작물 생산국 중 하나이며, 유기 제품의 소비 시장이 가장 높습니다.
- 유기농업은 유럽의 농업의 주요 부문입니다. 2019년 유럽의 유기농업 종사자 수는 약 33만 호로, 가맹국의 경작면적 점유율은 최대 20%에 달하고 있습니다. 또한 'Farm to Fork 전략'의 목표 중 하나는 유럽 내 유기농업의 농지 총 면적을 확대하는 것이며, 2030년까지 EU 농지의 최소 25%를 유기농업으로 만드는 것입니다. 이러한 대처가, 2023-2029년 농업용 생물제제 시장을 견인할 가능성이 있습니다.
- 이 지역의 전체적인 유기 재배 면적은 2017년 490만 헥타르에서 2022년에는 690만 헥타르로 증가했습니다. 이처럼 전체 유기작물의 작부면적이 증가 추세에 따라 이 지역 생물제제 시장도 2017-2022년 약 22.9% 증가했습니다. 2023-2029년에는 약 63.4% 증가하여 2029년 말에는 141억 2,000만 달러에 이를 것으로 예측되고 있습니다.
- 개별 국가로는 독일이 유기농 제품 세계 시장에 크게 공헌하고 있으며, 유기농 제품 수요는 2021년에는 63억 달러에 이르렀으며, 세계 총 수요의 약 10.0%를 차지하고 있습니다. 독일은 유럽의 농업용 생물제제 시장을 독점하고 있으며, 2022년 시장금액의 8.0%를 차지했습니다.
- 유럽위원회는 농업에 있어서의 화학제품의 투입을 전체적으로 감소시키는 계획이나 프로젝트를 실시하고 있어 유기농 작물의 작부 면적 증가나 유기 제품에 대한 수요 증가가 2023-2029년 시장을 견인할 것으로 예측됩니다.
유럽의 농업용 생물제제 시장 동향
유럽의 그린딜이 지역 전체의 유기 재배 확대에 크게 기여
- 유럽 국가들은 유기농업을 점점 추진하고 있으며, 유기 재배로 분류되는 토지의 양은 지난 10년간 크게 증가하고 있습니다. 2021년 3월 유럽위원회는 2030년까지 농지의 25%를 유기농업으로 만들겠다는 유럽 그린딜 목표를 달성하기 위해 유기행동계획을 수립했습니다. 오스트리아, 이탈리아, 스페인, 독일은 유럽의 유기농 주요 국가 중 하나입니다. 이탈리아는 농지 면적의 15.0%를 유기농으로 재배하고 있으며 EU 평균인 7.5%를 웃돌고 있습니다.
- 2021년에는 EU의 유기 재배지가 1,470만 헥타르로 기록되었습니다. 농업 생산 면적은, 경지 작물(주로 곡물, 근채류, 신선 야채), 영속적 초지, 영속적 작물의 3개의 주요한 이용 유형으로 나눌 수 있습니다. 2021년 유기경지 면적은 650만 헥타르로 EU 전체 유기농업 면적의 46%에 해당합니다.
- EU의 곡물, 지방종자, 단백질 작물, 콩류의 유기 재배 면적은 2017-2021년 사이에 32.6% 증가하여 160만 헥타르를 초과했습니다. 130만 헥타르에서 생산되는 다년생 작물은 2020년에는 유기농 재배지의 15%를 차지했습니다. 올리브, 포도, 아몬드, 감귤류는 이 그룹에 속하는 작물의 몇 가지 예입니다. 스페인, 이탈리아, 그리스는 유기농 올리브의 중요한 재배국이며, 최근에는 각각 19만 7,000헥타르, 17만 9,000헥타르, 4만 7,000헥타르입니다. 올리브도 포도도 국내외에 수요가 있는 특산품으로 가공할 수 있기 때문에 유럽의 농업에 있어서 매우 중요합니다. 이 지역의 유기농 면적 증가는 유럽의 유기농 산업을 강화할 것으로 예상됩니다.
이 지역의 유기 제품에 대한 수요 증가와 1인당 지출 증가
- 유럽의 소비자는 자연재료나 자연제법으로 만들어진 상품을 점점 구입하게 되고 있습니다. 유기 식품이 유럽 연합 전체의 농업 생산에 차지하는 비율은 아직 미미하지만, 더 이상 틈새 산업이 아닙니다. 유럽연합은 유기농 상품의 단일 시장으로는 국제적으로 두 번째로 크고, 1인당 연간 평균 지출액은 74.8달러입니다. 유럽의 유기농 식품에 대한 1인당 지출은 지난 10년간 두 배로 증가했습니다. 2020년에는 스위스와 덴마크의 소비자가 유기농 식품에 가장 많이 지출했습니다(각각 1인당 494.09달러와 453.90달러).
- 세계의 유기 무역 데이터에 따르면 독일은 유럽 최대의 유기농 식품 시장으로 미국에 이어 세계 2위 시장 규모를 자랑하며 2021년 시장 규모는 63억 달러, 1인당 소비액은 75.6달러였습니다. 이 나라는 세계 유기농 식품 수요의 10.0%를 차지하고 2021-2026년 2.7%의 CAGR로 추이할 것으로 추정됩니다.
- 프랑스의 유기농 식품 시장은 강력한 성장을 보였으며, 2021년 소매 매출은 12.6% 증가했습니다. 세계 유기농 무역 데이터에 따르면, 이 나라의 유기농 식품에 대한 1인당 지출액은 2021년에 88.8달러를 기록했습니다. 2018년 Agence BIO/Spirit Insight Barometer가 기록한 바와 같이 프랑스인의 88%가 유기농 제품을 소비한 적이 있다고 선언했습니다. 건강, 환경, 동물 복지의 보호가 프랑스에서 유기농 식품을 소비하는 주요 이유입니다. 유기농 시장은 스페인, 네덜란드, 스웨덴을 포함한 다른 몇몇 국가에서도 유기농 스토어의 개점과 함께 성장하기 시작하고 있습니다. 유기농 식품 매출은 코로나19 대유행 중과 그 이후로 늘었다. 소비자들이 건강 문제에 관심을 갖기 시작하면서 기존 방법으로 재배된 식품의 악영향을 알게 되었기 때문입니다.
유럽의 농업용 생물제제 산업 개요
유럽의 농업용 생물제제 시장은 세분화되어 있으며 상위 5개 기업에서 2.19%를 차지하고 있습니다. 이 시장의 주요 기업은 Agronutrition, Biolchim SpA, Koppert Biological Systems Inc., Symborg Inc., Trade Corporation International 등입니다.
기타 혜택
- 엑셀 형식 시장 예측(ME) 시트
- 3개월의 애널리스트 서포트
목차
제1장 주요 요약 및 주요 조사 결과
제2장 보고서 제안
제3장 서문
- 조사의 전제조건 및 시장 정의
- 조사 범위
- 조사 방법
제4장 주요 산업 동향
- 유기 재배 면적
- 1인당 유기농 제품에 지출
- 규제 프레임워크
- 프랑스
- 독일
- 이탈리아
- 네덜란드
- 러시아
- 스페인
- 튀르키예
- 영국
- 밸류체인 및 유통 채널 분석
제5장 시장 세분화
- 기능별
- 작물 영양
- 바이오 비료
- 아조스피리람
- 아조토박터
- 균근균
- 인산 가용화균
- 근립균
- 기타 바이오 비료
- 바이오 비료
- 아미노산
- 풀보산
- 부식산
- 단백질 가수분해물
- 해초 추출물
- 기타 바이오스티뮬란트
- 유기 비료
- 비료
- 밀 기반 비료
- 오일 케이크
- 기타 유기 비료
- 작물 보호
- 생물 방제제
- 매크로 미생물
- 미생물
- 바이오 농약
- 바이오 살균제
- 바이오 제초제
- 생물 살충제
- 기타 바이오 농약
- 작물 영양
- 작물 유형별
- 환금작물
- 원예작물
- 경작작물
- 국가별
- 프랑스
- 독일
- 이탈리아
- 네덜란드
- 러시아
- 스페인
- 튀르키예
- 영국
- 기타 유럽
제6장 경쟁 구도
- 주요 전략 동향
- 시장 점유율 분석
- 기업 상황
- 기업 프로파일
- Agronutrition
- Andermatt Group AG
- Atlantica Agricola
- Biolchim SpA
- Bionema
- Koppert Biological Systems Inc.
- Lallemand Inc.
- Sustane Natural Fertilizer, Inc
- Symborg Inc.
- Trade Corporation International
제7장 CEO에 대한 주요 전략적 질문
제8장 부록
- 세계 개요
- 개요
- Porter's Five Forces 분석 프레임워크
- 세계의 밸류체인 분석
- 시장 역학(DROs)
- 정보원 및 참고문헌
- 도표 일람
- 주요 인사이트
- 데이터 팩
- 용어집
The Europe Agricultural Biologicals Market size is estimated at 10.12 billion USD in 2025, and is expected to reach 15.36 billion USD by 2030, growing at a CAGR of 8.69% during the forecast period (2025-2030).
- There are several adverse effects of excessive fertilizer and pesticide use on the ecosystem. Applying nutrients causes air pollution, while nitrous oxide emissions contribute to climate change and leach into water systems. The manufacturing of synthetic fertilizers is responsible for over 40% of the agricultural emissions in the European Union.
- Organic farming aims to develop agricultural systems that use and depend on non-farm inputs far less. Thus, accomplishing the goals of the Farm to Fork and Biodiversity strategies depends heavily on organic agriculture. By 2030, these goals seek to reduce fertilizer consumption by at least 20% and reduce nutrient losses by at least 50% while ensuring that soil fertility does not decline.
- In the crop nutrition segment, France occupies the largest share of 14.4%, valued at USD 847.9 million in 2022. France rose to first place in 2021 as the country experienced the strongest growth in areas dedicated to row crops in six years, amounting to 308,420 hectares, an increase of 150%. Such growth factors are expected to result in increased demand for crop nutrition products such as biofertilizers and biostimulants.
- In the crop protection segment, Italy occupied the third-largest share of 17.3%, valued at USD 364.5 million in 2022. Biopesticides occupied a higher share of 86.0%, valued at about USD 313.5 million in 2022 in the market, followed by biocontrol agents, valued at about USD 51.0 million in the same year.
- The increasing awareness among consumers regarding the harmful impact of synthetic fertilizers has increased the demand for organic produce at the international and domestic levels. Thus, the market is expected to experience growth in the region between 2023 and 2029.
- The European region is one of the world's largest organic crop producers, and organic product consumption is high in European countries. Germany and France are some of the major organic crop producers in the region, and they have the highest organic product consumption markets.
- Organic farming is a key sector of European agriculture. In 2019, there were almost 330,000 organic farmers in Europe, reaching up to 20% share of the farming area in the Member States. In addition, one of the targets of the Farm to Fork Strategy concerns the increase in the total farmland under organic farming in Europe, with at least 25% of the EU's agricultural land to be under organic farming by 2030. These initiatives may drive the agricultural biologicals market between 2023 and 2029.
- The overall organic area in the region increased from 4.9 million hectares in 2017 to 6.9 million hectares in 2022. With this increasing trend in overall organic crop area, the biologicals market in the region also increased by about 22.9% between 2017 and 2022. It is anticipated to increase by about 63.4% between 2023 and 2029 and reach USD 14.12 billion by the end of 2029.
- As an individual country, Germany significantly contributed to the global market for organic products, with demand for organic goods reaching USD 6.3 billion in 2021, or around 10.0% of the total global demand. Germany dominates the European agricultural biologicals market, and it accounted for 8.0% of the market value in 2022.
- The European Commission schemes or projects to decrease the overall chemical inputs in agriculture and the increase in the organic crop area and demand for organic products are anticipated to drive the market between 2023 and 2029.
Europe Agricultural Biologicals Market Trends
European green deal is majorly contributing for increasing organic cultivation across the region
- European countries are increasingly promoting organic farming, and the amount of land categorized as organic has significantly increased over the last 10 years. In March 2021, the European Commission launched an organic action plan to achieve the European Green Deal target of ensuring that 25% of agricultural land is under organic farming by 2030. Austria, Italy, Spain, and Germany are among the leading countries for organic cultivation in the European region. Italy has 15.0% of its agricultural area under organic farming, which is higher than the EU average of 7.5%.
- In 2021, organic land in the European Union was recorded at 14.7 million hectares. The agricultural production area is divided into three main types of use: arable land crops (mainly cereals, root crops, and fresh vegetables), permanent grassland, and permanent crops. The area of organic arable land was 6.5 million hectares in 2021, the equivalent of 46% of the European Union's total organic agricultural area.
- The organic cultivation area of cereals, oilseeds, protein crops, and pulses in the European Union increased by 32.6% between 2017 and 2021, amounting to more than 1.6 million hectares. With 1.3 million hectares in production, perennial crops accounted for 15% of the organic land in 2020. Olives, grapes, almonds, and citrus fruits are a few examples of crops in this group. Spain, Italy, and Greece are significant growers of organic olive trees, with 197,000, 179,000, and 47,000 hectares, respectively, in recent years. Both olives and grapes are crucial for the European agricultural industry because they can be turned into specialty products that are in demand locally and globally. The increasing organic acreage in the region is expected to strengthen the organic agricultural industry in Europe.
Growing demand and rising the per capita spending on organic products in the region
- European consumers are increasingly purchasing goods made using natural materials and methods. Even though organic food still only makes up a fraction of the European Union's overall agricultural production, it is no longer a niche industry. The European Union represents the second-largest single market for organic goods internationally, with an average per capita spending of USD 74.8 annually. The per capita spending on organic food in Europe has doubled in the last decade. In 2020, Swiss and Danish consumers spent the most on organic food (USD 494.09 and USD 453.90 per capita, respectively).
- Germany is the largest organic food market in Europe and the second largest market in the world after the United States, with a market size of USD 6.3 billion in 2021 and a per capita consumption of USD 75.6, as per Global Organic Trade data. The country accounted for 10.0% of the global organic food demand and is estimated to record a CAGR of 2.7% between 2021 and 2026.
- The organic food market in France witnessed strong growth, with a 12.6% rise in retail sales in 2021. The country's per capita spending on organic food was recorded at USD 88.8 in 2021, as per Global Organic Trade data. In 2018, as recorded by the Agence BIO/Spirit Insight Barometer, 88% of French people declared having consumed organic products. The preservation of health, environment, and animal welfare are the primary justifications for consuming organic foods in France. The organic market has begun to grow in several other nations, including Spain, the Netherlands, and Sweden, with the opening of organic stores. Organic food sales grew during and post the COVID-19 pandemic as consumers began paying more attention to health issues and learned the adverse effects of conventionally grown food.
Europe Agricultural Biologicals Industry Overview
The Europe Agricultural Biologicals Market is fragmented, with the top five companies occupying 2.19%. The major players in this market are Agronutrition, Biolchim SpA, Koppert Biological Systems Inc., Symborg Inc. and Trade Corporation International (sorted alphabetically).
Additional Benefits:
- The market estimate (ME) sheet in Excel format
- 3 months of analyst support
TABLE OF CONTENTS
1 EXECUTIVE SUMMARY & KEY FINDINGS
2 REPORT OFFERS
3 INTRODUCTION
- 3.1 Study Assumptions & Market Definition
- 3.2 Scope of the Study
- 3.3 Research Methodology
4 KEY INDUSTRY TRENDS
- 4.1 Area Under Organic Cultivation
- 4.2 Per Capita Spending On Organic Products
- 4.3 Regulatory Framework
- 4.3.1 France
- 4.3.2 Germany
- 4.3.3 Italy
- 4.3.4 Netherlands
- 4.3.5 Russia
- 4.3.6 Spain
- 4.3.7 Turkey
- 4.3.8 United Kingdom
- 4.4 Value Chain & Distribution Channel Analysis
5 MARKET SEGMENTATION (includes market size in Value in USD and Volume, Forecasts up to 2030 and analysis of growth prospects)
- 5.1 Function
- 5.1.1 Crop Nutrition
- 5.1.1.1 Biofertilizer
- 5.1.1.1.1 Azospirillum
- 5.1.1.1.2 Azotobacter
- 5.1.1.1.3 Mycorrhiza
- 5.1.1.1.4 Phosphate Solubilizing Bacteria
- 5.1.1.1.5 Rhizobium
- 5.1.1.1.6 Other Biofertilizers
- 5.1.1.2 Biostimulants
- 5.1.1.2.1 Amino Acids
- 5.1.1.2.2 Fulvic Acid
- 5.1.1.2.3 Humic Acid
- 5.1.1.2.4 Protein Hydrolysates
- 5.1.1.2.5 Seaweed Extracts
- 5.1.1.2.6 Other Biostimulants
- 5.1.1.3 Organic Fertilizer
- 5.1.1.3.1 Manure
- 5.1.1.3.2 Meal Based Fertilizers
- 5.1.1.3.3 Oilcakes
- 5.1.1.3.4 Other Organic Fertilizers
- 5.1.2 Crop Protection
- 5.1.2.1 Biocontrol Agents
- 5.1.2.1.1 Macrobials
- 5.1.2.1.2 Microbials
- 5.1.2.2 Biopesticides
- 5.1.2.2.1 Biofungicides
- 5.1.2.2.2 Bioherbicides
- 5.1.2.2.3 Bioinsecticides
- 5.1.2.2.4 Other Biopesticides
- 5.1.1 Crop Nutrition
- 5.2 Crop Type
- 5.2.1 Cash Crops
- 5.2.2 Horticultural Crops
- 5.2.3 Row Crops
- 5.3 Country
- 5.3.1 France
- 5.3.2 Germany
- 5.3.3 Italy
- 5.3.4 Netherlands
- 5.3.5 Russia
- 5.3.6 Spain
- 5.3.7 Turkey
- 5.3.8 United Kingdom
- 5.3.9 Rest of Europe
6 COMPETITIVE LANDSCAPE
- 6.1 Key Strategic Moves
- 6.2 Market Share Analysis
- 6.3 Company Landscape
- 6.4 Company Profiles (includes Global Level Overview, Market Level Overview, Core Business Segments, Financials, Headcount, Key Information, Market Rank, Market Share, Products and Services, and Analysis of Recent Developments).
- 6.4.1 Agronutrition
- 6.4.2 Andermatt Group AG
- 6.4.3 Atlantica Agricola
- 6.4.4 Biolchim SpA
- 6.4.5 Bionema
- 6.4.6 Koppert Biological Systems Inc.
- 6.4.7 Lallemand Inc.
- 6.4.8 Sustane Natural Fertilizer, Inc
- 6.4.9 Symborg Inc.
- 6.4.10 Trade Corporation International
7 KEY STRATEGIC QUESTIONS FOR AGRICULTURAL BIOLOGICALS CEOS
8 APPENDIX
- 8.1 Global Overview
- 8.1.1 Overview
- 8.1.2 Porter's Five Forces Framework
- 8.1.3 Global Value Chain Analysis
- 8.1.4 Market Dynamics (DROs)
- 8.2 Sources & References
- 8.3 List of Tables & Figures
- 8.4 Primary Insights
- 8.5 Data Pack
- 8.6 Glossary of Terms