


|
시장보고서
상품코드
1693768
아시아태평양의 바이오 농약 시장 : 시장 점유율 분석, 산업 동향 및 통계, 성장 예측(2025-2030년)Asia-Pacific Biopesticides - Market Share Analysis, Industry Trends & Statistics, Growth Forecasts (2025 - 2030) |
||||||
■ 보고서에 따라 최신 정보로 업데이트하여 보내드립니다. 배송일정은 문의해 주시기 바랍니다.
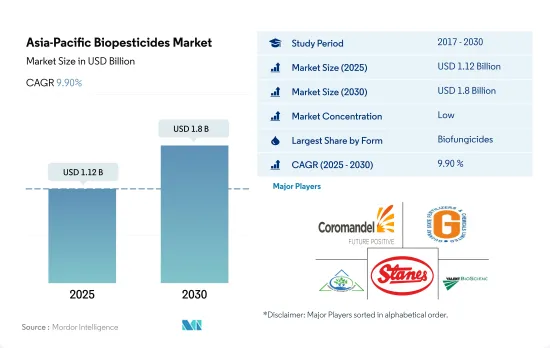
아시아태평양의 바이오 농약 시장 규모는 2025년에 11억 2,000만 달러에 이르고, 2030년에는 18억 달러에 달하며, 예측 기간 중(2025-2030년) CAGR 9.90%를 나타낼 것으로 예측됩니다.
- 바이오 농약은 동물, 식물, 곤충, 박테리아와 진균을 포함한 미생물 유래의 물질 또는 약제입니다. 이들은 농업 해충이나 감염증의 관리에 사용됩니다.
- 바이오 살균제는이 지역에서 가장 많이 사용되는 바이오 농약입니다. 2022년시장 점유율은 36.8%였습니다. 이 생물 살균제는 Pythium, Rhizoctonia, Fusarium, Sclerotinia, Thielaviopsis, Botrytis, 우동병 등의 병원균에 효과적으로 작용합니다.
- 바이오 살충제 중에서도 세균 살충제인 바실러스 튜링겐시스는 포자 형성기에 단백질을 생산함으로써 해충을 구제할 수 있기 때문에 농업에서 가장 많이 사용되고 있습니다.
- 슈도모나스 플루오레센스(Pseudomonas fluorescens)와 크산토모나스 캄페스트리스(Xanthomonas campestris)는 각각 곰팡이와 박테리아로, 이 지역에서는 바이오 제초제로서 상업적으로 중요성을 늘리고 있습니다.
- 농업에 있어서의 생물적 스트레스를 관리하는 서스테이너블 어프로치의 필요성이, 이 지역에 있어서의 바이오 농약 사용의 잠재적인 추진력이 되고 있습니다.
- 아시아태평양에서는 중국과 인도와 같은 국가가 시장을 선도하고 있으며, 지속 가능한 농업으로의 전환이 현저합니다.
- 토양오염, 공해, 식품중의 잔류화학제품에 대한 우려가 높아짐에 따라 중국 정부는 유기투입물의 사용을 촉진하는 적극적인 대책을 강구하고 있습니다. 농장 내 인프라와 유기 비료에 대한 자금 제공, 연수, 마케팅 지원, 토지 취득 지원 등이 포함됩니다.
- 그러나 인도의 유기 재배 농업 종사자 수는 세계 제일이며, 유기 농지 면적은 세계 제5위입니다.
- 바이오 농약 시장의 주요 촉진요인 중 하나는 L. rigidum, R. raphanustrum, Bromus spp., Hordeum spp.등의 제초제 내성 잡초의 개발입니다.이 잡초는 ACCase 저해나 ALS 저해에 의해 잡초를 시들는 종래의 화학 제초제에 대한 내성을 발달시키고 있어 방제를 곤란하게 하고 있다 이것은 농업 종사자가 바이오 제초제와 같은 다른 대안을 채택 할 수있는 기회를 제공하고 아시아태평양의 바이오 농약 시장을 견인하고 있습니다. 9.8%를 나타낼 것으로 추정됩니다.
아시아태평양의 바이오 농약 시장 동향
중국, 인도, 인도네시아, 호주 등 국가의 정부 지원 확대가 이 지역의 유기농업을 뒷받침
- FiBL의 통계에 따르면, 아시아태평양의 유기농지면적은 2021년에는 370만 헥타르를 넘어 세계의 유기농지면적의 26.4%를 차지했습니다. 유기재배면적은 2017-2022년에 걸쳐 19.3% 증가했습니다. 인도가 130만 명으로 톱입니다. 중국, 인도, 인도네시아, 호주는 이 지역에서 유기 재배 면적이 큰 주요 국가입니다. Krishi Vikas Yojana나 All India Network Programme on Organic Farming(AI-NPOF)과 같은 제도를 실시했습니다.
- 2021년에는 중국이 250만 ha로 66.1%의 최대 점유율을 차지한 다음 인도가 19.3%, 인도네시아가 1.5%, 호주가 1.4%였습니다. 연작 작물은 이 지역의 유기농지의 67.5%, 즉 250만ha를 차지하고, 큰 점유율을 차지했습니다.
- 환금작물의 점유율은 2위로 2021년에는 70만ha가 되어 유기농지의 18.5%를 차지했습니다.
유기농 제품에 대한 1인당 지출은 호주가 압도적으로 많아 중국의 유기농 식품 시장이 크게 성장
- 이 지역의 유기농 제품에 대한 1인당 지출은 2021년에는 85.1달러를 기록했습니다. Global Organic Trade의 데이터에 따르면, 호주 유기농 포장 식품 시장은 2021년에는 8억 8,520만 달러에 달했습니다.
- 중국의 유기농 식품 시장은 2021년에 13.3% 성장했으며, 이 플러스 성장 패턴은 계속될 것으로 예상되며, 2023-2029년의 CAGR은 7.1%를 나타낼 것으로 전망됩니다. 게다가, 취업하는 어머니의 수 증가나 건강과 웰니스의 동향의 채용 증가에 의해 오가닉 베이비 푸드 수요가 증가하고 있기 때문에 오가닉 제품은 2025년까지 64억 달러의 규모에 이를 것으로 예측됩니다.
- 인도의 유기농 제품은 세계 수요의 1.0%에 멀리 미치지 못하고, 2021년 1인당 지출액은 불과 0.08달러였습니다. 소비자의 지식과 구매 의욕의 높아짐은 동지역에 있어서의 유기 식품의 지속가능성의 특질에 대한 이해를 깊게 하는 것으로 이어집니다.
아시아태평양의 바이오 농약 산업 개요
아시아태평양의 바이오 농약 시장은 세분화되어 있으며 상위 5개 회사에서 3.31%를 차지합니다. 이 시장의 주요 기업은 Coromandel International Ltd. 등이 있습니다.
기타 혜택
- 엑셀 형식 시장 예측(ME) 시트
- 3개월의 애널리스트 서포트
목차
제1장 주요 요약과 주요 조사 결과
제2장 보고서 제안
제3장 서론
- 조사의 전제조건과 시장 정의
- 조사 범위
- 조사 방법
제4장 주요 산업 동향
- 유기 재배 면적
- 1인당 유기농 제품에 대한 지출
- 규제 프레임워크
- 호주
- 중국
- 인도
- 인도네시아
- 일본
- 필리핀
- 태국
- 베트남
- 밸류체인과 유통채널 분석
제5장 시장 세분화
- 형태
- 바이오 살균제
- 바이오 제초제
- 바이오 살충제
- 기타 바이오 농약
- 작물 유형
- 환금작물
- 원예작물
- 경작작물
- 생산국
- 호주
- 중국
- 인도
- 인도네시아
- 일본
- 필리핀
- 태국
- 베트남
- 기타 아시아태평양
제6장 경쟁 구도
- 주요 전략 동향
- 시장 점유율 분석
- 기업 상황
- 기업 프로파일
- Andermatt Group AG
- Biobest Group NV
- Biolchim SPA
- Coromandel International Ltd
- Gujarat State Fertilizers & Chemicals Ltd
- Henan Jiyuan Baiyun Industry Co. Ltd
- IPL Biologicals Limited
- Koppert Biological Systems Inc.
- T.Stanes and Company Limited
- Valent Biosciences LLC
제7장 CEO에 대한 주요 전략적 질문
제8장 부록
- 세계 개요
- 개요
- Five Forces 분석 프레임워크
- 세계의 밸류체인 분석
- 시장 역학(DROs)
- 정보원과 참고문헌
- 도표 일람
- 주요 인사이트
- 데이터 팩
- 용어집
The Asia-Pacific Biopesticides Market size is estimated at 1.12 billion USD in 2025, and is expected to reach 1.8 billion USD by 2030, growing at a CAGR of 9.90% during the forecast period (2025-2030).

- Biopesticides are naturally occurring substances or agents derived from animals, plants, insects, and microorganisms, including bacteria and fungi. They are used to manage agricultural pests and infections. The market for biopesticides in the Asia-Pacific region was valued at USD 854.2 million in 2022.
- Biofungicides are the most popular biopesticides used in the region. They held a market share of 36.8% in 2022. Bacillus, Trichoderma, Streptomyces, and Pseudomonas are the most commercially used species of microorganisms in agriculture. These biofungicides effectively act against pathogens, such as Pythium, Rhizoctonia, Fusarium, Sclerotinia, Thielaviopsis, Botrytis, and powdery mildew.
- Among bioinsecticides, the bacterial insecticide Bacillus thuringiensis is most predominantly used in agriculture due to its immense potential to control pests by producing proteins during the sporulation phase. Bacillus thuringiensis is effective in managing lepidopteran species that affect a wide range of crop types.
- Pseudomonas fluorescens and Xanthomonas campestris are fungi and bacteria, respectively, gaining commercial importance as bioherbicides in the region. The extracellular peptides and a lipopolysaccharide released from these organisms inhibit the growth of weeds. Xanthomonas campestris is known to control horseweed effectively.
- The need for sustainable approaches in managing biotic stresses in agriculture is the potential driver for biopesticide usage in the region.
- The Asia-Pacific region is witnessing a significant shift toward sustainable agriculture practices, with countries like China and India leading the market. China is currently the largest consumer of biopesticides in the region, and it accounted for a 29.1% share in 2022.
- In response to rising concerns over soil contamination, pollution, and chemical residues in food, the Chinese government is taking proactive measures to promote the usage of organic inputs. These initiatives include bearing the cost of organic certification, providing funding for on-farm infrastructure and organic fertilizers, training, marketing assistance, and assisting with land acquisition. Middle and higher-income families are driving this growing demand for organically-grown food.
- However, India has the world's highest number of organic growers, and it is the fifth-largest country in terms of organic agricultural land area. During 2021-2022, India produced over 3.4 million metric tons of certified organic products, including a wide range of food products. This high adoption of organic farming practices is expected to drive the biopesticides market in the region.
- One key driver of the biopesticides market is the development of herbicide-resistant weeds such as L. rigidum, R. raphanustrum, Bromus spp., and Hordeum spp. These weeds have developed resistance against traditional chemical herbicides that kill the weeds by ACCase- and ALS-inhibition, making control difficult. This presents an opportunity for farmers to adopt other alternatives like bioherbicides, thus driving the Asia-Pacific biopesticides market. The market is estimated to record a CAGR of 9.8% between 2023 and 2029.
Asia-Pacific Biopesticides Market Trends
Growing Government support in countries like China, India, Indonesia, and Australia, boosts organic farming in the region
- The organic agricultural area in the Asia-Pacific region was over 3.7 million hectares in 2021, representing 26.4% of the global organic area, as per FiBL statistics. The organic area under cultivation grew by 19.3% between 2017 and 2022. As of 2020, the region recorded around 1.8 million organic producers, with India topping the list with 1.3 million organic producers. China, India, Indonesia, and Australia are the major countries with large organic cultivation areas in the region. Government authorities in countries like China and India are constantly promoting organic agriculture to reduce reliance on chemical inputs for crop cultivation. For instance, India has implemented schemes like Paramparagat Krishi Vikas Yojana and the All India Network Programme on Organic Farming (AI-NPOF).
- In 2021, China accounted for a maximum share of 66.1%, with 2.5 million ha, followed by India, Indonesia, and Australia, with 19.3%, 1.5%, and 1.4%, respectively. The total organic land is divided into three crop types, namely row crops, horticultural crops, and cash crops. Row crops occupy a major share of organic agricultural land in the region, accounting for 67.5% share, i.e., 2.5 million ha in 2021. The major row crops grown in the region include paddy, wheat, pulses, soybeans, and millets.
- Cash crops held the second largest share, with 0.7 million ha in 2021, accounting for an 18.5% share of organic cropland. The demand for organic cash crops like sugar and organic tea is increasing worldwide. China and India are the largest organic green and black tea producers, respectively. The growing international demand is expected to increase the organic acreages in the region.
Per capita spending on organic product predominant in Australia and China's organic food market growing significantly
- The per capita spending on organic products in the region was recorded at USD 85.1 in 2021. Australia witnessed a higher per capita spending on organic products, with USD 58.3 in the same year, attributed to the higher demand due to consumers' perception of organic food as healthy. As per the Global Organic Trade data, Australia's organic packaged food and beverage market was valued at USD 885.2 million in 2021.
- China's organic food market grew by 13.3% in 2021, and the positive growth pattern is expected to continue, with an estimated CAGR of 7.1% between 2023 and 2029. With an increasing emphasis on the importance of organic products among the younger generation and a rise in demand for organic baby food due to the growing number of mothers in the workforce and the increasing adoption of the health and wellness trend, organic products are expected to reach a value of USD 6.4 billion by 2025.
- Organic products in India represent far less than 1.0% of global demand, with a per capita expenditure of just USD 0.08 in 2021. However, India represents a promising market over the coming years, reaching a value of USD 153.3 million by 2025. Currently, the market for organic goods in the region is very fragmented, with just a few supermarkets and specialty stores selling them, as only people from higher-income families are potential customers. Growing consumer knowledge and buying motivations will lead to a better understanding of the sustainability qualities of organic food in the region. Increasing per capita income, along with increased consumer awareness of the importance of organic food intake, has the potential to raise per capita expenditure on organic food items in the Asia-Pacific region.
Asia-Pacific Biopesticides Industry Overview
The Asia-Pacific Biopesticides Market is fragmented, with the top five companies occupying 3.31%. The major players in this market are Coromandel International Ltd, Gujarat State Fertilizers & Chemicals Ltd, IPL Biologicals Limited, T.Stanes and Company Limited and Valent Biosciences LLC (sorted alphabetically).
Additional Benefits:
- The market estimate (ME) sheet in Excel format
- 3 months of analyst support
TABLE OF CONTENTS
1 EXECUTIVE SUMMARY & KEY FINDINGS
2 REPORT OFFERS
3 INTRODUCTION
- 3.1 Study Assumptions & Market Definition
- 3.2 Scope of the Study
- 3.3 Research Methodology
4 KEY INDUSTRY TRENDS
- 4.1 Area Under Organic Cultivation
- 4.2 Per Capita Spending On Organic Products
- 4.3 Regulatory Framework
- 4.3.1 Australia
- 4.3.2 China
- 4.3.3 India
- 4.3.4 Indonesia
- 4.3.5 Japan
- 4.3.6 Philippines
- 4.3.7 Thailand
- 4.3.8 Vietnam
- 4.4 Value Chain & Distribution Channel Analysis
5 MARKET SEGMENTATION (includes market size in Value in USD and Volume, Forecasts up to 2030 and analysis of growth prospects)
- 5.1 Form
- 5.1.1 Biofungicides
- 5.1.2 Bioherbicides
- 5.1.3 Bioinsecticides
- 5.1.4 Other Biopesticides
- 5.2 Crop Type
- 5.2.1 Cash Crops
- 5.2.2 Horticultural Crops
- 5.2.3 Row Crops
- 5.3 Country
- 5.3.1 Australia
- 5.3.2 China
- 5.3.3 India
- 5.3.4 Indonesia
- 5.3.5 Japan
- 5.3.6 Philippines
- 5.3.7 Thailand
- 5.3.8 Vietnam
- 5.3.9 Rest of Asia-Pacific
6 COMPETITIVE LANDSCAPE
- 6.1 Key Strategic Moves
- 6.2 Market Share Analysis
- 6.3 Company Landscape
- 6.4 Company Profiles (includes Global Level Overview, Market Level Overview, Core Business Segments, Financials, Headcount, Key Information, Market Rank, Market Share, Products and Services, and Analysis of Recent Developments).
- 6.4.1 Andermatt Group AG
- 6.4.2 Biobest Group NV
- 6.4.3 Biolchim SPA
- 6.4.4 Coromandel International Ltd
- 6.4.5 Gujarat State Fertilizers & Chemicals Ltd
- 6.4.6 Henan Jiyuan Baiyun Industry Co. Ltd
- 6.4.7 IPL Biologicals Limited
- 6.4.8 Koppert Biological Systems Inc.
- 6.4.9 T.Stanes and Company Limited
- 6.4.10 Valent Biosciences LLC
7 KEY STRATEGIC QUESTIONS FOR AGRICULTURAL BIOLOGICALS CEOS
8 APPENDIX
- 8.1 Global Overview
- 8.1.1 Overview
- 8.1.2 Porter's Five Forces Framework
- 8.1.3 Global Value Chain Analysis
- 8.1.4 Market Dynamics (DROs)
- 8.2 Sources & References
- 8.3 List of Tables & Figures
- 8.4 Primary Insights
- 8.5 Data Pack
- 8.6 Glossary of Terms


샘플 요청 목록