
|
시장보고서
상품코드
1693801
남미의 데이터센터 시장 : 시장 점유율 분석, 산업 동향 및 통계, 성장 예측(2025-2030년)South America Data Center - Market Share Analysis, Industry Trends & Statistics, Growth Forecasts (2025 - 2030) |
||||||
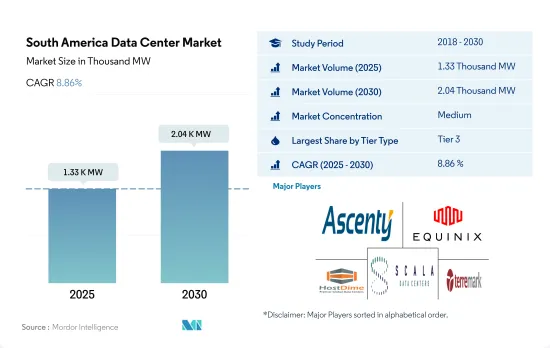
남미의 데이터센터 시장 규모는 2025년에 1,330MW에 달할 것으로 추정되고, 2030년에는 2,040MW에 이르며 CAGR 8.86%를 나타낼 것으로 예측됩니다.
또한 2025년 코로케이션 수익은 50억 910만 달러, 2030년에는 85억 2,470만 달러에 이를 것으로 예상되며, 예측 기간(2025-2030년)의 CAGR은 11.22%를 나타낼 것으로 전망됩니다.

2023년 시장 점유율은 Tier 3 데이터센터가 대부분을 차지했지만 예측 기간 동안 Tier 4가 급성장
- 남미 시장에서는 현재 Tier 3 부문이 그 특징의 큰 이점에서 대부분의 점유율을 차지하고 있습니다.
- 브라질은 이 지역에서 가장 많은 Tier 3 데이터센터를 보유하고 있습니다. 2022년에는 브라질의 58개 데이터센터가 Tier 3 인증을 받았습니다. 2022년에는 상파울루가 77.9%, 리오데자네이루가 27.2%로 국내에서 가장 많은 Tier 3 데이터센터를 호스팅했습니다. 다른 핫스팟(세아라, 카스카벨, 쿠리치바, 리베이라오 플렛 등)의 점유율은 14.8%였습니다. Tier 3 부문은 2023년 649MW에서 2029년 987.67MW로 성장하며 CAGR은 7.25%를 나타낼 것으로 예측됩니다.
- Tier 4 부문은 예측 기간 동안 20.94%의 최고 CAGR을 나타낼 것으로 예측됩니다. 브라질과 같은 다양한 선진국들은 모든 구성 요소에 대해 완전한 내결함성과 중복성을 갖춘 Tier 4 인증 채택에 주력하고 있습니다. 이것이 개발 지역에서도 Tier 4 유형을 채용하는 주요 이유입니다. 이 시장의 주요 기업은 예측 기간 동안 17개 시설을 가진 Scala Data Centers(366MW)와 1개 시설을 가진 ODATA(24MW) 등의 시설을 확대할 전망입니다.
- Tier 1&2 부문은 GDP 성장률이 낮고 비용 부담이 큰 저개발국의 개발도상국에서 큰 성장이 예상됩니다. 이들 국가에는 볼리비아, 파라과이, 수리남, 에콰도르 등이 포함되어 있으며, Tier 3 및 Tier 4 시설을 구입할 여유가 없는 중소기업이 대부분을 차지하고 있습니다.
브라질이 주요 점유율을 차지하고 조사 기간 동안에도 우위가 지속될 전망
- 남미의 데이터센터 시장에서 브라질과 칠레가 가장 큰 점유율을 차지하고 있습니다. Telecom, Ava Telecom, Embratel 등의 통신사업자의 투자로 인해 2021년의 가치에서 투자의 절대액이 40% 증가했습니다.
- 칠레는 경쟁 에너지 가격을 가지고 있지만, 이는 주로 향후 몇 년간 자연 재생 가능 에너지 발전의 가능성을 활용할 계획에 의한 것입니다. 리는 전통적으로 이 지역에서 가장 뛰어난 통신 인프라를 가지고 있으며, 이중화된 파이버 백본을 확보하기 위해 2개의 대규모 파이버 프로젝트가 진행 중입니다. Optica Austral(FOA) 해저 케이블이 포함되어 있습니다.
- 아르헨티나에서는 부에노스아이레스가 주요 투자처이며, 동시의 식별된 타사 시설이 기존 전력 용량의 90% 이상에 기여하고 있습니다. 아르헨티나에서는 2020년에 재생 가능 에너지가 전력 용량 전체의 약 33%에 공헌해, 2025년까지 재생 가능 에너지에 의한 발전을 20%로 하는 것을 목표로 하고 있습니다.
남미의 데이터센터 시장 동향
다양한 기업에 의한 인터넷 및 스마트폰 기술의 높은 도입률과 지역 전체에서의 디지털 이용 확대가 시장 수요를 견인
- 2020년 모바일 기술과 서비스는 라틴아메리카 GDP의 7.1%를 차지했으며, 그 기여는 3,400억 달러 이상의 경제 부가가치에 이르렀습니다. 라틴아메리카 모바일 에코시스템의 경제 공헌은 300억 달러 이상으로 확대될 것으로 예상되며, 이는 이 지역의 국가들이 모바일 서비스의 이용 확대에 의해 초래되는 생산성과 효율의 개선으로부터 점점 혜택을 받게 되기 때문입니다.
- 브라질에서는 디지털 이용이 급속히 확대되고 있습니다. 다양한 기업에 의한 인터넷이나 스마트폰의 보급이, 소비자의 행동에 영향을 주고 있습니다. 폰 이용자 증가로 이어졌습니다.
- 칠레에서는 전자상거래가 순조롭게 확대되고 있습니다. 칠레 유료 사용자 1인당 평균 연간 매출은 2020년 913달러에 달했습니다. 칠레의 쇼핑객에 의한 국경을 넘은 전자상거래 구매는 69%에 달할 전망입니다. 그 결과 엄청난 양의 데이터가 생성되어 전국의 데이터센터에 대한 수요가 증가하고 있습니다. 남미에서는 새로운 네트워크의 지속적인 배포, 디바이스 에코시스템의 확대, 소비자와 기업을 위한 새로운 용도의 개발로 5G로의 전환이 급속히 진행되고 있습니다.
이 지역에서는 은행, 비즈니스 및 통신 서비스에서 인터넷에 대한 의존도가 높아지고 있으며, FTTH 가입자 증가가 시장 성장을 이끌고 있습니다.
- 남미와 카리브해 국가에서는 고정 광대역 인터넷에 액세스할 수 있는 인구는 전체의 50% 이하이며 광섬유에 의한 인터넷 액세스는 불과 9.9%에 불과합니다. 많은 농촌 지역에서는 비싼 네트워크 장비로 인해 네트워크 커버리지가 불완전합니다. 칠레는 기타 국가들이 고정 광대역에서 추종하기 위한 기준을 세웠습니다. 칠레 데이터 다운로드 속도는 라틴아메리카에서 가장 빠릅니다. 평균 219Mbps의 칠레는 이 지역에서 가장 큰 경제 대국 브라질을 크게 벗어났으며 브라질의 인터넷 다운로드 속도는 평균 95.95Mbps입니다.
- 브라질 사람들은 COVID-19 팬데믹 기간 동안 뱅킹, 비즈니스, 커뮤니케이션 및 레저에서 점점 더 인터넷에 의존하고 있습니다. 그러나 2021년 4월 현재 브라질의 고정 광대역 통신 속도는 세계 49위, 모바일 통신 속도는 세계 74위였습니다. 이는 인터넷에 대한 액세스와 광대역 속도가 급속히 증가하고 있음을 나타내며, 데이터센터가 보다 빠른 데이터 전송, 보다 빠른 스토리지 속도 및 낮은 지연의 혜택을 받는다는 것을 의미합니다.
- 라틴아메리카 FTTH(FTTH) 시장은 2022년에 약 1억 500만 가구가 파이버에 접속되었고, 2021년 말에 비해 36% 증가, 2,800만 가구가 새롭게 파이버에 접속되었습니다. 보급률은 현재 61% 가까이에 달하고 있습니다.투자면에서는 2021년에 고정 브로드밴드(FTTH) 시장에 참가하기 위해, 칠레의 휴대폰 사업자 WOM가 디지털 인에이블먼트와 수익 관리 소프트웨어 기업 Aleppo와 제휴했습니다.
남미의 데이터센터 산업 개요
남미의 데이터센터 시장은 적당히 통합되어 있으며 상위 5개사에서 50.76%를 차지하고 있습니다.이 시장의 주요 기업은 Ascenty(Digital Realty Trust Inc.), Equinix Inc., HostDime Global Corp. 등입니다.
기타 혜택
- 엑셀 형식 시장 예측(ME) 시트
- 3개월간의 애널리스트 서포트
목차
제1장 주요 요약과 주요 조사 결과
제2장 보고서 제안
제3장 서론
- 조사의 전제조건과 시장 정의
- 조사 범위
- 조사 방법
제4장 시장 전망
- IT 부하 용량
- 바닥 공간 증가
- 코로케이션 수익
- 설치된 랙
- 랙 공간 활용
- 해저 케이블
제5장 주요 산업 동향
- 스마트폰 사용자수
- 스마트폰 1대당 데이터 트래픽
- 모바일 데이터 속도
- 광대역 데이터 속도
- 광섬유 접속 네트워크
- 규제 프레임워크
- 브라질
- 칠레
- 밸류체인과 유통채널 분석
제6장 시장 세분화
- 데이터센터의 규모
- 대규모
- 초대규모
- 중규모
- 메가규모
- 소규모
- 티어 유형
- Tier 1 및 2
- Tier 3
- Tier 4
- 흡수량
- 비이용
- 이용
- 코로케이션 유형별
- 하이퍼스케일
- 소매
- 도매
- 최종 사용자별
- BFSI
- 클라우드
- 전자상거래
- 정부
- 제조
- 미디어 및 엔터테인먼트
- 통신
- 기타
- 국가명
- 브라질
- 칠레
- 기타 남미
제7장 경쟁 구도
- 시장 점유율 분석
- 기업 상황
- 기업 프로파일
- Ascenty(Digital Realty Trust Inc.)
- EdgeUno Inc.
- Equinix Inc.
- GTD Grupo Teleductos SA
- HostDime Global Corp.
- Lumen Technologies Inc.
- NABIAX
- ODATA(Patria Investments Ltd)
- Quantico Data Center
- Scala Data Centers
- SONDA SA
- Terremark(Verizon)
제8장 CEO에 대한 주요 전략적 질문
제9장 부록
- 세계 개요
- 개요
- Five Forces 분석 프레임워크
- 세계의 밸류체인 분석
- 세계 시장 규모와 DRO
- 정보원과 참고문헌
- 도표 목록
- 주요 인사이트
- 데이터 팩
- 용어집
The South America Data Center Market size is estimated at 1.33 thousand MW in 2025, and is expected to reach 2.04 thousand MW by 2030, growing at a CAGR of 8.86%. Further, the market is expected to generate colocation revenue of USD 5,009.1 Million in 2025 and is projected to reach USD 8,524.7 Million by 2030, growing at a CAGR of 11.22% during the forecast period (2025-2030).
Tier 3 data centers accounts for majority market share in 2023, Tier-4 is the fastest growing in forecasted period
- The Tier 3 segment currently has a majority share in the South American market due to the major advantage of its features. This tier type has a high redundancy level and multiple paths for power and cooling. These data centers have an uptime of around 99.982%, translating into a downtime of 1.6 hours per year. With the increasing adoption of edge and cloud connectivity, the growth in the Tier 3 segment is expected to increase further.
- Brazil hosts the maximum number of Tier 3 data centers in the region. In 2022, 58 data centers in Brazil had Tier 3 certification. In 2022, Sao Paulo hosted the maximum number of Tier 3 data centers in the country, with a market share of 77.9% and Rio de Janeiro with 27.2%. Among other hotspots (Ceara, Cascavel, Curitiba, Ribeirao Preto, and others), the share was 14.8%. The Tier 3 segment is expected to grow from 649 MW in 2023 to 987.67 MW in 2029, at a projected CAGR of 7.25%.
- The Tier 4 segment is expected to record the highest CAGR of 20.94% during the forecast period. Various developed countries, such as Brazil, are focusing on adopting the Tier 4 certification to be completely fault-tolerant and redundant for every component. This is the major reason why even the developing regions are adopting the Tier 4 type. Major players in the market are expected to expand their facilities, which include Scala Data Centers (366 MW) with 17 facilities and ODATA (24 MW) with one facility during the forecast period.
- The Tier 1 & 2 segment is expected to showcase significant growth in developing countries, with a low GDP rate index in under-developed countries with a high expense burden. These countries include Bolivia, Paraguay, Suriname, and Ecuador, which have the majority of SMEs that cannot afford Tier 3 and 4 facilities.
Brazil holds the major share and expected to continue the dominance during the study period
- Brazil and Chile hold the largest shares in the South American data center market. The Brazilian government provides incentives through the Regime Especial de Tributacao do Programa Nacional de Banda Larga (REPNBL) program, which includes incentives for purchasing infrastructure that help improve colocation services in the country. Brazil has witnessed an absolute growth of 40% in investments from the 2021 values due to investments from colocation providers such as Ascenty, Scala Data Centers, and ODATA and telecom operators such as GlobeNet Telecom, Ava Telecom, and Embratel. Sao Paulo, Brazil's significant financial capital, serves as the primary data center hub. Other cities, such as Rio de Janeiro and Fortaleza, are major investment locations in Brazil.
- Chile has competitive energy prices, primarily fueled by plans to take advantage of its natural renewable energy generation potential over the coming years. Energy costs have dropped to one-third of what they were five years ago, mainly based on renewable energy that now makes up 46% of the total produced. Chile traditionally has some of the region's best telecommunications infrastructure, and two major fiber projects are underway to ensure it will have a fully redundant fiber backbone. These include the state-funded Fibra Optica Austral (FOA) submarine cable connecting the deep south and Gtd's 3,500 km north-south submarine cable. In 2022, colocation operators, such as Scala Data Centers, ODATA, Ascenty (Digital Realty), and EdgeConneX, were the major investors in the Chilean data center market.
- In Argentina, Buenos Aires is the major investment destination, with the identified third-party facilities in the city contributing to over 90% of the existing power capacity. Most existing data centers are smaller facilities built over a limited area. The International Renewable Energy Agency (IRENA) stated that renewable energy contributed to around 33% of the overall electricity capacity in 2020 in Argentina, and the country aims to generate 20% of the electricity via renewable sources by 2025. The country aims to be one of the largest data center hubs in the coming time period.
South America Data Center Market Trends
The high internet and smartphone technology adoption by various businesses and growing digital usage across the region drives the market demand
- In 2020, mobile technologies and services accounted for 7.1% of GDP in Latin America - a contribution that amounted to more than USD 340 billion of economic value added. The mobile ecosystem also supported more than 1.6 million jobs (directly and indirectly). By 2025, the economic contribution of the Latin American mobile ecosystem will grow by more than USD 30 billion as countries in the region increasingly benefit from the improvements in productivity and efficiency brought about by the increased take-up of mobile services.
- Digital usage is expanding rapidly in Brazil. The high internet and smartphone technology adoption by various businesses has impacted consumer behavior. More people in the country can now purchase smartphones, leading to a growing number of smartphone users. In May 2020, most shopping apps downloaded in South America were developed in Brazil, which stood out with approximately 44 million app downloads in this category.
- In Chile, e-commerce is expanding steadily. Chile's average annual revenue per paying user amounted to USD 913 in 2020. Most cross-border e-commerce purchases by Chilean shoppers stand at 69%. As a result, vast amounts of data have been created, increasing the demand for data centers nationwide. In South America, the transition to 5G is progressing rapidly, driven by the continued rollout of new networks, the expansion of the device ecosystem, and the development of new applications for consumers and enterprises.
People across the region increasingly reliant on the internet for banking, business, & telecommunication services and increasing FTTH subscribers across the region drives the market growth
- In South America and the Caribbean, less than 50% of the population has access to fixed broadband internet, and only 9.9% has fiber internet access. Many rural areas have patchy network coverage due to expensive network equipment. Chile has set the standard for other countries to follow in fixed broadband. Chile has the fastest data download speeds in Latin America. With an average rate of 219 Mbps, Chile is well ahead of the region's largest economy, Brazil, where internet download speeds average 95.95 Mbps.
- The Brazilian population became increasingly reliant on the internet for banking, business, telecommunication, and leisure during the COVID-19 pandemic. However, the country ranked 49th globally for fixed broadband speed and 74th for mobile speed as of April 2021. This shows that access to the internet and broadband speed are growing rapidly, meaning data centers will benefit from faster data transfer, higher storage rates, and lower latency.
- Latin America's fiber-to-the-home (FTTH) market was set to register approximately 105 million homes with fiber in 2022, an increase of 36%, or 28 million new premises, compared with the end of 2021. Latin America now has a fiber penetration rate of nearly 61%. In terms of investment, in 2021, to penetrate the fixed broadband (FTTH) market, Chilean mobile operator WOM teamed with digital enablement and revenue management software company Aleppo.
South America Data Center Industry Overview
The South America Data Center Market is moderately consolidated, with the top five companies occupying 50.76%. The major players in this market are Ascenty (Digital Realty Trust Inc.), Equinix Inc., HostDime Global Corp., Scala Data Centers and Terremark (Verizon) (sorted alphabetically).
Additional Benefits:
- The market estimate (ME) sheet in Excel format
- 3 months of analyst support
TABLE OF CONTENTS
1 EXECUTIVE SUMMARY & KEY FINDINGS
2 REPORT OFFERS
3 INTRODUCTION
- 3.1 Study Assumptions & Market Definition
- 3.2 Scope of the Study
- 3.3 Research Methodology
4 MARKET OUTLOOK
- 4.1 It Load Capacity
- 4.2 Raised Floor Space
- 4.3 Colocation Revenue
- 4.4 Installed Racks
- 4.5 Rack Space Utilization
- 4.6 Submarine Cable
5 Key Industry Trends
- 5.1 Smartphone Users
- 5.2 Data Traffic Per Smartphone
- 5.3 Mobile Data Speed
- 5.4 Broadband Data Speed
- 5.5 Fiber Connectivity Network
- 5.6 Regulatory Framework
- 5.6.1 Brazil
- 5.6.2 Chile
- 5.7 Value Chain & Distribution Channel Analysis
6 MARKET SEGMENTATION (INCLUDES MARKET SIZE IN VOLUME, FORECASTS UP TO 2030 AND ANALYSIS OF GROWTH PROSPECTS)
- 6.1 Data Center Size
- 6.1.1 Large
- 6.1.2 Massive
- 6.1.3 Medium
- 6.1.4 Mega
- 6.1.5 Small
- 6.2 Tier Type
- 6.2.1 Tier 1 and 2
- 6.2.2 Tier 3
- 6.2.3 Tier 4
- 6.3 Absorption
- 6.3.1 Non-Utilized
- 6.3.2 Utilized
- 6.3.2.1 By Colocation Type
- 6.3.2.1.1 Hyperscale
- 6.3.2.1.2 Retail
- 6.3.2.1.3 Wholesale
- 6.3.2.2 By End User
- 6.3.2.2.1 BFSI
- 6.3.2.2.2 Cloud
- 6.3.2.2.3 E-Commerce
- 6.3.2.2.4 Government
- 6.3.2.2.5 Manufacturing
- 6.3.2.2.6 Media & Entertainment
- 6.3.2.2.7 Telecom
- 6.3.2.2.8 Other End User
- 6.4 Country
- 6.4.1 Brazil
- 6.4.2 Chile
- 6.4.3 Rest of South America
7 COMPETITIVE LANDSCAPE
- 7.1 Market Share Analysis
- 7.2 Company Landscape
- 7.3 Company Profiles (includes Global Level Overview, Market Level Overview, Core Business Segments, Financials, Headcount, Key Information, Market Rank, Market Share, Products and Services, and Analysis of Recent Developments).
- 7.3.1 Ascenty (Digital Realty Trust Inc.)
- 7.3.2 EdgeUno Inc.
- 7.3.3 Equinix Inc.
- 7.3.4 GTD Grupo Teleductos SA
- 7.3.5 HostDime Global Corp.
- 7.3.6 Lumen Technologies Inc.
- 7.3.7 NABIAX
- 7.3.8 ODATA (Patria Investments Ltd)
- 7.3.9 Quantico Data Center
- 7.3.10 Scala Data Centers
- 7.3.11 SONDA SA
- 7.3.12 Terremark (Verizon)
- 7.4 LIST OF COMPANIES STUDIED
8 KEY STRATEGIC QUESTIONS FOR DATA CENTER CEOS
9 APPENDIX
- 9.1 Global Overview
- 9.1.1 Overview
- 9.1.2 Porter's Five Forces Framework
- 9.1.3 Global Value Chain Analysis
- 9.1.4 Global Market Size and DROs
- 9.2 Sources & References
- 9.3 List of Tables & Figures
- 9.4 Primary Insights
- 9.5 Data Pack
- 9.6 Glossary of Terms
